Grundlæggende statistik
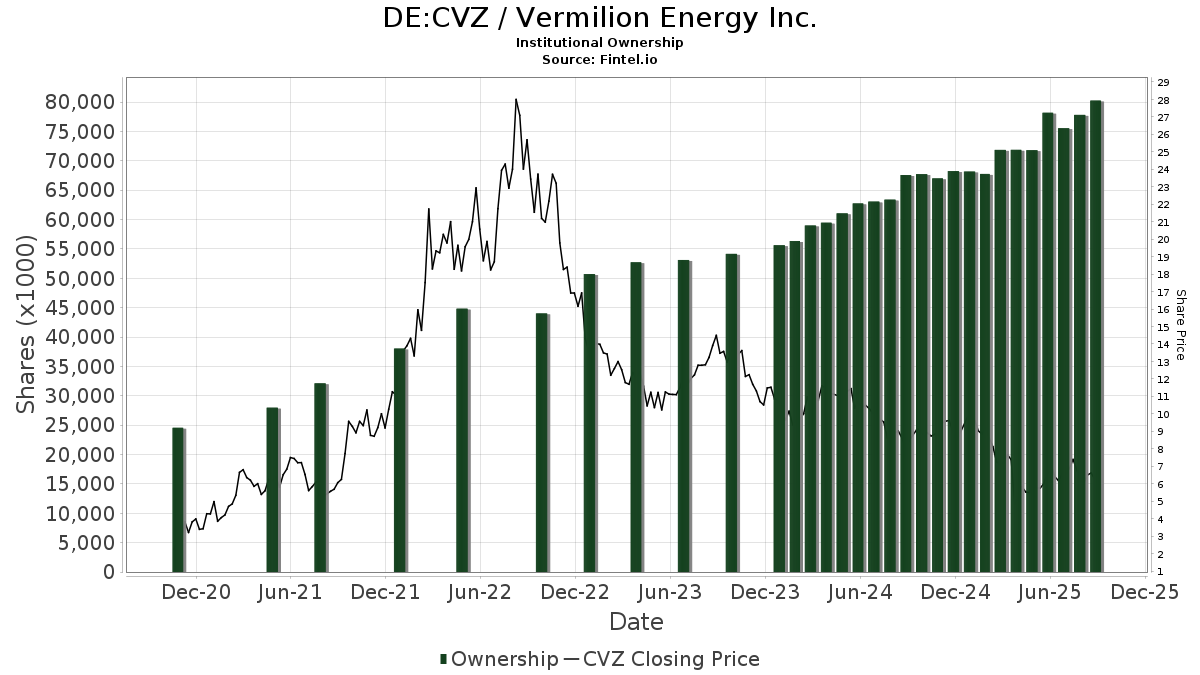
| Institutionelle aktier (lange) | 76.252.784 - 49,97% (ex 13D/G) - change of -1,98MM shares -2,53% MRQ |
| Institutionel værdi (lang) | $ 649.643 USD ($1000) |
Institutionelt ejerskab og aktionærer
Vermilion Energy Inc. (DE:CVZ) har 158 institutionelle ejere og aktionærer, der har indsendt 13D/G- eller 13F-formularer til Securities Exchange Commission (SEC). Disse institutioner har i alt 76,252,784 aktier. Største aktionærer omfatter Ameriprise Financial Inc, Vanguard Group Inc, UBS Group AG, Millennium Management Llc, Morgan Stanley, American Century Companies Inc, LM Asset (IM) Inc., Dimensional Fund Advisors Lp, Mackenzie Financial Corp, and SIG North Trading, ULC .
Vermilion Energy Inc. (DB:CVZ) institutionel ejerskabsstruktur viser aktuelle positioner i virksomheden efter institutioner og fonde, samt seneste ændringer i positionsstørrelse. Større aktionærer kan omfatte individuelle investorer, investeringsforeninger, hedgefonde eller institutioner. Skema 13D angiver, at investoren besidder (eller besidder) mere end 5 % af virksomheden og har til hensigt (eller har til hensigt at) aktivt at forfølge en ændring i forretningsstrategi. Skema 13G indikerer en passiv investering på over 5%.
The share price as of April 24, 2026 is 10,57 / share. Previously, on April 28, 2025, the share price was 5,62 / share. This represents an increase of 88,15% over that period.
Fondens stemningsscore
Fund Sentiment Score (fka Ownership Accumulation Score) finder de aktier, der bliver mest købt af fonde. Det er resultatet af en sofistikeret, multi-faktor kvantitativ model, der identificerer virksomheder med de højeste niveauer af institutionel akkumulering. Scoringsmodellen bruger en kombination af den samlede stigning i oplyste ejere, ændringerne i porteføljeallokeringer i disse ejere og andre målinger. Tallet går fra 0 til 100, hvor højere tal indikerer et højere niveau af akkumulering for sine jævnaldrende, og 50 er gennemsnittet.
Opdateringsfrekvens: Dagligt
Se Ownership Explorer, som giver en liste over højest rangerende virksomheder.
AI+ Ask Fintel’s AI assistant about Vermilion Energy Inc..
Select a question to share a public post with an AI-crafted answer.
Thinking of good questions…
13F og NPORT arkivering
Detaljer om 13F-arkivering er gratis. Detaljer om NP-ansøgninger kræver et premium-medlemskab. Grønne rækker angiver nye positioner. Røde rækker angiver lukkede positioner. Klik på linket ikon for at se den fulde transaktionshistorik.
Opgrader
for at låse premium-data op og eksportere til Excel ![]() .
.
| Fil dato | Kilde | Investor | Type | Gennemsnitlig pris (Øst) |
Aktier | Δ Aktier (%) |
Rapporteret Værdi ($1000) |
Δ Værdi (%) |
Port Alloc (%) |
|
|---|---|---|---|---|---|---|---|---|---|---|
| 2026-02-13 | 13F | Entropy Technologies, LP | 16.723 | 139 | ||||||
| 2026-02-11 | 13F | Spark Investment Management LLC | 277.000 | 2.305 | ||||||
| 2026-02-17 | 13F | Engineers Gate Manager LP | 32.133 | -37,33 | 268 | -33,25 | ||||
| 2026-02-06 | 13F | EverSource Wealth Advisors, LLC | 683 | -45,01 | 6 | -44,44 | ||||
| 2026-02-17 | 13F | Ameriprise Financial Inc | 8.197.506 | 9,12 | 68.367 | 16,38 | ||||
| 2026-02-17 | 13F | Trexquant Investment LP | 338.992 | 103,18 | 2.827 | 116,79 | ||||
| 2026-02-12 | 13F | Skopos Labs, Inc. | 24.960 | 206 | ||||||
| 2026-02-17 | 13F | Quadrature Capital Ltd | 476.878 | 179,37 | 3.973 | 198,27 | ||||
| 2026-02-18 | 13F | GWM Advisors LLC | 14.520 | 1,91 | 121 | 9,01 | ||||
| 2026-04-02 | 13F | Hilltop National Bank | 32.730 | 3,15 | 451 | 70,83 | ||||
| 2026-02-17 | 13F/A | Northwest & Ethical Investments L.P. | 19.531 | 30,11 | 163 | 38,46 | ||||
| 2026-03-09 | 13F | Flax Pond Capital, Llc | 288.700 | 2.408 | ||||||
| 2026-02-12 | 13F | Renaissance Technologies Llc | 109.300 | -49,89 | 912 | -46,57 | ||||
| 2026-04-15 | 13F | Albert D Mason Inc | 81.755 | 0,12 | 1.127 | 65,35 | ||||
| 2025-11-14 | 13F | Ubs Asset Management Americas Inc | 0 | -100,00 | 0 | |||||
| 2026-02-13 | 13F | Colony Group, LLC | 137.500 | 1,48 | 1.077 | 1,61 | ||||
| 2026-02-13 | 13F | Rhumbline Advisers | 5 | 0,00 | 0 | |||||
| 2026-02-10 | 13F | Connor, Clark & Lunn Investment Management Ltd. | 852.135 | -21,83 | 7.090 | -16,71 | ||||
| 2026-01-30 | 13F | Mitsubishi UFJ Trust & Banking Corp | 240.928 | -1,75 | 1.981 | 3,39 | ||||
| 2026-02-13 | 13F | JustInvest LLC | 70.832 | 10,89 | 591 | 18,24 | ||||
| 2025-11-14 | 13F | Squarepoint Ops LLC | Put | 0 | -100,00 | 0 | ||||
| 2025-11-14 | 13F | Squarepoint Ops LLC | 0 | -100,00 | 0 | |||||
| 2025-11-14 | 13F | Wolverine Trading, Llc | 84.148 | -27,00 | 677 | -20,54 | ||||
| 2025-11-14 | 13F | Wolverine Trading, Llc | Call | 248.900 | 7,38 | 2.004 | 16,79 | |||
| 2025-11-14 | 13F | ExodusPoint Capital Management, LP | 38.800 | -29,69 | 303 | |||||
| 2025-11-14 | 13F | Wolverine Trading, Llc | Put | 103.100 | 0,49 | 830 | 9,22 | |||
| 2026-02-05 | 13F | Cambridge Investment Research Advisors, Inc. | 0 | -100,00 | 0 | |||||
| 2026-02-13 | 13F | Aigen Investment Management, Lp | 0 | -100,00 | 0 | -100,00 | ||||
| 2026-01-21 | 13F | Flagship Harbor Advisors, Llc | 500 | 4 | ||||||
| 2026-01-30 | 13F | Us Bancorp \de\ | 200 | 0,00 | 2 | 0,00 | ||||
| 2026-02-10 | 13F | Quantbot Technologies LP | 227.986 | 45,57 | 1.901 | 55,31 | ||||
| 2026-02-17 | 13F | Lazard Asset Management Llc | 18.973 | 158 | ||||||
| 2026-02-17 | 13F | Magnetar Financial LLC | 29.456 | 246 | ||||||
| 2026-02-13 | 13F | Bank Of Nova Scotia | 2.266.405 | 0,95 | 18.856 | 7,52 | ||||
| 2026-02-12 | 13F | Scotia Capital Inc. | 29.974 | -43,58 | 249 | -40,10 | ||||
| 2026-02-12 | 13F | Aegis Financial Corp | 1.320.492 | 51,69 | 11.002 | 61,77 | ||||
| 2025-11-14 | 13F | Gluskin Sheff & Assoc Inc | 0 | -100,00 | 0 | |||||
| 2026-02-17 | 13F | D. E. Shaw & Co., Inc. | 303.151 | -12,89 | 2.523 | -7,18 | ||||
| 2026-02-17 | 13F | D. E. Shaw & Co., Inc. | Call | 270.000 | 0,00 | 2.247 | 6,55 | |||
| 2026-02-13 | 13F | Charles Schwab Investment Management Inc | 943.900 | 2,41 | 7.864 | 9,21 | ||||
| 2026-02-17 | 13F | D. E. Shaw & Co., Inc. | Put | 490.000 | 0,00 | 4.077 | 6,56 | |||
| 2026-02-13 | 13F | Brooklands Fund Management Ltd | Call | 0 | -100,00 | 0 | -100,00 | |||
| 2026-02-13 | 13F | Great West Life Assurance Co /can/ | 36.486 | 0,00 | 0 | |||||
| 2026-01-29 | 13F | IMC-Chicago, LLC | 63.839 | -5,21 | 532 | 1,14 | ||||
| 2026-02-05 | 13F | Allworth Financial LP | 450 | 0,00 | 4 | 0,00 | ||||
| 2026-02-09 | 13F | Royce & Associates Lp | 875.980 | -8,03 | 7.288 | -2,03 | ||||
| 2026-04-21 | 13F | PharVision Advisers, LLC | 0 | -100,00 | 0 | |||||
| 2026-02-13 | 13F | Caitong International Asset Management Co., Ltd | 1 | -88,89 | 0 | |||||
| 2026-02-17 | 13F | Bank Of America Corp /de/ | 1.496.728 | 6,95 | 12.483 | 14,06 | ||||
| 2026-02-18 | 13F | Mackenzie Financial Corp | 3.174.261 | 130,25 | 26.483 | 146,01 | ||||
| 2026-01-23 | 13F | Optima Capital Llc | 1.475 | 12 | ||||||
| 2026-04-22 | 13F | Pictet Asset Management Holding SA | 33.304 | 27,07 | 457 | 109,63 | ||||
| 2026-02-17 | 13F | Balyasny Asset Management Llc | 0 | -100,00 | 0 | |||||
| 2025-11-14 | 13F | Peak6 Llc | Call | 0 | -100,00 | 0 | ||||
| 2026-02-17 | 13F | Two Sigma Advisers, Lp | 697.176 | -19,02 | 5.814 | -13,64 | ||||
| 2026-02-12 | 13F | CoreCommodity Management, LLC | 81.687 | -16,18 | 680 | -10,53 | ||||
| 2026-02-17 | 13F | Grantham, Mayo, Van Otterloo & Co. LLC | 0 | -100,00 | 0 | |||||
| 2026-04-17 | 13F | Vermillion Wealth Management, Inc. | 1.000 | 0,00 | 14 | 62,50 | ||||
| 2026-04-22 | 13F | Stone House Investment Management, LLC | 7 | 0 | ||||||
| 2026-01-27 | 13F | TD Waterhouse Canada Inc. | 43.476 | -13,53 | 361 | -9,98 | ||||
| 2026-02-10 | 13F | Goldman Sachs Group Inc | 501.275 | -1,21 | 4.181 | 5,37 | ||||
| 2026-02-17 | 13F | Investment Management Corp of Ontario | 18.818 | 157 | ||||||
| 2025-11-13 | 13F | Arrowstreet Capital, Limited Partnership | 0 | -100,00 | 0 | |||||
| 2026-02-12 | 13F | Hrt Financial Lp | 23.582 | 0 | ||||||
| 2026-02-12 | 13F | Counterpoint Mutual Funds LLC | 0 | -100,00 | 0 | -100,00 | ||||
| 2026-02-12 | 13F | Dimensional Fund Advisors Lp | 3.382.587 | 9,02 | 28.211 | 16,27 | ||||
| 2026-02-17 | 13F | Two Sigma Securities, Llc | 13.238 | -3,61 | 110 | 2,80 | ||||
| 2026-02-09 | 13F | Legal & General Group Plc | 166.960 | -16,19 | 1.391 | -10,67 | ||||
| 2026-02-10 | 13F | State of Wyoming | 8.929 | 24,32 | 74 | 32,14 | ||||
| 2026-02-13 | 13F | National Bank Of Canada /fi/ | 1.801.456 | -5,84 | 14.971 | 0,22 | ||||
| 2026-01-22 | 13F | Bear Mountain Capital, Inc. | 18 | 0,00 | 0 | |||||
| 2026-02-10 | 13F | Acadian Asset Management Llc | 16.400 | 300,00 | 0 | |||||
| 2026-02-11 | 13F | Simplex Trading, Llc | 2.241 | 19 | ||||||
| 2026-02-12 | 13F | Nuveen, LLC | 121.343 | 0,00 | 1.011 | 6,65 | ||||
| 2026-02-13 | 13F | American Century Companies Inc | 3.926.666 | 1,65 | 32.671 | 8,28 | ||||
| 2026-02-13 | 13F | Police & Firemen's Retirement System of New Jersey | 54.634 | 0,00 | 455 | 6,81 | ||||
| 2026-02-17 | 13F | Alliancebernstein L.p. | 15.851 | 0,00 | 132 | 7,32 | ||||
| 2026-04-23 | 13F | Oppenheimer & Co Inc | 2.359.218 | 640,85 | 32.510 | 1.124,48 | ||||
| 2026-02-13 | 13F | Quarry LP | 1.717 | 14 | ||||||
| 2026-02-17 | 13F | Susquehanna International Group, Llp | Put | 123.500 | -52,04 | 1.030 | -48,88 | |||
| 2026-02-17 | 13F | Susquehanna International Group, Llp | Call | 596.700 | 5,82 | 4.976 | 12,86 | |||
| 2026-02-17 | 13F | Susquehanna International Group, Llp | 220.483 | -47,09 | 1.839 | -43,59 | ||||
| 2026-02-17 | 13F | Millennium Management Llc | 5.442.278 | -33,75 | 45.310 | -29,38 | ||||
| 2025-10-31 | 13F | Y-Intercept (Hong Kong) Ltd | 0 | -100,00 | 0 | -100,00 | ||||
| 2026-02-10 | 13F | Jupiter Asset Management Ltd | 402.315 | 0,00 | 3.352 | 6,65 | ||||
| 2026-02-17 | 13F | Canada Pension Plan Investment Board | 117.728 | 0,00 | 980 | 6,53 | ||||
| 2026-02-06 | 13F | Pnc Financial Services Group, Inc. | 239 | 455,81 | 2 | |||||
| 2026-02-13 | 13F | Barclays Plc | 614 | -99,24 | 5 | -99,21 | ||||
| 2026-02-17 | 13F | Numerai GP LLC | 294.521 | 0,05 | 2.456 | 6,69 | ||||
| 2026-02-17 | 13F | Voleon Capital Management Lp | 273.845 | 172,34 | 2.284 | 190,46 | ||||
| 2025-11-13 | 13F/A | Peak6 Llc | Put | 0 | -100,00 | 0 | -100,00 | |||
| 2026-02-17 | 13F | Mercer Global Advisors Inc /adv | 11.846 | 12,21 | 99 | 19,51 | ||||
| 2025-11-14 | 13F | Lincluden Management Ltd | 0 | -100,00 | 0 | |||||
| 2025-12-29 | 13F | Swiss Life Asset Management Ltd | 0 | -100,00 | 0 | -100,00 | ||||
| 2026-02-11 | 13F | Allianz Asset Management GmbH | 23.588 | 197 | ||||||
| 2026-02-13 | 13F | Morgan Stanley | 4.028.433 | 24,61 | 33.597 | 32,90 | ||||
| 2026-02-13 | 13F | Timelo Investment Management Inc. | 25.000 | -50,00 | 208 | -46,80 | ||||
| 2026-02-19 | 13F | Invesco Ltd. | 93.694 | 6,07 | 781 | 13,19 | ||||
| 2026-02-06 | 13F | FourThought Financial Partners, LLC | 18.425 | 154 | ||||||
| 2026-02-10 | 13F | Savant Capital, LLC | 35.235 | 175,27 | 294 | 193,00 | ||||
| 2026-02-10 | 13F | Td Asset Management Inc | 489.855 | 3,11 | 4.081 | 9,97 | ||||
| 2026-01-27 | 13F | WealthCollab, LLC | 376 | 0,00 | 3 | 50,00 | ||||
| 2026-02-13 | 13F | BRITISH COLUMBIA INVESTMENT MANAGEMENT Corp | 81.825 | -8,93 | 681 | -3,00 | ||||
| 2026-02-17 | 13F | Qube Research & Technologies Ltd | 76.692 | 640 | ||||||
| 2026-02-17 | 13F | Royal Bank Of Canada | 145.861 | -93,06 | 1.217 | -92,60 | ||||
| 2026-02-17 | 13F | Brevan Howard Capital Management LP | 10.185 | 85 | ||||||
| 2026-04-21 | 13F | Penbrook Management LLC | 197.825 | 0,00 | 2.718 | 64,87 | ||||
| 2026-02-17 | 13F | Man Group plc | 83.187 | 694 | ||||||
| 2025-11-14 | 13F | Larson Financial Group LLC | 0 | -100,00 | 0 | |||||
| 2026-02-10 | 13F | CIBC World Markets Inc. | Put | 128.900 | -38,62 | 1.072 | -34,59 | |||
| 2026-02-10 | 13F | CIBC World Markets Inc. | 299.668 | -15,37 | 2.493 | -9,84 | ||||
| 2026-01-27 | 13F | Zurcher Kantonalbank (Zurich Cantonalbank) | 56.126 | -26,38 | 468 | -21,51 | ||||
| 2026-02-12 | 13F | Jane Street Group, Llc | 577.596 | 233,69 | 4.807 | 255,74 | ||||
| 2026-04-16 | 13F | Tactive Advisors, LLC | 98.989 | -5,31 | 1.364 | 56,60 | ||||
| 2026-02-10 | 13F | Clear Harbor Asset Management, LLC | 131.201 | 0,57 | 1.093 | 7,26 | ||||
| 2026-02-12 | 13F | Jane Street Group, Llc | Put | 36.800 | 71,96 | 306 | 83,23 | |||
| 2026-02-12 | 13F | Jane Street Group, Llc | Call | 94.000 | 137,37 | 782 | 153,07 | |||
| 2026-02-12 | 13F | Commonwealth Equity Services, Llc | 92.930 | 775 | ||||||
| 2026-02-09 | 13F | Geode Capital Management, Llc | 107.657 | 9,28 | 917 | 18,35 | ||||
| 2026-04-13 | 13F | IFP Advisors, Inc | 200 | 3 | ||||||
| 2026-02-12 | 13F | Steward Partners Investment Advisory, Llc | 104 | 0,97 | 1 | |||||
| 2026-02-17 | 13F | Aquatic Capital Management LLC | 0 | -100,00 | 0 | |||||
| 2026-02-17 | 13F | Advisor Group Holdings, Inc. | 62.979 | 3,20 | 525 | 12,69 | ||||
| 2026-02-12 | 13F | BRYN MAWR TRUST Co | 291 | 2 | ||||||
| 2025-11-21 | 13F/A | Royal Bank Of Canada | Put | 0 | -100,00 | 0 | -100,00 | |||
| 2026-02-17 | 13F | Aqr Capital Management Llc | 36.851 | 307 | ||||||
| 2026-02-17 | 13F | Russell Investments Group, Ltd. | 50.505 | -19,86 | 421 | -14,81 | ||||
| 2026-02-13 | 13F/A | Alberta Investment Management Corp | 0 | -100,00 | 0 | |||||
| 2026-02-11 | 13F | Jpmorgan Chase & Co | 599.671 | 18,95 | 5.001 | 26,86 | ||||
| 2026-01-30 | 13F | Pekin Hardy Strauss, Inc. | 122.375 | 26,98 | 1.020 | 35,33 | ||||
| 2026-02-13 | 13F | Dynamic Technology Lab Private Ltd | 44.545 | 372 | ||||||
| 2026-02-11 | 13F | Vise Technologies, Inc. | 0 | -100,00 | 0 | |||||
| 2025-11-14 | 13F | Raymond James Financial Inc | 0 | -100,00 | 0 | -100,00 | ||||
| 2026-01-30 | 13F | ARGA Investment Management, LP | 105.369 | 0,00 | 877 | 6,44 | ||||
| 2026-02-06 | 13F | Cumberland Partners Ltd | 67.313 | 561 | ||||||
| 2026-02-13 | 13F | LM Asset (IM) Inc. | 3.772.600 | 28,23 | 31.434 | 36,83 | ||||
| 2025-11-13 | 13F | Promus Capital, LLC | 0 | -100,00 | 0 | |||||
| 2026-02-17 | 13F | PDT Partners, LLC | 74.486 | 100,32 | 621 | 114,14 | ||||
| 2026-02-17 | 13F | Gotham Asset Management, LLC | 24.075 | 201 | ||||||
| 2025-11-12 | 13F | Headlands Technologies LLC | 0 | -100,00 | 0 | |||||
| 2025-11-21 | 13F | Nebula Research & Development LLC | 0 | -100,00 | 0 | |||||
| 2026-02-17 | 13F | Voloridge Investment Management, Llc | 695.460 | 20,92 | 5.800 | 28,97 | ||||
| 2026-02-14 | 13F | Rockefeller Capital Management L.P. | 458 | 0,00 | 4 | 0,00 | ||||
| 2025-11-07 | 13F | Shell Asset Management Co | 2.327 | -71,24 | 0 | |||||
| 2026-01-26 | 13F | Cwm, Llc | 400 | 0 | ||||||
| 2026-02-13 | 13F | Kilter Group LLC | 40 | -92,55 | 0 | -100,00 | ||||
| 2026-02-17 | 13F | Tower Research Capital LLC (TRC) | 9.521 | -40,15 | 79 | -36,29 | ||||
| 2025-11-12 | 13F | Arete Wealth Advisors, LLC | 0 | -100,00 | 0 | |||||
| 2026-02-13 | 13F | Wells Fargo & Company/mn | 900 | 0,22 | 7 | 0,00 | ||||
| 2026-02-13 | 13F | Citigroup Inc | 164.316 | -6,75 | 1.369 | -0,58 | ||||
| 2026-02-17 | 13F | Two Sigma Investments, Lp | 1.369.227 | 141,64 | 11.419 | 157,71 | ||||
| 2025-11-10 | 13F | Everstar Asset Management, LLC | 0 | -100,00 | 0 | -100,00 | ||||
| 2026-02-13 | 13F | First Trust Advisors Lp | 693.763 | 22,24 | 5.786 | 30,35 | ||||
| 2026-02-11 | 13F | Renaissance Group Llc | 74.343 | -16,75 | 620 | -11,17 | ||||
| 2026-02-12 | 13F | Swiss National Bank | 304.567 | 2,52 | 2.539 | 9,39 | ||||
| 2026-02-17 | 13F/A | Cantor Fitzgerald, L. P. | 0 | -100,00 | 0 | -100,00 | ||||
| 2026-02-17 | 13F | XTX Topco Ltd | 53.664 | 448 | ||||||
| 2026-02-13 | 13F | Manufacturers Life Insurance Company, The | 0 | -100,00 | 0 | |||||
| 2026-02-17 | 13F | Css Llc/il | 0 | -100,00 | 0 | |||||
| 2026-02-03 | 13F | SBI Securities Co., Ltd. | 6 | -25,00 | 0 | |||||
| 2026-02-17 | 13F | Schonfeld Strategic Advisors LLC | 77.102 | 643 | ||||||
| 2026-02-13 | 13F | Vontobel Holding Ltd. | 363.000 | 67,28 | 3.020 | 78,28 | ||||
| 2026-02-10 | 13F | CIBC Asset Management Inc | 144.324 | 10,32 | 1.202 | 17,75 | ||||
| 2026-02-17 | 13F | Clear Street Markets Llc | 98.700 | 823 | ||||||
| 2026-04-20 | 13F | Ronald Blue Trust, Inc. | 1.975 | -2,71 | 27 | 68,75 | ||||
| 2026-02-17 | 13F | Public Employees Retirement System Of Ohio | 254.312 | 1,56 | 2.119 | 8,28 | ||||
| 2026-02-17 | 13F | Citadel Advisors Llc | Put | 196.500 | 23,04 | 1.639 | 31,25 | |||
| 2026-02-17 | 13F | Citadel Advisors Llc | Call | 455.600 | 161,99 | 3.800 | 179,54 | |||
| 2026-02-17 | 13F | Citadel Advisors Llc | 1.097.383 | 226,60 | 9.152 | 248,38 | ||||
| 2026-04-22 | 13F | Gold Investment Management Ltd. | 800 | 0,00 | 11 | 83,33 | ||||
| 2026-02-17 | 13F | Graham Capital Management, L.P. | 21.034 | 175 | ||||||
| 2026-04-21 | 13F | Drum Hill Capital, LLC | 369.711 | 41,34 | 5.095 | 133,56 | ||||
| 2026-04-09 | 13F | Pacifica Partners Inc. | 444 | 0,00 | 6 | 100,00 | ||||
| 2026-01-20 | 13F | Stratos Wealth Partners, LTD. | 165.848 | 0,04 | 1.383 | 6,71 | ||||
| 2026-02-10 | 13F | Bnp Paribas Arbitrage, Sa | 82.430 | 185,88 | 687 | 205,33 | ||||
| 2026-01-29 | 13F | UBS Group AG | 5.592.890 | 118,17 | 46.645 | 132,67 | ||||
| 2026-02-02 | 13F | Intact Investment Management Inc. | 1.089.100 | 0,80 | 9.061 | 7,36 | ||||
| 2025-11-05 | 13F | Plato Investment Management Ltd | 0 | -100,00 | 0 | |||||
| 2026-01-14 | 13F | Net Worth Advisory Group | 20.649 | -0,25 | 172 | 6,83 | ||||
| 2026-02-11 | 13F | Deutsche Bank Ag\ | 31.492 | -23,13 | 263 | -18,12 | ||||
| 2026-02-18 | 13F | Vident Advisory, LLC | 43.818 | -7,89 | 365 | -1,62 | ||||
| 2026-02-13 | 13F | Cornerstone Financial Management LLC | 58 | 0 | ||||||
| 2026-02-17 | 13F | Algert Global Llc | 31.392 | 0 | ||||||
| 2026-03-06 | 13F | Hsbc Holdings Plc | 0 | -100,00 | 0 | |||||
| 2026-04-07 | 13F | Farther Finance Advisors, LLC | 205 | 0,00 | 3 | 100,00 | ||||
| 2026-02-13 | 13F | Verition Fund Management LLC | 139.174 | 1.161 | ||||||
| 2025-11-14 | 13F | Walleye Capital LLC | Call | 0 | -100,00 | 0 | ||||
| 2026-02-12 | 13F | Bank Of Montreal /can/ | 749.681 | 18,60 | 6.238 | 26,36 | ||||
| 2025-11-14 | 13F | Walleye Capital LLC | Put | 0 | -100,00 | 0 | ||||
| 2026-04-21 | 13F | Vigil Wealth Management, LLC | 0 | -100,00 | 0 | |||||
| 2026-02-17 | 13F | Optiver Holding B.V. | 527 | -34,04 | 4 | -33,33 | ||||
| 2026-02-17 | 13F | Toronto Dominion Bank | Put | 94.000 | 178,93 | 782 | 197,34 | |||
| 2026-04-21 | 13F | Gilpin Wealth Management, Llc | 481 | -30,19 | 7 | 20,00 | ||||
| 2026-02-12 | 13F | Intesa Sanpaolo Wealth Management | 13.800 | 115 | ||||||
| 2026-02-17 | 13F | Toronto Dominion Bank | 192.944 | 809,30 | 1.605 | 872,73 | ||||
| 2026-02-17 | 13F | Toronto Dominion Bank | Call | 52.700 | 40,16 | 438 | 49,49 | |||
| 2026-04-16 | 13F | SG Americas Securities, LLC | 62.748 | -5,99 | 1 | |||||
| 2026-04-22 | 13F | Janney Montgomery Scott LLC | 163.882 | -11,17 | 2 | 100,00 | ||||
| 2026-02-11 | 13F | LPL Financial LLC | 10.999 | 92 | ||||||
| 2025-11-12 | 13F | Group One Trading, L.p. | 0 | -100,00 | 0 | |||||
| 2026-01-29 | 13F | Vanguard Group Inc | 6.731.403 | 1,10 | 56.005 | 7,69 | ||||
| 2025-11-10 | 13F | MAI Capital Management | 0 | -100,00 | 0 | |||||
| 2026-02-12 | 13F | Arbiter Partners Capital Management LLC | 266.738 | 6,60 | 2.225 | 13,70 | ||||
| 2026-02-17 | 13F | Susquehanna Fundamental Investments, Llc | 63.900 | -37,41 | 533 | -33,33 | ||||
| 2026-02-12 | 13F | Bank Of Nova Scotia Trust Co | 10.000 | 0,00 | 83 | 6,41 | ||||
| 2026-02-17 | 13F | Wellington Management Group Llp | 127.562 | 1.063 | ||||||
| 2026-02-13 | 13F | Walleye Trading LLC | Put | 12.800 | 107 | |||||
| 2026-02-17 | 13F | SIG North Trading, ULC | Put | 2.898.000 | 480,65 | 24.169 | 519,40 | |||
| 2026-02-12 | 13F | Federation des caisses Desjardins du Quebec | 143.277 | -4,29 | 1.191 | 1,97 | ||||
| 2026-02-13 | 13F | Walleye Trading LLC | Call | 5.200 | 43 | |||||
| 2026-02-17 | 13F | SIG North Trading, ULC | Call | 88.800 | 4,23 | 741 | 11,11 | |||
| 2025-11-13 | 13F/A | Peak6 Llc | 0 | -100,00 | 0 | -100,00 | ||||
| 2026-02-10 | 13F | Envestnet Asset Management Inc | 0 | -100,00 | 0 | |||||
| 2026-02-17 | 13F | SIG North Trading, ULC | 922.829 | 81,55 | 7.696 | 93,66 |