Grundlæggende statistik
| Institutionelle ejere | 67 total, 66 long only, 1 short only, 0 long/short - change of 7,94% MRQ |
| Del pris | 36,60 |
| Gennemsnitlig porteføljeallokering | 0.0238 % - change of -34,27% MRQ |
| Institutionelle aktier (lange) | 2.130.166 (ex 13D/G) - change of -0,07MM shares -2,99% MRQ |
| Institutionel værdi (lang) | $ 55.230 USD ($1000) |
Institutionelt ejerskab og aktionærer
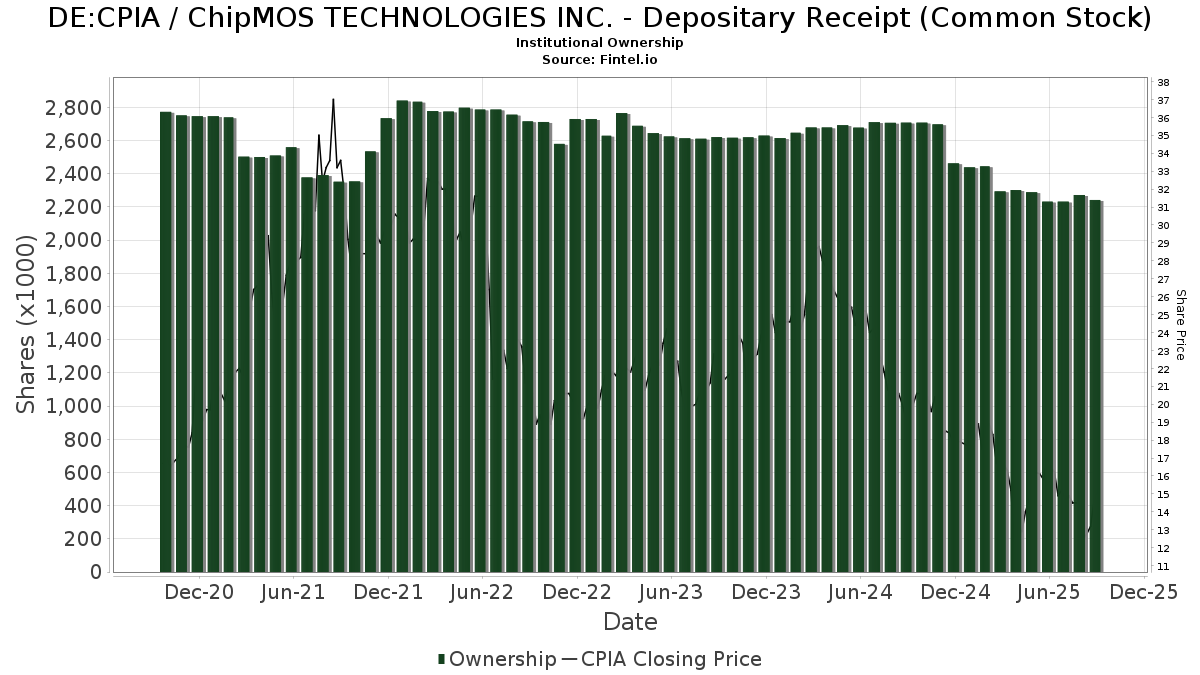
ChipMOS TECHNOLOGIES INC. - Depositary Receipt (Common Stock) (DE:CPIA) har 67 institutionelle ejere og aktionærer, der har indsendt 13D/G- eller 13F-formularer til Securities Exchange Commission (SEC). Disse institutioner har i alt 2,130,166 aktier. Største aktionærer omfatter Renaissance Technologies Llc, Acadian Asset Management Llc, BlackRock, Inc., Freemont Management S.A., Dimensional Fund Advisors Lp, JustInvest LLC, DFCEX - Emerging Markets Core Equity Portfolio - Institutional Class, Creative Planning, Renaissance Group Llc, and Susquehanna International Group, Llp .
ChipMOS TECHNOLOGIES INC. - Depositary Receipt (Common Stock) (DB:CPIA) institutionel ejerskabsstruktur viser aktuelle positioner i virksomheden efter institutioner og fonde, samt seneste ændringer i positionsstørrelse. Større aktionærer kan omfatte individuelle investorer, investeringsforeninger, hedgefonde eller institutioner. Skema 13D angiver, at investoren besidder (eller besidder) mere end 5 % af virksomheden og har til hensigt (eller har til hensigt at) aktivt at forfølge en ændring i forretningsstrategi. Skema 13G indikerer en passiv investering på over 5%.
The share price as of March 2, 2026 is 36,60 / share. Previously, on March 6, 2025, the share price was 16,80 / share. This represents an increase of 117,86% over that period.
Fondens stemningsscore
Fund Sentiment Score (fka Ownership Accumulation Score) finder de aktier, der bliver mest købt af fonde. Det er resultatet af en sofistikeret, multi-faktor kvantitativ model, der identificerer virksomheder med de højeste niveauer af institutionel akkumulering. Scoringsmodellen bruger en kombination af den samlede stigning i oplyste ejere, ændringerne i porteføljeallokeringer i disse ejere og andre målinger. Tallet går fra 0 til 100, hvor højere tal indikerer et højere niveau af akkumulering for sine jævnaldrende, og 50 er gennemsnittet.
Opdateringsfrekvens: Dagligt
Se Ownership Explorer, som giver en liste over højest rangerende virksomheder.
AI+ Ask Fintel’s AI assistant about ChipMOS TECHNOLOGIES INC. - Depositary Receipt (Common Stock).
Select a question to share a public post with an AI-crafted answer.
Thinking of good questions…
13F og NPORT arkivering
Detaljer om 13F-arkivering er gratis. Detaljer om NP-ansøgninger kræver et premium-medlemskab. Grønne rækker angiver nye positioner. Røde rækker angiver lukkede positioner. Klik på linket ikon for at se den fulde transaktionshistorik.
Opgrader
for at låse premium-data op og eksportere til Excel ![]() .
.
| Fil dato | Kilde | Investor | Type | Gennemsnitlig pris (Øst) |
Aktier | Δ Aktier (%) |
Rapporteret Værdi ($1000) |
Δ Værdi (%) |
Port Alloc (%) |
|
|---|---|---|---|---|---|---|---|---|---|---|
| 2026-01-23 | 13F | Farther Finance Advisors, LLC | 1.185 | 16.828,57 | 35 | |||||
| 2026-02-03 | 13F | SBI Securities Co., Ltd. | 63 | 2.000,00 | 2 | |||||
| 2026-02-11 | 13F | Jpmorgan Chase & Co | 80 | 0,00 | 2 | 100,00 | ||||
| 2026-02-03 | 13F | Coston, McIsaac & Partners | 217 | 0,00 | 0 | |||||
| 2025-09-25 | NP | Dimensional Emerging Markets Value Fund - Dimensional Emerging Markets Value Fund This fund is a listed as child fund of Dimensional Fund Advisors Lp and if that institution has disclosed ownership in this security, then these positions will not be double counted when calculating total shares and total value | 19.378 | -14,51 | 329 | -12,30 | ||||
| 2026-02-03 | 13F | Ballentine Partners, LLC | 21.521 | 5,02 | 638 | 62,92 | ||||
| 2026-02-03 | 13F | Winch Advisory Services, LLC | 60 | 0,00 | 2 | 0,00 | ||||
| 2026-01-23 | 13F | Westside Investment Management, Inc. | 2.163 | 0,00 | 66 | 60,98 | ||||
| 2026-02-10 | 13F | Acadian Asset Management Llc | 253.252 | -4,57 | 7 | 40,00 | ||||
| 2026-02-12 | 13F | XY Capital Ltd | 10.596 | 314 | ||||||
| 2026-02-11 | 13F | LPL Financial LLC | 11.058 | -0,63 | 328 | 54,25 | ||||
| 2025-09-25 | NP | DFAE - Dimensional Emerging Core Equity Market ETF | 1.700 | 0,00 | 29 | 0,00 | ||||
| 2026-02-13 | 13F | Citigroup Inc | 48 | 4.700,00 | 1 | |||||
| 2026-01-29 | 13F | UMA Financial Services, Inc. | 473 | -12,24 | 14 | 40,00 | ||||
| 2026-02-13 | 13F | Smartleaf Asset Management LLC | 1.774 | 54 | ||||||
| 2026-02-17 | 13F | Royal Bank Of Canada | 377 | 0,00 | 11 | 57,14 | ||||
| 2025-09-25 | NP | DEXC - Dimensional Emerging Markets ex China Core Equity ETF | 402 | 164,47 | 7 | 200,00 | ||||
| 2025-11-12 | 13F | Principal Securities, Inc. | 0 | -100,00 | 0 | |||||
| 2026-02-04 | 13F | Abc Arbitrage Sa | 0 | -100,00 | 0 | |||||
| 2026-02-13 | 13F | Wells Fargo & Company/mn | 0 | -100,00 | 0 | |||||
| 2026-01-14 | 13F | Moisand Fitzgerald Tamayo, LLC | 39 | 0,00 | 1 | |||||
| 2026-02-05 | 13F | Freemont Management S.A. | Call | 110.000 | 4.070 | |||||
| 2026-02-13 | 13F | Cornerstone Financial Management LLC | 56 | 2 | ||||||
| 2025-11-14 | 13F | Raymond James Financial Inc | 0 | -100,00 | 0 | |||||
| 2026-02-12 | 13F | Dimensional Fund Advisors Lp | 91.919 | 0,39 | 2.727 | 55,42 | ||||
| 2026-02-17 | 13F | Citadel Advisors Llc | 16.268 | -22,77 | 483 | 19,60 | ||||
| 2026-02-17 | 13F/A | RBF Capital, LLC | 8.965 | 266 | ||||||
| 2026-01-26 | 13F | JNBA Financial Advisors | 1.000 | 0,00 | 30 | 52,63 | ||||
| 2026-02-17 | 13F | Advisor Group Holdings, Inc. | 238 | -22,98 | 7 | 40,00 | ||||
| 2026-01-22 | 13F | HHM Wealth Advisors, LLC | 7 | 0,00 | 0 | |||||
| 2026-02-17 | 13F | Susquehanna International Group, Llp | Put | 35.400 | 1.050 | |||||
| 2025-09-25 | NP | DFA INVESTMENT DIMENSIONS GROUP INC - Emerging Markets Social Core Equity Portfolio Shares | 2.048 | 0,00 | 35 | 3,03 | ||||
| 2026-02-12 | 13F | Federation des caisses Desjardins du Quebec | 264 | -40,27 | 8 | -12,50 | ||||
| 2026-02-24 | 13F | Bell Investment Advisors, Inc | 1.399 | 23,70 | 41 | 95,24 | ||||
| 2025-11-07 | 13F | Pnc Financial Services Group, Inc. | 0 | -100,00 | 0 | |||||
| 2026-02-17 | 13F | Bank Of America Corp /de/ | 13.696 | 5,05 | 406 | 62,65 | ||||
| 2026-02-13 | 13F | JustInvest LLC | 73.380 | 3,15 | 2.175 | 59,81 | ||||
| 2026-02-05 | 13F | Bessemer Group Inc | 279 | 0 | ||||||
| 2026-02-06 | 13F | Lsv Asset Management | 5.600 | 0,00 | 0 | |||||
| 2026-01-20 | 13F | Signaturefd, Llc | 21.237 | 1,00 | 629 | 56,86 | ||||
| 2026-02-06 | 13F | Larson Financial Group LLC | 192 | 0,00 | 6 | 66,67 | ||||
| 2026-01-29 | 13F | UBS Group AG | 18.368 | 23.754,55 | 544 | 54.300,00 | ||||
| 2026-02-05 | 13F | Allworth Financial LP | 1.546 | 12,60 | 46 | 73,08 | ||||
| 2026-02-06 | 13F | Global Retirement Partners, LLC | 998 | -1,09 | 30 | 52,63 | ||||
| 2026-02-12 | 13F | Renaissance Technologies Llc | 1.125.190 | -1,44 | 33.339 | 52,83 | ||||
| 2026-02-06 | 13F | EverSource Wealth Advisors, LLC | 285 | -25,20 | 8 | 14,29 | ||||
| 2026-02-17 | 13F | Creative Planning | 41.876 | -2,22 | 1.241 | 51,59 | ||||
| 2026-02-10 | 13F | Envestnet Asset Management Inc | 0 | -100,00 | 0 | -100,00 | ||||
| 2025-11-10 | 13F | MAI Capital Management | 0 | -100,00 | 0 | -100,00 | ||||
| 2026-02-17 | 13F | Citadel Advisors Llc | Put | 0 | -100,00 | 0 | ||||
| 2026-01-30 | 13F | Us Bancorp \de\ | 748 | -20,76 | 22 | 22,22 | ||||
| 2026-02-10 | 13F | Goldman Sachs Group Inc | 27.965 | 3,06 | 829 | 59,85 | ||||
| 2026-02-18 | 13F | GWM Advisors LLC | 303 | 0,00 | 9 | 60,00 | ||||
| 2025-09-25 | NP | DFCEX - Emerging Markets Core Equity Portfolio - Institutional Class This fund is a listed as child fund of Dimensional Fund Advisors Lp and if that institution has disclosed ownership in this security, then these positions will not be double counted when calculating total shares and total value | 60.690 | 0,00 | 1.029 | 2,80 | ||||
| 2026-02-11 | 13F | Parallel Advisors, LLC | 6.280 | 2,25 | 186 | 58,97 | ||||
| 2025-09-25 | NP | DFAX - Dimensional World ex U.S. Core Equity 2 ETF | 4.941 | 0,00 | 84 | 2,47 | ||||
| 2026-02-13 | 13F | Morgan Stanley | 1.219 | -27,83 | 36 | 12,50 | ||||
| 2026-02-17 | 13F | Parvin Asset Management, LLC | 22.245 | -12,23 | 659 | 36,16 | ||||
| 2025-11-12 | 13F | Simplex Trading, Llc | 0 | -100,00 | 0 | |||||
| 2026-01-26 | 13F | Private Trust Co Na | 95 | 0,00 | 3 | 100,00 | ||||
| 2026-02-12 | 13F | BlackRock, Inc. | 244.680 | -0,96 | 7.250 | 53,55 | ||||
| 2026-01-15 | 13F | Nisa Investment Advisors, Llc | 433 | 13 | ||||||
| 2026-02-06 | 13F | IFP Advisors, Inc | 15 | 0 | ||||||
| 2025-11-14 | 13F | Citadel Advisors Llc | Call | 0 | -100,00 | 0 | -100,00 | |||
| 2026-02-13 | 13F | Rhumbline Advisers | 21.247 | -42,71 | 630 | -11,27 | ||||
| 2026-02-11 | 13F | Renaissance Group Llc | 36.244 | -29,48 | 1.074 | 9,27 | ||||
| 2026-02-13 | 13F | Parkside Financial Bank & Trust | 11 | 0,00 | 0 | |||||
| 2026-02-17 | 13F | Susquehanna International Group, Llp | Call | 0 | -100,00 | 0 | ||||
| 2026-01-23 | 13F | Assetmark, Inc | 584 | 0,00 | 17 | 54,55 | ||||
| 2025-09-25 | NP | DFEV - Dimensional Emerging Markets Value ETF | 2.109 | 52,38 | 36 | 59,09 | ||||
| 2026-01-16 | 13F | Crewe Advisors LLC | 113 | 0,00 | 3 | 50,00 | ||||
| 2026-02-10 | 13F | Root Financial Partners, LLC | 2 | 0 | ||||||
| 2026-02-12 | 13F | Quadrant Capital Group Llc | 13.132 | 14,73 | 389 | 78,44 | ||||
| 2026-01-26 | 13F | Cwm, Llc | 100 | 0,00 | 0 | |||||
| 2025-09-26 | NP | HAOSX - Harbor Overseas Fund Institutional Class | 5.723 | 0,00 | 97 | 3,19 | ||||
| 2026-02-13 | 13F | SRS Capital Advisors, Inc. | 2.151 | -7,52 | 64 | 43,18 | ||||
| 2026-01-05 | 13F | GAMMA Investing LLC | 3.276 | 14,31 | 97 | 79,63 | ||||
| 2026-02-10 | 13F | Connor, Clark & Lunn Investment Management Ltd. | 8.779 | 260 | ||||||
| 2025-10-08 | 13F/A | New York State Common Retirement Fund | 0 | -100,00 | 0 | -100,00 |
Other Listings
| US:IMOS | 38,61 $ |