Grundlæggende statistik
| Institutionelle aktier (lange) | 6.253.824 - 17,36% (ex 13D/G) - change of 1,69MM shares 37,14% MRQ |
| Institutionel værdi (lang) | $ 59.617 USD ($1000) |
Institutionelt ejerskab og aktionærer
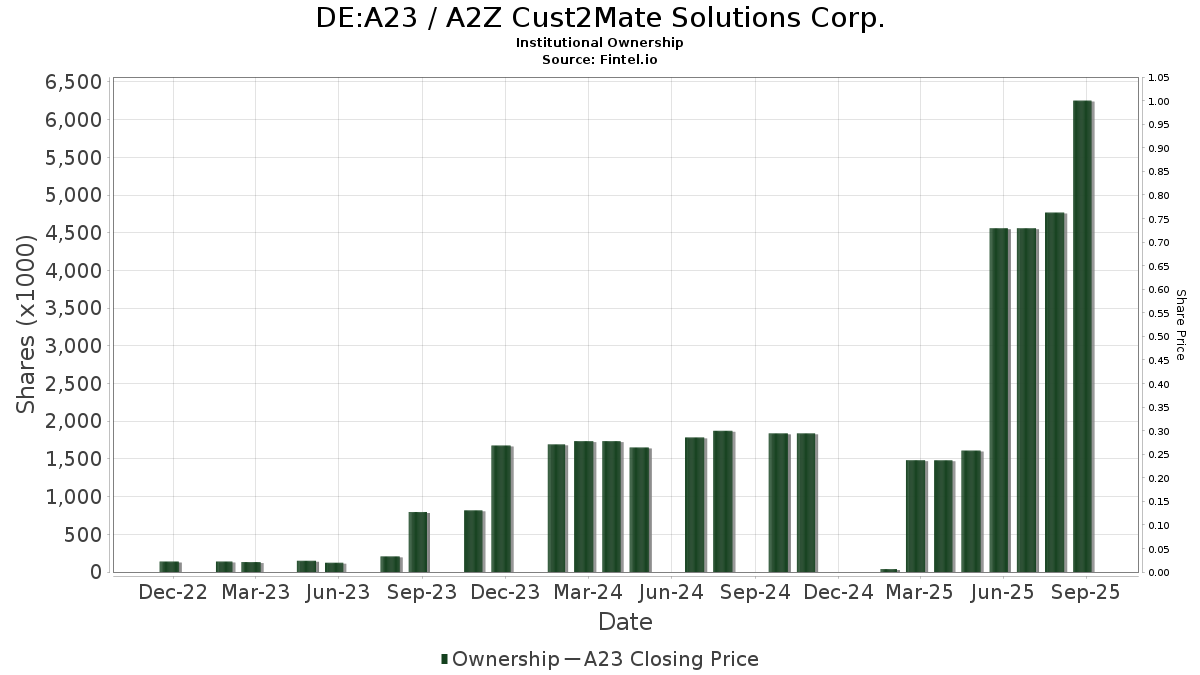
A2Z Cust2Mate Solutions Corp. (DE:A23) har 35 institutionelle ejere og aktionærer, der har indsendt 13D/G- eller 13F-formularer til Securities Exchange Commission (SEC). Disse institutioner har i alt 6,253,824 aktier. Største aktionærer omfatter Philadelphia Financial Management of San Francisco, LLC, Alyeska Investment Group, L.P., Garnet Equity Capital Holdings, Inc., Shay Capital LLC, Clal Insurance Enterprises Holdings Ltd, CIBC Private Wealth Group, LLC, Susquehanna International Group, Llp, Cable Car Capital LLC, Susquehanna International Group, Llp, and Fortitude Advisory Group L.L.C. .
A2Z Cust2Mate Solutions Corp. (DB:A23) institutionel ejerskabsstruktur viser aktuelle positioner i virksomheden efter institutioner og fonde, samt seneste ændringer i positionsstørrelse. Større aktionærer kan omfatte individuelle investorer, investeringsforeninger, hedgefonde eller institutioner. Skema 13D angiver, at investoren besidder (eller besidder) mere end 5 % af virksomheden og har til hensigt (eller har til hensigt at) aktivt at forfølge en ændring i forretningsstrategi. Skema 13G indikerer en passiv investering på over 5%.
Fondens stemningsscore
Fund Sentiment Score (fka Ownership Accumulation Score) finder de aktier, der bliver mest købt af fonde. Det er resultatet af en sofistikeret, multi-faktor kvantitativ model, der identificerer virksomheder med de højeste niveauer af institutionel akkumulering. Scoringsmodellen bruger en kombination af den samlede stigning i oplyste ejere, ændringerne i porteføljeallokeringer i disse ejere og andre målinger. Tallet går fra 0 til 100, hvor højere tal indikerer et højere niveau af akkumulering for sine jævnaldrende, og 50 er gennemsnittet.
Opdateringsfrekvens: Dagligt
Se Ownership Explorer, som giver en liste over højest rangerende virksomheder.
13F og NPORT arkivering
Detaljer om 13F-arkivering er gratis. Detaljer om NP-ansøgninger kræver et premium-medlemskab. Grønne rækker angiver nye positioner. Røde rækker angiver lukkede positioner. Klik på linket ikon for at se den fulde transaktionshistorik.
Opgrader
for at låse premium-data op og eksportere til Excel ![]() .
.
| Fil dato | Kilde | Investor | Type | Gennemsnitlig pris (Øst) |
Aktier | Δ Aktier (%) |
Rapporteret Værdi ($1000) |
Δ Værdi (%) |
Port Alloc (%) |
|
|---|---|---|---|---|---|---|---|---|---|---|
| 2025-08-19 | 13F | Hohimer Wealth Management, Llc | 0 | -100,00 | 0 | |||||
| 2025-07-24 | NP | FNCMX - Fidelity Nasdaq Composite Index Fund This fund is a listed as child fund of Fmr Llc and if that institution has disclosed ownership in this security, then these positions will not be double counted when calculating total shares and total value | 10.012 | 0,00 | 94 | 25,33 | ||||
| 2025-08-14 | 13F | GWM Advisors LLC | 13.980 | 148 | ||||||
| 2025-07-22 | 13F | IMC-Chicago, LLC | 25.013 | 264 | ||||||
| 2025-08-12 | 13F | Proequities, Inc. | 0 | 0 | ||||||
| 2025-08-12 | 13F | BlackRock, Inc. | 530 | 6 | ||||||
| 2025-08-14 | 13F | Susquehanna International Group, Llp | 308.290 | 3.259 | ||||||
| 2025-08-14 | 13F | Susquehanna International Group, Llp | Put | 316.600 | 666,59 | 3.346 | 1.049,83 | |||
| 2025-08-14 | 13F | Susquehanna International Group, Llp | Call | 122.100 | 556,45 | 1.291 | 884,73 | |||
| 2025-08-13 | 13F | Marshall Wace, Llp | 38.976 | 412 | ||||||
| 2025-08-14 | 13F | Royal Bank Of Canada | 4.911 | 1.094,89 | 51 | 1.600,00 | ||||
| 2025-08-12 | 13F | XTX Topco Ltd | 20.706 | 219 | ||||||
| 2025-08-14 | 13F | Bleichroeder LP | 0 | -100,00 | 0 | |||||
| 2025-08-11 | 13F | ARS Investment Partners, LLC | 11.700 | 124 | ||||||
| 2025-08-12 | 13F | CIBC Private Wealth Group, LLC | 322.882 | 20,11 | 3.413 | 87,27 | ||||
| 2025-08-12 | 13F | Clal Insurance Enterprises Holdings Ltd | 546.652 | 0,00 | 6 | 66,67 | ||||
| 2025-09-04 | 13F/A | Advisor Group Holdings, Inc. | 13.822 | 146 | ||||||
| 2025-07-28 | 13F | Curated Wealth Partners LLC | 33.333 | 0,00 | 352 | 49,79 | ||||
| 2025-08-14 | 13F | Point72 Asset Management, L.P. | Call | 50.000 | 0,00 | 528 | 49,58 | |||
| 2025-08-13 | 13F | Renaissance Technologies Llc | 69.900 | 739 | ||||||
| 2025-08-14 | 13F | UBS Group AG | 0 | -100,00 | 0 | |||||
| 2025-08-14 | 13F | Alyeska Investment Group, L.P. | 950.987 | -21,15 | 10.052 | 18,05 | ||||
| 2025-08-15 | 13F | Kestra Advisory Services, LLC | 31.700 | 335 | ||||||
| 2025-08-15 | 13F/A | Cable Car Capital LLC | 312.500 | 0,00 | 3.303 | 49,73 | ||||
| 2025-08-14 | 13F | Jane Street Group, Llc | 26.029 | 275 | ||||||
| 2025-07-30 | 13F | FNY Investment Advisers, LLC | 0 | -100,00 | 0 | |||||
| 2025-08-13 | 13F | Philadelphia Trust Co | 0 | -100,00 | 0 | |||||
| 2025-07-22 | 13F | Fortitude Advisory Group L.L.C. | 301.680 | 151,40 | 3.189 | 251,88 | ||||
| 2025-08-14 | 13F | Jane Street Group, Llc | Put | 30.900 | 327 | |||||
| 2025-08-14 | 13F | IHT Wealth Management, LLC | 181.933 | -0,82 | 1.923 | 48,49 | ||||
| 2025-08-05 | 13F | Simplex Trading, Llc | 64.753 | 990,67 | 1 | |||||
| 2025-08-14 | 13F | Shay Capital LLC | 685.000 | -0,78 | 7.240 | 48,54 | ||||
| 2025-08-15 | 13F | Morgan Stanley | 2.970 | -93,02 | 31 | -89,67 | ||||
| 2025-08-14 | 13F | Mercer Global Advisors Inc /adv | 55.490 | 587 | ||||||
| 2025-08-14 | 13F | Group One Trading, L.p. | 32.166 | 7.764,55 | 340 | 16.850,00 | ||||
| 2025-08-13 | 13F | Corsair Capital Management, L.p. | 0 | -100,00 | 0 | |||||
| 2025-08-14 | 13F | Citadel Advisors Llc | Call | 35.400 | 7,60 | 374 | 61,21 | |||
| 2025-08-14 | 13F | Citadel Advisors Llc | 98.803 | 631,06 | 1.044 | 998,95 | ||||
| 2025-08-14 | 13F | Citadel Advisors Llc | Put | 95.000 | 475,76 | 1.004 | 765,52 | |||
| 2025-08-08 | 13F | Garnet Equity Capital Holdings, Inc. | Call | 51.600 | 545 | |||||
| 2025-05-15 | 13F | Bank Of America Corp /de/ | 0 | -100,00 | 0 | |||||
| 2025-08-18 | 13F/A | National Bank Of Canada /fi/ | 48 | 0,00 | 1 | |||||
| 2025-07-11 | 13F | Weybosset Research & Management Llc | 26.498 | 280 | ||||||
| 2025-08-05 | 13F | Mountain Hill Investment Partners Corp. | 56.219 | 594 | ||||||
| 2025-08-14 | 13F | Philadelphia Financial Management of San Francisco, LLC | 1.024.735 | 222,62 | 10.831 | 383,10 | ||||
| 2025-05-13 | 13F | Quadrature Capital Ltd | 0 | -100,00 | 0 | |||||
| 2025-08-08 | 13F | Garnet Equity Capital Holdings, Inc. | 790.000 | 31,67 | 8.350 | 97,12 | ||||
| 2025-07-18 | 13F | Woodward Diversified Capital, Llc | 0 | -100,00 | 0 | |||||
| 2025-08-08 | 13F | Geode Capital Management, Llc | 21.354 | 113,28 | 226 | 221,43 | ||||
| 2025-08-12 | 13F | Jpmorgan Chase & Co | 2.520 | 0,00 | 27 | 52,94 | ||||
| 2025-08-14 | 13F | Honeycomb Asset Management LP | 167.732 | 1.773 |
Other Listings
| US:AZ | 8,32 $ |