Grundlæggende statistik
| Institutionelle aktier (lange) | 9.707.221 - 67,34% (ex 13D/G) - change of -2,01MM shares -17,21% MRQ |
| Institutionel værdi (lang) | $ 700.653 USD ($1000) |
Institutionelt ejerskab og aktionærer
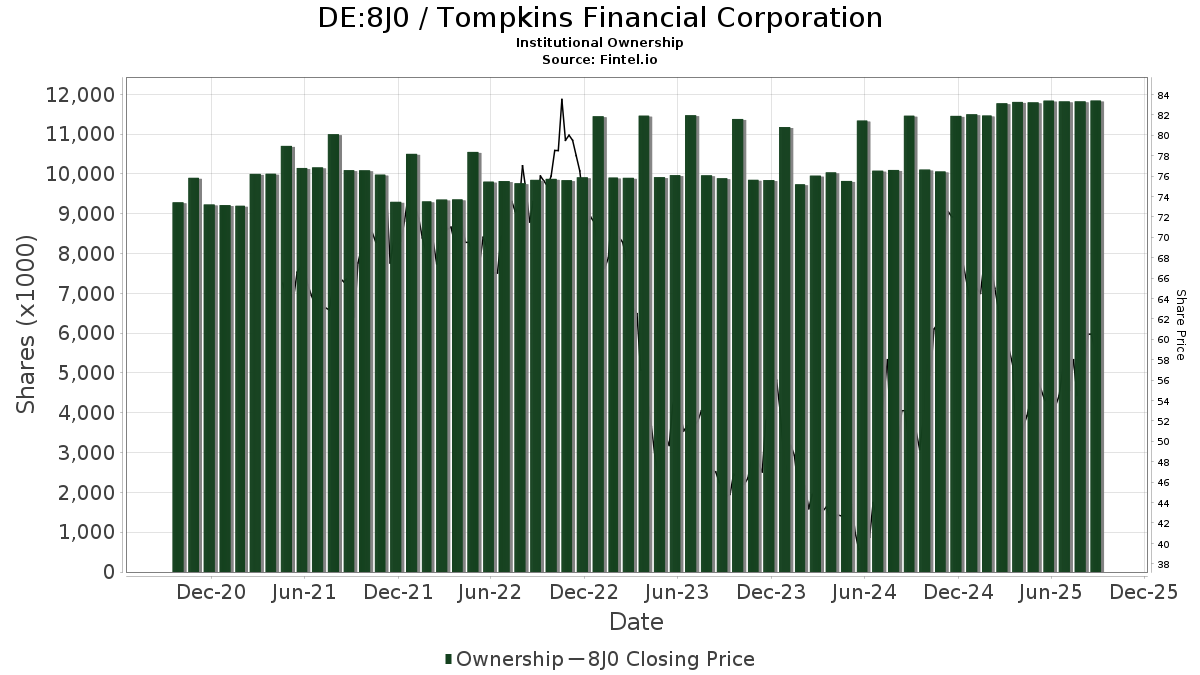
Tompkins Financial Corporation (DE:8J0) har 195 institutionelle ejere og aktionærer, der har indsendt 13D/G- eller 13F-formularer til Securities Exchange Commission (SEC). Disse institutioner har i alt 9,707,221 aktier. Største aktionærer omfatter BlackRock, Inc., Vanguard Group Inc, State Street Corp, Tompkins Financial Corp, Dimensional Fund Advisors Lp, Geode Capital Management, Llc, American Century Companies Inc, Morgan Stanley, Northern Trust Corp, and Cornell Pochily Investment Advisors, Inc. .
Tompkins Financial Corporation (DB:8J0) institutionel ejerskabsstruktur viser aktuelle positioner i virksomheden efter institutioner og fonde, samt seneste ændringer i positionsstørrelse. Større aktionærer kan omfatte individuelle investorer, investeringsforeninger, hedgefonde eller institutioner. Skema 13D angiver, at investoren besidder (eller besidder) mere end 5 % af virksomheden og har til hensigt (eller har til hensigt at) aktivt at forfølge en ændring i forretningsstrategi. Skema 13G indikerer en passiv investering på over 5%.
The share price as of April 13, 2026 is 72,50 / share. Previously, on April 15, 2025, the share price was 49,60 / share. This represents an increase of 46,17% over that period.
Fondens stemningsscore
Fund Sentiment Score (fka Ownership Accumulation Score) finder de aktier, der bliver mest købt af fonde. Det er resultatet af en sofistikeret, multi-faktor kvantitativ model, der identificerer virksomheder med de højeste niveauer af institutionel akkumulering. Scoringsmodellen bruger en kombination af den samlede stigning i oplyste ejere, ændringerne i porteføljeallokeringer i disse ejere og andre målinger. Tallet går fra 0 til 100, hvor højere tal indikerer et højere niveau af akkumulering for sine jævnaldrende, og 50 er gennemsnittet.
Opdateringsfrekvens: Dagligt
Se Ownership Explorer, som giver en liste over højest rangerende virksomheder.
AI+ Ask Fintel’s AI assistant about Tompkins Financial Corporation.
Select a question to share a public post with an AI-crafted answer.
Thinking of good questions…
13F og NPORT arkivering
Detaljer om 13F-arkivering er gratis. Detaljer om NP-ansøgninger kræver et premium-medlemskab. Grønne rækker angiver nye positioner. Røde rækker angiver lukkede positioner. Klik på linket ikon for at se den fulde transaktionshistorik.
Opgrader
for at låse premium-data op og eksportere til Excel ![]() .
.
| Fil dato | Kilde | Investor | Type | Gennemsnitlig pris (Øst) |
Aktier | Δ Aktier (%) |
Rapporteret Værdi ($1000) |
Δ Værdi (%) |
Port Alloc (%) |
|
|---|---|---|---|---|---|---|---|---|---|---|
| 2026-01-23 | 13F | Private Wealth Management Group, LLC | 56 | 0,00 | 4 | 33,33 | ||||
| 2026-02-11 | 13F | Illinois Municipal Retirement Fund | 6.471 | -3,89 | 469 | 5,39 | ||||
| 2026-02-17 | 13F | Aquatic Capital Management LLC | 53 | -97,31 | 4 | -97,69 | ||||
| 2026-02-12 | 13F | Commonwealth Equity Services, Llc | 5.810 | -16,49 | 421 | |||||
| 2026-02-11 | 13F | Franklin Resources Inc | 10.366 | -0,95 | 752 | 8,53 | ||||
| 2026-01-30 | 13F | State of New Jersey Common Pension Fund D | 33.131 | 3,75 | 2.403 | 13,62 | ||||
| 2026-01-12 | 13F | Burns J W & Co Inc/ny | 3.455 | 0,64 | 251 | 10,13 | ||||
| 2026-02-17 | 13F | Bank Of America Corp /de/ | 47.366 | -2,98 | 3.435 | 6,25 | ||||
| 2026-02-10 | 13F | Goldman Sachs Group Inc | 102.891 | 43,46 | 7.462 | 57,14 | ||||
| 2026-02-13 | 13F | Morgan Stanley | 164.789 | 2,21 | 11.951 | 11,94 | ||||
| 2026-02-17 | 13F | Fmr Llc | 2.117 | 5,38 | 154 | 15,04 | ||||
| 2026-02-17 | 13F | Susquehanna Fundamental Investments, Llc | 5.311 | -12,19 | 385 | -3,75 | ||||
| 2026-02-17 | 13F | Raymond James Financial Inc | 4.444 | 12,36 | 322 | 23,37 | ||||
| 2026-02-17 | 13F | Russell Investments Group, Ltd. | 3.041 | -12,84 | 221 | -4,76 | ||||
| 2026-04-08 | 13F | Cardinal Capital Management | 24.516 | 4,68 | 1.933 | 13,78 | ||||
| 2026-02-03 | 13F | Farmers & Merchants Investments Inc | 8 | 0,00 | 1 | |||||
| 2026-01-30 | 13F | Turning Point Benefit Group, Inc. | 2 | 0,00 | 0 | |||||
| 2026-02-06 | 13F | Gsa Capital Partners Llp | 0 | -100,00 | 0 | |||||
| 2026-01-30 | 13F | W.G. Shaheen & Associates DBA Whitney & Co | 5.630 | -1,75 | 408 | 7,65 | ||||
| 2026-02-10 | 13F | Hazlett, Burt & Watson, Inc. | 797 | 0,00 | 0 | |||||
| 2026-02-12 | 13F | Voya Investment Management Llc | 0 | -100,00 | 0 | |||||
| 2026-02-17 | 13F | Advisor Group Holdings, Inc. | 57 | 137,50 | 4 | 300,00 | ||||
| 2026-02-17 | 13F | Tower Research Capital LLC (TRC) | 250 | -46,47 | 18 | -40,00 | ||||
| 2026-02-17 | 13F | Aqr Capital Management Llc | 68.928 | 62,29 | 4.999 | 77,74 | ||||
| 2026-02-13 | 13F | Manufacturers Life Insurance Company, The | 0 | -100,00 | 0 | |||||
| 2026-04-13 | 13F | IFP Advisors, Inc | 1.193 | 0,00 | 94 | 9,30 | ||||
| 2026-02-04 | 13F | Bailard, Inc. | 12.300 | 6,03 | 892 | 16,02 | ||||
| 2026-01-15 | 13F | Nisa Investment Advisors, Llc | 366 | 4,57 | 27 | 13,04 | ||||
| 2026-02-05 | 13F | John G Ullman & Associates Inc | 83.343 | -1,77 | 6.044 | 7,60 | ||||
| 2026-02-09 | 13F | Geode Capital Management, Llc | 316.607 | 1,50 | 22.962 | 11,17 | ||||
| 2026-02-11 | 13F | Simplex Trading, Llc | Put | 100 | 7 | |||||
| 2026-02-11 | 13F | Simplex Trading, Llc | Call | 1.100 | -31,25 | 80 | ||||
| 2026-02-10 | 13F | Intech Investment Management Llc | 24.656 | 269,99 | 1.788 | 305,44 | ||||
| 2026-01-16 | 13F | Louisiana State Employees Retirement System | 5.800 | 0,00 | 421 | 9,38 | ||||
| 2026-02-12 | 13F | Renaissance Technologies Llc | 0 | -100,00 | 0 | -100,00 | ||||
| 2026-02-14 | 13F | Rockefeller Capital Management L.P. | 20 | -23,08 | 1 | 0,00 | ||||
| 2026-01-30 | 13F | Heritage Investment Group, Inc. | 3.629 | 0,00 | 263 | 9,58 | ||||
| 2026-02-04 | 13F | Community Bank, N.A. | 3.500 | 0,00 | 254 | 9,52 | ||||
| 2026-02-11 | 13F | Deutsche Bank Ag\ | 13.891 | 14,82 | 1.007 | 25,72 | ||||
| 2026-02-17 | 13F | Susquehanna International Group, Llp | 0 | -100,00 | 0 | |||||
| 2026-02-06 | 13F | ProShare Advisors LLC | 85.209 | -6,83 | 6.179 | 2,06 | ||||
| 2026-02-17 | 13F | Mercer Global Advisors Inc /adv | 6.888 | 14,97 | 500 | 26,01 | ||||
| 2026-02-13 | 13F | Quarry LP | 0 | -100,00 | 0 | -100,00 | ||||
| 2026-01-23 | 13F | Assetmark, Inc | 2 | 0 | ||||||
| 2026-04-13 | 13F | Wedge Capital Management L L P/nc | 28.334 | 2.234 | ||||||
| 2026-02-10 | 13F | Semanteon Capital Management, LP | 0 | -100,00 | 0 | |||||
| 2026-02-17 | 13F | Citadel Advisors Llc | 30.737 | 551,62 | 2.229 | 614,42 | ||||
| 2026-02-17 | 13F | Citadel Advisors Llc | Put | 3.300 | 239 | |||||
| 2025-11-14 | 13F | Larson Financial Group LLC | 0 | -100,00 | 0 | |||||
| 2026-02-17 | 13F | Gallagher Fiduciary Advisors, LLC | 8.225 | 7,56 | 596 | 17,79 | ||||
| 2026-02-05 | 13F | Atria Investments Llc | 8.191 | 8,48 | 594 | 19,04 | ||||
| 2026-01-26 | 13F | Cwm, Llc | 4.100 | 45,80 | 0 | |||||
| 2026-01-28 | 13F | Universal- Beteiligungs- und Servicegesellschaft mbH | 4.245 | 17,04 | 308 | 27,92 | ||||
| 2026-02-10 | 13F | Connor, Clark & Lunn Investment Management Ltd. | 9.433 | -9,85 | 684 | -1,16 | ||||
| 2026-02-13 | 13F | JustInvest LLC | 3.163 | -1,28 | 229 | 8,02 | ||||
| 2026-02-11 | 13F | Winton Capital Group Ltd | 19.263 | 1,08 | 1.397 | 10,71 | ||||
| 2026-02-12 | 13F | CIBC Private Wealth Group, LLC | 3 | 0 | ||||||
| 2026-02-13 | 13F | Umb Bank N A/mo | 30 | 0,00 | 2 | 100,00 | ||||
| 2026-01-27 | 13F | Sterling Investment Counsel, LLC | 9.280 | -9,73 | 673 | -1,18 | ||||
| 2026-02-06 | 13F | Lsv Asset Management | 36.400 | 0,00 | 3 | 0,00 | ||||
| 2025-11-12 | 13F | Cobblestone Capital Advisors Llc /ny/ | 5.770 | 0,00 | 382 | 5,82 | ||||
| 2026-02-11 | 13F | Jpmorgan Chase & Co | 58.217 | 1,15 | 4.222 | 10,79 | ||||
| 2026-01-23 | 13F | Nbt Bank N A /ny | 95 | 0,00 | 7 | 0,00 | ||||
| 2026-01-29 | 13F | Teachers Retirement System Of The State Of Kentucky | 3.163 | -11,00 | 0 | |||||
| 2026-02-11 | 13F | Cedar Mountain Advisors, LLC | 2 | 0 | ||||||
| 2026-02-17 | 13F | Hotchkis & Wiley Capital Management Llc | 118.599 | -0,12 | 8.601 | 9,40 | ||||
| 2026-02-12 | 13F | Wealthspire Advisors, LLC | 0 | -100,00 | 0 | |||||
| 2026-02-09 | 13F | Quest Partners LLC | 637 | -84,29 | 46 | -82,84 | ||||
| 2026-02-17 | 13F | Captrust Financial Advisors | 8.796 | 638 | ||||||
| 2026-04-10 | 13F | Waldron Private Wealth LLC | 8.841 | -17,88 | 697 | -10,64 | ||||
| 2026-02-17 | 13F | Two Sigma Investments, Lp | 9.478 | -19,40 | 687 | -11,70 | ||||
| 2026-02-17 | 13F | Occudo Quantitative Strategies Lp | 5.030 | 0,64 | 365 | 10,30 | ||||
| 2026-02-13 | 13F | Ieq Capital, Llc | 8.995 | 66,60 | 652 | 82,63 | ||||
| 2026-02-13 | 13F | Kestra Advisory Services, LLC | 1.623 | 118 | ||||||
| 2026-04-07 | 13F | Signaturefd, Llc | 188 | 0,00 | 15 | 7,69 | ||||
| 2026-02-02 | 13F | Principal Financial Group Inc | 60.561 | -1,34 | 4.392 | 8,05 | ||||
| 2026-02-10 | 13F | Bank of New York Mellon Corp | 122.122 | -5,44 | 8.856 | 3,58 | ||||
| 2026-01-23 | 13F | Valley National Advisers Inc | 234 | 0,00 | 0 | |||||
| 2026-02-13 | 13F | State Street Corp | 1.189.406 | -2,05 | 86.256 | 7,29 | ||||
| 2026-02-27 | 13F | Compass Financial Services Inc | 58 | 0,00 | 4 | 33,33 | ||||
| 2026-04-13 | 13F | True Wealth Design, LLC | 33 | 0,00 | 3 | 0,00 | ||||
| 2026-02-17 | 13F | California State Teachers Retirement System | 11.369 | -0,08 | 824 | 9,43 | ||||
| 2026-01-28 | 13F | Salomon & Ludwin, LLC | 58 | -53,97 | 4 | -50,00 | ||||
| 2026-02-13 | 13F | Jacobs Levy Equity Management, Inc | 21.513 | -30,99 | 1.560 | -24,42 | ||||
| 2026-02-11 | 13F | Janney Montgomery Scott LLC | 2.940 | 0 | ||||||
| 2026-02-11 | 13F | Cerity Partners LLC | 5.126 | 372 | ||||||
| 2025-11-14 | 13F | Warren Averett Asset Management, LLC | 0 | -100,00 | 0 | |||||
| 2026-01-21 | 13F | SJS Investment Consulting Inc. | 21 | 2 | ||||||
| 2026-01-30 | 13F | New York State Teachers Retirement System | 18.877 | -6,05 | 1 | 0,00 | ||||
| 2026-02-13 | 13F | MAI Capital Management | 7 | 1 | ||||||
| 2026-02-10 | 13F | Commonwealth Of Pennsylvania Public School Empls Retrmt Sys | 3.144 | -2,78 | 228 | 6,54 | ||||
| 2026-02-10 | 13F | Eurizon Capital SGR S.p.A. | 2.355 | 171 | ||||||
| 2026-02-13 | 13F | Citigroup Inc | 8.529 | -11,17 | 619 | -2,68 | ||||
| 2026-04-09 | 13F | Tompkins Financial Corp | 1.119.343 | -1,47 | 88.249 | 7,12 | ||||
| 2026-02-12 | 13F | MetLife Investment Management, LLC | 7.741 | 0,00 | 561 | 9,57 | ||||
| 2026-04-15 | 13F | Exchange Traded Concepts, Llc | 17.861 | 1.408 | ||||||
| 2026-01-29 | 13F | Comerica Bank | 2.745 | -21,32 | 199 | -13,85 | ||||
| 2025-11-14 | 13F | Squarepoint Ops LLC | 0 | -100,00 | 0 | -100,00 | ||||
| 2026-02-17 | 13F | Ameriprise Financial Inc | 42.013 | -14,90 | 3.047 | -6,79 | ||||
| 2026-02-13 | 13F | Verition Fund Management LLC | 0 | -100,00 | 0 | |||||
| 2026-02-13 | 13F | Colony Group, LLC | 9.571 | -46,45 | 694 | -39,60 | ||||
| 2026-04-06 | 13F | GAMMA Investing LLC | 1.235 | 6,19 | 97 | 15,48 | ||||
| 2026-02-12 | 13F | BlackRock, Inc. | 2.014.921 | 1,73 | 146.122 | 11,42 | ||||
| 2026-02-18 | 13F | State of Tennessee, Treasury Department | 11.547 | -16,86 | 925 | 0,65 | ||||
| 2026-02-05 | 13F | Thrivent Financial For Lutherans | 18.992 | 37,81 | 1 | |||||
| 2026-02-17 | 13F | Two Sigma Advisers, Lp | 11.800 | 0,85 | 856 | 10,47 | ||||
| 2026-02-13 | 13F | SRS Capital Advisors, Inc. | 25 | -97,54 | 2 | -98,51 | ||||
| 2026-02-17 | 13F | Price T Rowe Associates Inc /md/ | 18.973 | 2,78 | 1 | 0,00 | ||||
| 2026-02-11 | 13F | Parallel Advisors, LLC | 34 | 36,00 | 2 | 100,00 | ||||
| 2026-02-17 | 13F | Janus Henderson Group Plc | 6.309 | 0,00 | 457 | 9,35 | ||||
| 2026-02-03 | 13F | SBI Securities Co., Ltd. | 1 | 0,00 | 0 | |||||
| 2026-02-10 | 13F | Bnp Paribas Arbitrage, Sa | 5.357 | -13,25 | 388 | -4,90 | ||||
| 2026-02-13 | 13F | Great West Life Assurance Co /can/ | 12.558 | 0,15 | 1 | |||||
| 2026-01-15 | 13F | Fortitude Family Office, LLC | 17 | 0,00 | 1 | 0,00 | ||||
| 2026-02-02 | 13F | Horizon Investments, LLC | 8.479 | 4,68 | 615 | 14,55 | ||||
| 2026-02-13 | 13F | Bard Associates Inc | 300 | 22 | ||||||
| 2026-02-11 | 13F | LPL Financial LLC | 41.854 | 4,49 | 3.035 | 14,49 | ||||
| 2026-02-13 | 13F | Wells Fargo & Company/mn | 17.471 | 38,85 | 1.267 | 51,98 | ||||
| 2026-02-05 | 13F | Bessemer Group Inc | 309 | 13,19 | 0 | |||||
| 2026-01-20 | 13F | Cornell Pochily Investment Advisors, Inc. | 122.961 | -0,38 | 8.917 | 9,12 | ||||
| 2026-02-10 | 13F/A | Northwestern Mutual Wealth Management Co | 232 | 0,87 | 17 | 6,67 | ||||
| 2026-04-03 | 13F | Rise Advisors, LLC | 11.630 | -11,42 | 920 | -3,47 | ||||
| 2026-02-13 | 13F | Smartleaf Asset Management LLC | 93 | 0,00 | 7 | 0,00 | ||||
| 2025-10-29 | 13F | Maryland State Retirement & Pension System | 0 | -100,00 | 0 | |||||
| 2026-02-04 | 13F | Oregon Public Employees Retirement Fund | 2.904 | 2,07 | 211 | 11,70 | ||||
| 2026-02-17 | 13F | Jones Financial Companies Lllp | 20 | -56,52 | 1 | -66,67 | ||||
| 2026-02-10 | 13F | Hillsdale Investment Management Inc. | 0 | -100,00 | 0 | -100,00 | ||||
| 2026-04-07 | 13F | Eastern Bank | 1.168 | 0,00 | 92 | 9,52 | ||||
| 2026-02-09 | 13F | Huntington National Bank | 46 | 0,00 | 3 | 0,00 | ||||
| 2026-02-13 | 13F | Parkside Financial Bank & Trust | 48 | 380,00 | 3 | |||||
| 2026-02-13 | 13F | Martingale Asset Management L P | 4.605 | 334 | ||||||
| 2026-01-28 | 13F | Arizona State Retirement System | 3.435 | -5,37 | 249 | 3,75 | ||||
| 2026-02-13 | 13F | Sei Investments Co | 5.846 | 0,00 | 424 | 9,56 | ||||
| 2026-02-17 | 13F | Northern Trust Corp | 132.683 | -5,38 | 9.622 | 3,64 | ||||
| 2026-04-07 | 13F | Farther Finance Advisors, LLC | 67 | 4,69 | 5 | 25,00 | ||||
| 2026-01-20 | 13F | Tritonpoint Wealth, Llc | 4.736 | 0,00 | 343 | 9,58 | ||||
| 2026-02-13 | 13F | Police & Firemen's Retirement System of New Jersey | 3.732 | 0,00 | 271 | 9,31 | ||||
| 2026-02-17 | 13F | Quantinno Capital Management LP | 16.078 | 14,43 | 1.166 | 25,27 | ||||
| 2026-04-08 | 13F | Wealth Enhancement Advisory Services, Llc | 26.475 | -15,68 | 2.128 | -7,20 | ||||
| 2026-02-20 | 13F | Sunbelt Securities, Inc. | 0 | -100,00 | 0 | |||||
| 2026-02-17 | 13F | D. E. Shaw & Co., Inc. | 16.256 | -22,99 | 1.179 | -15,68 | ||||
| 2026-04-10 | 13F | Abound Wealth Management | 0 | -100,00 | 0 | |||||
| 2026-02-12 | 13F | Dimensional Fund Advisors Lp | 595.174 | -0,72 | 43.162 | 8,75 | ||||
| 2026-04-07 | 13F | CoreCap Advisors, LLC | 6 | 20,00 | 0 | |||||
| 2025-10-30 | 13F | Twin Peaks Wealth Advisors, LLC | 0 | -100,00 | 0 | |||||
| 2026-02-13 | 13F | Rhumbline Advisers | 36.521 | -4,46 | 2.648 | 4,66 | ||||
| 2026-04-06 | 13F | Versant Capital Management, Inc | 634 | 0,00 | 50 | 8,89 | ||||
| 2026-02-06 | 13F | Global Retirement Partners, LLC | 1.017 | 0,30 | 74 | 8,96 | ||||
| 2026-01-29 | 13F | UMA Financial Services, Inc. | 28 | 33,33 | 2 | 100,00 | ||||
| 2026-02-13 | 13F | Pinnacle Wealth Planning Services, Inc. | 295 | 21 | ||||||
| 2026-02-11 | 13F | Gilpin Wealth Management, Llc | 1 | 0 | ||||||
| 2026-02-06 | 13F | Covestor Ltd | 18 | -25,00 | 0 | |||||
| 2026-02-17 | 13F | Royal Bank Of Canada | 12.233 | -1,55 | 888 | 8,03 | ||||
| 2026-02-12 | 13F | Hrt Financial Lp | 0 | -100,00 | 0 | |||||
| 2026-02-17 | 13F | Alliancebernstein L.p. | 22.020 | 23,92 | 1.597 | 35,71 | ||||
| 2026-02-09 | 13F | Hantz Financial Services, Inc. | 81 | 84,09 | 0 | |||||
| 2026-02-09 | 13F | Legal & General Group Plc | 31.501 | -2,69 | 2.284 | 6,58 | ||||
| 2026-02-10 | 13F | Savant Capital, LLC | 0 | -100,00 | 0 | |||||
| 2025-10-27 | 13F | Belvedere Trading LLC | Put | 0 | -100,00 | 0 | ||||
| 2026-02-05 | 13F | Allworth Financial LP | 2.575 | -1,08 | 187 | 8,14 | ||||
| 2025-10-27 | 13F | Belvedere Trading LLC | Call | 0 | -100,00 | 0 | ||||
| 2026-01-28 | 13F | Klp Kapitalforvaltning As | 2.600 | 8,33 | 189 | 18,99 | ||||
| 2026-02-10 | 13F | Rothschild Investment Llc | 60 | 93,55 | 4 | 100,00 | ||||
| 2026-02-13 | 13F | BNP Paribas Asset Management Holding S.A. | 131 | 48,86 | 0 | |||||
| 2026-02-12 | 13F | Quadrant Capital Group Llc | 196 | -20,97 | 14 | -12,50 | ||||
| 2026-02-12 | 13F | New York State Common Retirement Fund | 5.417 | 0,00 | 393 | 9,50 | ||||
| 2026-02-13 | 13F | American Century Companies Inc | 236.232 | 29,75 | 17.132 | 42,12 | ||||
| 2026-02-12 | 13F | Nuveen, LLC | 30.339 | 0,00 | 2.200 | 9,56 | ||||
| 2026-01-28 | 13F | Chicago Partners Investment Group LLC | 11.564 | 1,10 | 872 | 16,13 | ||||
| 2026-02-03 | 13F | Broadwater Capital Management Llc | 200 | 0,00 | 15 | 7,69 | ||||
| 2026-02-17 | 13F | Man Group plc | 18.163 | -44,23 | 1.317 | -38,91 | ||||
| 2026-02-09 | 13F | Hartland & Co., LLC | 2 | 0,00 | 0 | |||||
| 2026-02-19 | 13F | Invesco Ltd. | 82.494 | -9,36 | 5.982 | -0,71 | ||||
| 2026-01-30 | 13F | Us Bancorp \de\ | 1.133 | 0,53 | 82 | 10,81 | ||||
| 2026-02-17 | 13F | Engineers Gate Manager LP | 0 | -100,00 | 0 | |||||
| 2026-01-28 | 13F | Teacher Retirement System Of Texas | 16.724 | -0,85 | 1.213 | 8,60 | ||||
| 2026-02-13 | 13F | Ubs Asset Management Americas Inc | 25.049 | 27,35 | 1.817 | 39,48 | ||||
| 2026-02-13 | 13F | Sterling Capital Management LLC | 777 | -16,81 | 56 | -8,20 | ||||
| 2026-01-21 | 13F | Yousif Capital Management, Llc | 3.416 | -13,56 | 256 | -1,92 | ||||
| 2026-02-12 | 13F | Logan Capital Management Inc | 23.439 | 0,00 | 1.700 | 9,54 | ||||
| 2026-02-09 | 13F | Strategic Financial Services, Inc, | 5.095 | 0,00 | 430 | 27,30 | ||||
| 2026-02-13 | 13F | Public Sector Pension Investment Board | 0 | -100,00 | 0 | |||||
| 2026-01-30 | 13F | Keybank National Association/oh | 0 | -100,00 | 0 | |||||
| 2026-03-06 | 13F | Hsbc Holdings Plc | 7.626 | 59,17 | 551 | 75,16 | ||||
| 2026-02-12 | 13F | EntryPoint Capital, LLC | 4.642 | 0,00 | 337 | 9,45 | ||||
| 2026-02-17 | 13F | EJF Capital LLC | 25.000 | 1.813 | ||||||
| 2026-01-27 | 13F | Zurcher Kantonalbank (Zurich Cantonalbank) | 1.673 | 0,00 | 121 | 10,00 | ||||
| 2026-02-17 | 13F | Polymer Capital Management (US) LLC | 5.032 | -7,00 | 365 | 1,68 | ||||
| 2026-01-12 | 13F | Rialto Wealth Management, LLC | 200 | 0,00 | 15 | 7,69 | ||||
| 2026-02-23 | 13F | Virtu Financial LLC | 0 | -100,00 | 0 | |||||
| 2026-02-13 | 13F | Rafferty Asset Management, LLC | 6.218 | -20,46 | 451 | -12,96 | ||||
| 2026-02-17 | 13F | ExodusPoint Capital Management, LP | 0 | -100,00 | 0 | -100,00 | ||||
| 2025-11-14 | 13F | Wellington Management Group Llp | 0 | -100,00 | 0 | |||||
| 2026-02-12 | 13F | Jane Street Group, Llc | 0 | -100,00 | 0 | |||||
| 2026-02-11 | 13F | Ameritas Investment Partners, Inc. | 1.127 | 82 | ||||||
| 2026-02-17 | 13F | rhino investment partners, Inc | 88.550 | 6.422 | ||||||
| 2026-02-13 | 13F | Charles Schwab Investment Management Inc | 122.352 | -0,63 | 8.873 | 8,85 | ||||
| 2026-02-17 | 13F | Public Employees Retirement System Of Ohio | 2.598 | -31,60 | 188 | -25,10 | ||||
| 2026-02-06 | 13F | Bare Financial Services, Inc | 11 | -56,00 | 1 | -100,00 | ||||
| 2026-02-13 | 13F | Mariner, LLC | 6.042 | 99,47 | 438 | 119,00 | ||||
| 2025-11-13 | 13F | Dynamic Technology Lab Private Ltd | 0 | -100,00 | 0 | |||||
| 2026-02-17 | 13F | Creative Planning | 17.775 | 41,41 | 1.289 | 54,93 | ||||
| 2026-01-29 | 13F | Vanguard Group Inc | 1.385.961 | 1,11 | 100.510 | 10,75 | ||||
| 2026-02-17 | 13F | Canada Pension Plan Investment Board | 9.300 | 674 | ||||||
| 2026-02-17 | 13F | MIRAE ASSET GLOBAL ETFS HOLDINGS Ltd. | 6.296 | 0,49 | 457 | 10,14 | ||||
| 2025-11-14 | 13F | Texas Permanent School Fund | 0 | -100,00 | 0 | |||||
| 2026-01-09 | 13F | SG Americas Securities, LLC | 27.168 | 104,52 | 2 | |||||
| 2026-02-10 | 13F | ESL Trust Services, LLC | 2.461 | 0,00 | 178 | 9,88 | ||||
| 2026-02-11 | 13F | Los Angeles Capital Management Llc | 39 | 3 | ||||||
| 2026-02-06 | 13F | EverSource Wealth Advisors, LLC | 566 | 2,72 | 41 | 13,89 | ||||
| 2026-02-17 | 13F | Qube Research & Technologies Ltd | 3.954 | -67,28 | 287 | -64,25 | ||||
| 2025-11-14 | 13F | United Capital Financial Advisers, Llc | 0 | -100,00 | 0 | -100,00 | ||||
| 2026-02-10 | 13F | Quantbot Technologies LP | 0 | -100,00 | 0 | |||||
| 2026-02-06 | 13F | Pnc Financial Services Group, Inc. | 1.410 | -0,63 | 102 | 9,68 | ||||
| 2026-02-17 | 13F | Adage Capital Partners Gp, L.l.c. | 60.000 | 4.351 | ||||||
| 2026-04-13 | 13F | Massmutual Trust Co Fsb/adv | 445 | 1,83 | 35 | 12,90 | ||||
| 2026-02-27 | 13F | Cross Staff Investments Inc | 2.840 | 206 | ||||||
| 2026-02-02 | 13F | Fifth Third Bancorp | 26 | 23,81 | 2 | 0,00 | ||||
| 2025-11-12 | 13F | Simplex Trading, Llc | 0 | -100,00 | 0 | |||||
| 2026-02-13 | 13F | Arrowstreet Capital, Limited Partnership | 7.045 | 511 | ||||||
| 2026-01-14 | 13F | LVW Advisors, LLC | 3.781 | 0,00 | 274 | 9,60 | ||||
| 2025-11-14 | 13F | Skopos Labs, Inc. | 0 | -100,00 | 0 | |||||
| 2026-02-12 | 13F | Swiss National Bank | 24.200 | 1,68 | 1.755 | 11,37 | ||||
| 2026-02-13 | 13F | Barclays Plc | 23.742 | 11,29 | 1.722 | 21,88 | ||||
| 2026-02-13 | 13F | Prudential Financial Inc | 11.785 | -6,49 | 855 | 2,40 | ||||
| 2026-02-17 | 13F | Aster Capital Management (DIFC) Ltd | 0 | -100,00 | 0 | |||||
| 2026-01-14 | 13F | Bourne Lent Asset Management Inc | 4.684 | -2,60 | 340 | 6,60 | ||||
| 2026-01-23 | 13F | State of Alaska, Department of Revenue | 7.048 | 1,08 | 1 | |||||
| 2026-01-29 | 13F | UBS Group AG | 43.217 | -11,01 | 3.134 | -2,52 | ||||
| 2026-04-13 | 13F | Creative Financial Designs Inc /adv | 87 | 0,00 | 7 | 0,00 | ||||
| 2026-02-17 | 13F | Millennium Management Llc | 16.863 | 1,10 | 1.223 | 10,69 | ||||
| 2026-02-05 | 13F | Amalgamated Bank | 3.767 | 1,78 | 0 |
Other Listings
| US:TMP | 84,32 $ |