Grundlæggende statistik
| Institutionelle aktier (lange) | 7.081.221 - 6,77% (ex 13D/G) - change of 2,94MM shares 70,91% MRQ |
| Institutionel værdi (lang) | $ 10.226 USD ($1000) |
Institutionelt ejerskab og aktionærer
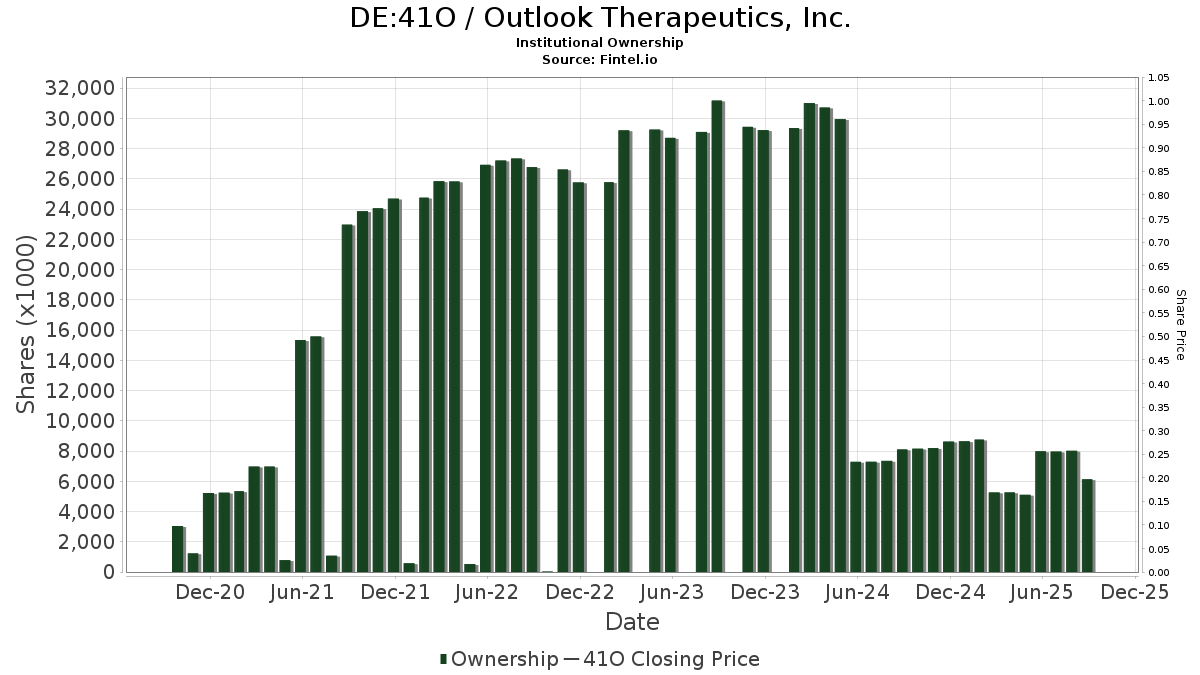
Outlook Therapeutics, Inc. (DE:41O) har 60 institutionelle ejere og aktionærer, der har indsendt 13D/G- eller 13F-formularer til Securities Exchange Commission (SEC). Disse institutioner har i alt 7,081,221 aktier. Største aktionærer omfatter Schonfeld Strategic Advisors LLC, Vanguard Group Inc, Sio Capital Management, LLC, Citadel Advisors Llc, Gilpin Wealth Management, Llc, BlackRock, Inc., Susquehanna International Group, Llp, Geode Capital Management, Llc, Marshall Wace, Llp, and UBS Group AG .
Outlook Therapeutics, Inc. (DB:41O) institutionel ejerskabsstruktur viser aktuelle positioner i virksomheden efter institutioner og fonde, samt seneste ændringer i positionsstørrelse. Større aktionærer kan omfatte individuelle investorer, investeringsforeninger, hedgefonde eller institutioner. Skema 13D angiver, at investoren besidder (eller besidder) mere end 5 % af virksomheden og har til hensigt (eller har til hensigt at) aktivt at forfølge en ændring i forretningsstrategi. Skema 13G indikerer en passiv investering på over 5%.
The share price as of April 24, 2026 is 0,24 / share. Previously, on April 28, 2025, the share price was 1,32 / share. This represents a decline of 81,88% over that period.
Fondens stemningsscore
Fund Sentiment Score (fka Ownership Accumulation Score) finder de aktier, der bliver mest købt af fonde. Det er resultatet af en sofistikeret, multi-faktor kvantitativ model, der identificerer virksomheder med de højeste niveauer af institutionel akkumulering. Scoringsmodellen bruger en kombination af den samlede stigning i oplyste ejere, ændringerne i porteføljeallokeringer i disse ejere og andre målinger. Tallet går fra 0 til 100, hvor højere tal indikerer et højere niveau af akkumulering for sine jævnaldrende, og 50 er gennemsnittet.
Opdateringsfrekvens: Dagligt
Se Ownership Explorer, som giver en liste over højest rangerende virksomheder.
AI+ Ask Fintel’s AI assistant about Outlook Therapeutics, Inc..
Select a question to share a public post with an AI-crafted answer.
Thinking of good questions…
13F og NPORT arkivering
Detaljer om 13F-arkivering er gratis. Detaljer om NP-ansøgninger kræver et premium-medlemskab. Grønne rækker angiver nye positioner. Røde rækker angiver lukkede positioner. Klik på linket ikon for at se den fulde transaktionshistorik.
Opgrader
for at låse premium-data op og eksportere til Excel ![]() .
.
| Fil dato | Kilde | Investor | Type | Gennemsnitlig pris (Øst) |
Aktier | Δ Aktier (%) |
Rapporteret Værdi ($1000) |
Δ Værdi (%) |
Port Alloc (%) |
|
|---|---|---|---|---|---|---|---|---|---|---|
| 2026-02-17 | 13F | Tudor Investment Corp Et Al | Put | 0 | -100,00 | 0 | -100,00 | |||
| 2026-02-10 | 13F | Bnp Paribas Arbitrage, Sa | 305 | 0,00 | 0 | |||||
| 2026-02-17 | 13F | Tower Research Capital LLC (TRC) | 12.873 | 20 | ||||||
| 2026-04-15 | 13F | Fortitude Family Office, LLC | 2.554 | 502,36 | 1 | |||||
| 2026-02-11 | 13F | Simplex Trading, Llc | 105.797 | 18,55 | 167 | |||||
| 2026-02-17 | 13F | ADAR1 Capital Management, LLC | Put | 100.000 | 158 | |||||
| 2026-02-17 | 13F | Sio Capital Management, LLC | Put | 1.125.400 | 1.778 | |||||
| 2025-11-13 | 13F | Riggs Asset Managment Co. Inc. | 0 | -100,00 | 0 | |||||
| 2026-02-17 | 13F | Citadel Advisors Llc | Put | 918.300 | 3.110,84 | 1.451 | 4.733,33 | |||
| 2025-11-14 | 13F | Cubist Systematic Strategies, LLC | 5.295 | 20.265,38 | 6 | |||||
| 2026-02-12 | 13F | Jane Street Group, Llc | 104.662 | 305,27 | 165 | 511,11 | ||||
| 2026-02-12 | 13F | Jane Street Group, Llc | Put | 39.500 | 62 | |||||
| 2026-02-13 | 13F | Vontobel Holding Ltd. | 40.000 | 63 | ||||||
| 2026-02-12 | 13F | Jane Street Group, Llc | Call | 17.400 | 20,00 | 27 | 80,00 | |||
| 2026-02-17 | 13F | Citadel Advisors Llc | Call | 121.300 | 605,23 | 192 | 961,11 | |||
| 2025-11-13 | 13F | Renaissance Technologies Llc | 0 | -100,00 | 0 | |||||
| 2026-01-29 | 13F | UBS Group AG | 209.540 | 335,51 | 331 | 549,02 | ||||
| 2026-02-13 | 13F | Squarepoint Ops LLC | 11.699 | 18 | ||||||
| 2026-02-17 | 13F | Millennium Management Llc | 164.498 | -15,46 | 260 | 25,73 | ||||
| 2026-02-06 | 13F | EverSource Wealth Advisors, LLC | 696 | 0,00 | 1 | |||||
| 2026-02-17 | 13F | Advisor Group Holdings, Inc. | 8.973 | 0,00 | 14 | 55,56 | ||||
| 2026-02-11 | 13F | Group One Trading, L.p. | 36.997 | 119,79 | 58 | 241,18 | ||||
| 2026-02-13 | 13F | Marshall Wace, Llp | 298.456 | 472 | ||||||
| 2026-02-17 | 13F | Ancora Advisors, LLC | 1.100 | 0,00 | 2 | 0,00 | ||||
| 2026-02-12 | 13F | Commonwealth Equity Services, Llc | 112.500 | -0,58 | 178 | |||||
| 2026-02-13 | 13F | JustInvest LLC | 15.605 | 12,33 | 25 | 71,43 | ||||
| 2026-02-17 | 13F | Susquehanna International Group, Llp | Put | 192.900 | 687,35 | 305 | 1.116,00 | |||
| 2025-11-14 | 13F | Aqr Capital Management Llc | 0 | -100,00 | 0 | -100,00 | ||||
| 2026-02-17 | 13F | Susquehanna International Group, Llp | Call | 367.800 | 581 | |||||
| 2026-01-26 | 13F | Cwm, Llc | 283 | 0,00 | 0 | |||||
| 2026-02-10 | 13F/A | Northwestern Mutual Wealth Management Co | 2.125 | 0,00 | 3 | 50,00 | ||||
| 2026-02-17 | 13F | Susquehanna International Group, Llp | 172.022 | -18,64 | 272 | 20,98 | ||||
| 2026-04-10 | 13F | Armstrong Advisory Group, Inc | 179 | 0,00 | 0 | |||||
| 2026-02-11 | 13F | LPL Financial LLC | 21.794 | -23,33 | 34 | 13,33 | ||||
| 2026-04-20 | 13F | Christensen, King & Associates Investment Services, Inc. | 28.327 | 0,00 | 6 | -88,64 | ||||
| 2025-11-14 | 13F | Raymond James Financial Inc | 0 | -100,00 | 0 | -100,00 | ||||
| 2026-04-14 | 13F | Flower City Capital | 20.000 | 0,00 | 4 | -87,10 | ||||
| 2026-02-17 | 13F | Qube Research & Technologies Ltd | 0 | -100,00 | 0 | -100,00 | ||||
| 2026-02-17 | 13F | Two Sigma Investments, Lp | 0 | -100,00 | 0 | -100,00 | ||||
| 2026-01-13 | 13F/A | Sanctuary Advisors, LLC | 33.495 | -7,69 | 36 | -39,66 | ||||
| 2026-02-11 | 13F | Jpmorgan Chase & Co | 15 | 0,00 | 0 | |||||
| 2026-02-17 | 13F | Northern Trust Corp | 67.390 | 158,51 | 106 | 292,59 | ||||
| 2026-02-17 | 13F | Royal Bank Of Canada | 687 | -85,67 | 1 | -80,00 | ||||
| 2026-02-17 | 13F | Bank Of America Corp /de/ | 128 | -99,86 | 0 | -100,00 | ||||
| 2026-02-17 | 13F | Schonfeld Strategic Advisors LLC | 2.441.355 | 241,37 | 3.857 | 408,84 | ||||
| 2026-02-03 | 13F | International Assets Investment Management, Llc | 1.000 | 2 | ||||||
| 2026-02-11 | 13F | Prestige Wealth Management Group LLC | 62 | 0,00 | 0 | |||||
| 2025-11-13 | 13F | Deutsche Bank Ag\ | 0 | -100,00 | 0 | |||||
| 2026-04-13 | 13F | IFP Advisors, Inc | 50 | 0,00 | 0 | |||||
| 2026-01-14 | 13F | Tradewinds Capital Management, LLC | 0 | -100,00 | 0 | |||||
| 2026-02-13 | 13F | State Street Corp | 163.102 | 116,60 | 258 | 225,32 | ||||
| 2026-02-06 | 13F | Pnc Financial Services Group, Inc. | 15.000 | 30,12 | 24 | 91,67 | ||||
| 2026-02-13 | 13F | Morgan Stanley | 6.024 | 677,29 | 10 | |||||
| 2025-11-13 | 13F | Quadrature Capital Ltd | 0 | -100,00 | 0 | -100,00 | ||||
| 2026-02-10 | 13F | Goldman Sachs Group Inc | 45.782 | 6,54 | 72 | 60,00 | ||||
| 2025-11-14 | 13F | Point72 (DIFC) Ltd | 0 | -100,00 | 0 | |||||
| 2026-01-29 | 13F | Vanguard Group Inc | 1.465.167 | 9,13 | 2.315 | 62,61 | ||||
| 2026-02-13 | 13F | Barclays Plc | 1 | 0,00 | 0 | -100,00 | ||||
| 2026-04-23 | 13F | Oppenheimer & Co Inc | 15.500 | 3 | ||||||
| 2026-02-12 | 13F | Scotia Capital Inc. | 73.989 | 0,00 | 117 | 48,72 | ||||
| 2025-11-06 | 13F | Ground Swell Capital, LLC | 0 | -100,00 | 0 | |||||
| 2026-02-13 | 13F | Wells Fargo & Company/mn | 2.480 | 75,89 | 4 | 200,00 | ||||
| 2026-02-06 | 13F | Larson Financial Group LLC | 100 | 0,00 | 0 | |||||
| 2026-02-17 | 13F | Tudor Investment Corp Et Al | Call | 10.000 | 16 | |||||
| 2026-02-09 | 13F | Geode Capital Management, Llc | 316.464 | 3,32 | 500 | 54,32 | ||||
| 2026-02-12 | 13F | Federation des caisses Desjardins du Quebec | 1.312 | 0,00 | 2 | 100,00 | ||||
| 2026-04-21 | 13F | Gilpin Wealth Management, Llc | Call | 23 | ||||||
| 2026-02-12 | 13F | BlackRock, Inc. | 404.542 | 9,41 | 639 | 63,43 | ||||
| 2026-02-17 | 13F | Two Sigma Securities, Llc | 0 | -100,00 | 0 | |||||
| 2026-04-21 | 13F | Gilpin Wealth Management, Llc | 600.162 | 69,44 | 124 | -78,00 | ||||
| 2025-11-14 | 13F | Hrt Financial Lp | 0 | -100,00 | 0 | |||||
| 2026-02-12 | 13F | Wealthspire Advisors, LLC | 0 | -100,00 | 0 | |||||
| 2026-02-17 | 13F | Russell Investments Group, Ltd. | 0 | -100,00 | 0 | -100,00 | ||||
| 2026-02-13 | 13F | Citigroup Inc | 1.554 | -90,27 | 2 | -87,50 | ||||
| 2025-11-14 | 13F | Jain Global LLC | 0 | -100,00 | 0 | -100,00 | ||||
| 2026-02-09 | 13F | Harbour Investments, Inc. | 10.152 | 1.136,54 | 16 | |||||
| 2026-02-17 | 13F | Fmr Llc | 606 | 471,70 | 1 | |||||
| 2026-02-17 | 13F | Jones Financial Companies Lllp | 2.500 | 0,00 | 4 | 50,00 | ||||
| 2025-11-14 | 13F | Ieq Capital, Llc | 0 | -100,00 | 0 | |||||
| 2026-02-03 | 13F | SBI Securities Co., Ltd. | 210 | 0,00 | 0 | |||||
| 2026-02-12 | 13F | Steward Partners Investment Advisory, Llc | 14 | 0,00 | 0 | |||||
| 2025-11-14 | 13F | Point72 Asia (Singapore) Pte. Ltd. | 5.815 | -43,21 | 6 | -62,50 | ||||
| 2026-04-20 | 13F | LVW Advisors, LLC | 0 | -100,00 | 0 | -100,00 | ||||
| 2026-02-17 | 13F | XTX Topco Ltd | 30.224 | 174,51 | 48 | 327,27 | ||||
| 2026-03-04 | 13F | SHP Wealth Management | 59 | 0 |
Other Listings
| US:OTLK | 0,32 $ |