Grundlæggende statistik
| Institutionelle aktier (lange) | 728.495 - 10,32% (ex 13D/G) - change of 0,08MM shares 12,57% MRQ |
| Institutionel værdi (lang) | $ 35.845 USD ($1000) |
Institutionelt ejerskab og aktionærer
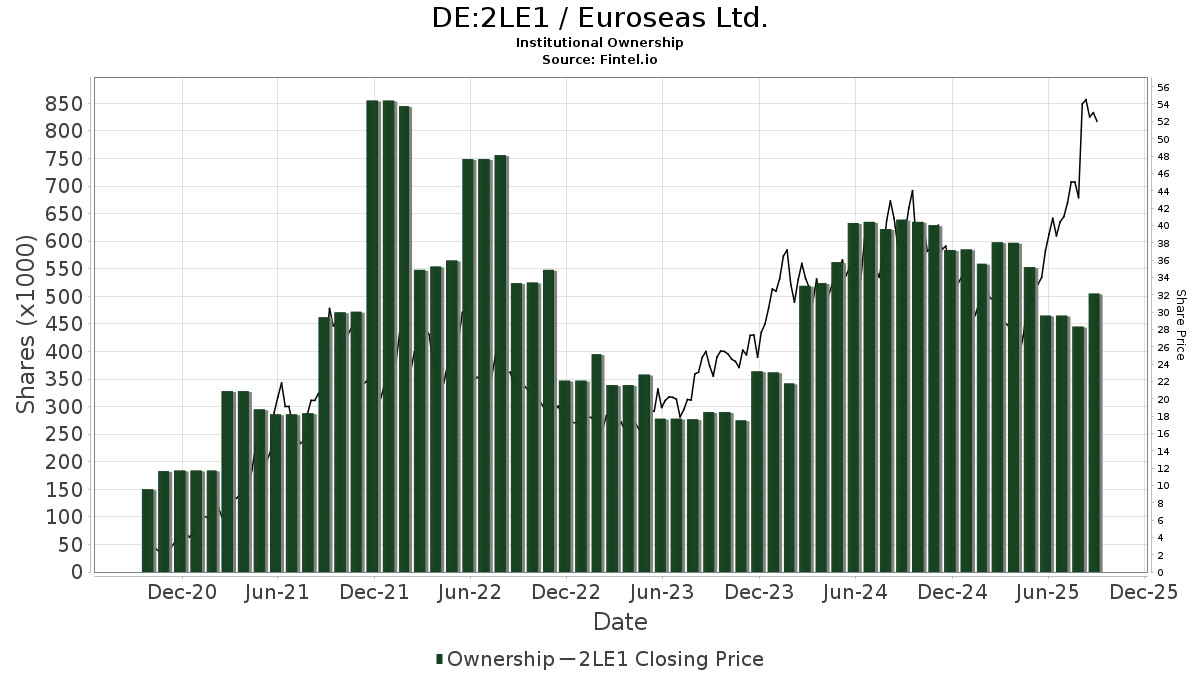
Euroseas Ltd. (DE:2LE1) har 59 institutionelle ejere og aktionærer, der har indsendt 13D/G- eller 13F-formularer til Securities Exchange Commission (SEC). Disse institutioner har i alt 728,495 aktier. Største aktionærer omfatter Renaissance Technologies Llc, Acadian Asset Management Llc, Millennium Management Llc, D. E. Shaw & Co., Inc., Morgan Stanley, Lazard Asset Management Llc, Two Sigma Investments, Lp, Citadel Advisors Llc, Walleye Capital LLC, and Bank Of America Corp /de/ .
Euroseas Ltd. (DB:2LE1) institutionel ejerskabsstruktur viser aktuelle positioner i virksomheden efter institutioner og fonde, samt seneste ændringer i positionsstørrelse. Større aktionærer kan omfatte individuelle investorer, investeringsforeninger, hedgefonde eller institutioner. Skema 13D angiver, at investoren besidder (eller besidder) mere end 5 % af virksomheden og har til hensigt (eller har til hensigt at) aktivt at forfølge en ændring i forretningsstrategi. Skema 13G indikerer en passiv investering på over 5%.
The share price as of March 6, 2026 is 57,50 / share. Previously, on March 10, 2025, the share price was 25,36 / share. This represents an increase of 126,74% over that period.
Fondens stemningsscore
Fund Sentiment Score (fka Ownership Accumulation Score) finder de aktier, der bliver mest købt af fonde. Det er resultatet af en sofistikeret, multi-faktor kvantitativ model, der identificerer virksomheder med de højeste niveauer af institutionel akkumulering. Scoringsmodellen bruger en kombination af den samlede stigning i oplyste ejere, ændringerne i porteføljeallokeringer i disse ejere og andre målinger. Tallet går fra 0 til 100, hvor højere tal indikerer et højere niveau af akkumulering for sine jævnaldrende, og 50 er gennemsnittet.
Opdateringsfrekvens: Dagligt
Se Ownership Explorer, som giver en liste over højest rangerende virksomheder.
AI+ Ask Fintel’s AI assistant about Euroseas Ltd..
Select a question to share a public post with an AI-crafted answer.
Thinking of good questions…
13F og NPORT arkivering
Detaljer om 13F-arkivering er gratis. Detaljer om NP-ansøgninger kræver et premium-medlemskab. Grønne rækker angiver nye positioner. Røde rækker angiver lukkede positioner. Klik på linket ikon for at se den fulde transaktionshistorik.
Opgrader
for at låse premium-data op og eksportere til Excel ![]() .
.
| Fil dato | Kilde | Investor | Type | Gennemsnitlig pris (Øst) |
Aktier | Δ Aktier (%) |
Rapporteret Værdi ($1000) |
Δ Værdi (%) |
Port Alloc (%) |
|
|---|---|---|---|---|---|---|---|---|---|---|
| 2026-02-17 | 13F | Aquatic Capital Management LLC | 952 | 52 | ||||||
| 2026-02-13 | 13F | Toroso Investments, LLC | 11.488 | 26,94 | 627 | 16,33 | ||||
| 2025-10-21 | 13F | Optimum Investment Advisors | 500 | 0,00 | 30 | 31,82 | ||||
| 2026-02-12 | 13F | Jane Street Group, Llc | 7.401 | -56,25 | 404 | -59,92 | ||||
| 2026-02-17 | 13F | Qube Research & Technologies Ltd | 6.219 | 46,33 | 340 | 33,99 | ||||
| 2026-02-17 | 13F | Point72 Asset Management, L.P. | 13.336 | 728 | ||||||
| 2026-02-17 | 13F | Millennium Management Llc | 53.386 | 171,71 | 2.915 | 148,85 | ||||
| 2026-02-18 | 13F | Mackenzie Financial Corp | 18.469 | -3,12 | 1.015 | -10,74 | ||||
| 2026-02-09 | 13F | Blue Bell Private Wealth Management, Llc | 3.421 | -0,29 | 187 | -8,82 | ||||
| 2026-02-17 | 13F | Public Employees Retirement System Of Ohio | 6.371 | 0,00 | 348 | -8,44 | ||||
| 2026-02-10 | 13F | Acadian Asset Management Llc | 72.657 | 5,84 | 4 | -25,00 | ||||
| 2025-11-17 | 13F | Perritt Capital Management Inc | 0 | -100,00 | 0 | |||||
| 2026-02-17 | 13F | Engineers Gate Manager LP | 5.689 | 311 | ||||||
| 2026-02-06 | 13F | Kingdom Financial Group LLC. | 0 | 0 | ||||||
| 2026-02-03 | 13F | Navellier & Associates Inc | 9.840 | 537 | ||||||
| 2026-02-17 | 13F | Jump Financial, LLC | 10.692 | 39,35 | 584 | 27,57 | ||||
| 2026-02-17 | 13F | Advisor Group Holdings, Inc. | 5.436 | -7,27 | 297 | -18,68 | ||||
| 2026-02-13 | 13F | Barclays Plc | 600 | 0,00 | 33 | -8,57 | ||||
| 2026-02-13 | 13F | Citigroup Inc | 2.036 | 40.620,00 | 111 | |||||
| 2025-09-24 | NP | Innovator ETFs Trust - Innovator U.S. Small Cap Managed Floor ETF | 153 | 6,25 | 8 | 75,00 | ||||
| 2026-01-26 | 13F | Cwm, Llc | 400 | 0,00 | 0 | |||||
| 2026-02-10 | 13F | Bnp Paribas Arbitrage, Sa | 0 | -100,00 | 0 | -100,00 | ||||
| 2026-02-17 | 13F | Jones Financial Companies Lllp | 159 | 112,00 | 9 | 100,00 | ||||
| 2026-01-29 | 13F | UBS Group AG | 12.246 | 4.646,51 | 669 | 4.353,33 | ||||
| 2026-02-17 | 13F | Magnetar Financial LLC | 3.731 | 204 | ||||||
| 2026-02-23 | 13F | Virtu Financial LLC | 0 | -100,00 | 0 | |||||
| 2026-02-13 | 13F | Walleye Capital LLC | 22.509 | 10,50 | 1.229 | 1,15 | ||||
| 2026-02-13 | 13F | Morgan Stanley | 38.356 | -26,05 | 2.094 | -32,25 | ||||
| 2026-02-13 | 13F | Squarepoint Ops LLC | 10.334 | 564 | ||||||
| 2026-02-12 | 13F | BlackRock, Inc. | 4.642 | 86,35 | 253 | 70,95 | ||||
| 2026-02-18 | 13F | State of Tennessee, Treasury Department | 7.069 | 404 | ||||||
| 2026-02-17 | 13F | Quadrature Capital Ltd | 0 | -100,00 | 0 | |||||
| 2026-02-13 | 13F | State Street Corp | 7.522 | 411 | ||||||
| 2026-02-12 | 13F | Renaissance Technologies Llc | 96.678 | -9,96 | 5.279 | -17,53 | ||||
| 2026-02-13 | 13F | Inspire Advisors, LLC | 0 | -100,00 | 0 | |||||
| 2026-02-17 | 13F | D. E. Shaw & Co., Inc. | 42.943 | 16,97 | 2.345 | 7,13 | ||||
| 2026-02-17 | 13F | Raymond James Financial Inc | 0 | -100,00 | 0 | |||||
| 2025-09-26 | NP | HAOSX - Harbor Overseas Fund Institutional Class | 1.641 | 85 | ||||||
| 2026-02-12 | 13F | Triumph Capital Management | 126 | 24,75 | 7 | 0,00 | ||||
| 2026-01-20 | 13F | Signaturefd, Llc | 175 | 0,00 | 10 | -10,00 | ||||
| 2026-02-17 | 13F | PharVision Advisers, LLC | 6.696 | -19,08 | 366 | -25,96 | ||||
| 2026-02-10 | 13F | Goldman Sachs Group Inc | 11.778 | -46,34 | 643 | -50,84 | ||||
| 2025-11-14 | 13F | Skopos Labs, Inc. | 0 | -100,00 | 0 | |||||
| 2026-01-23 | 13F | Farther Finance Advisors, LLC | 89 | 0,00 | 5 | -20,00 | ||||
| 2026-02-13 | 13F | Boston Partners | 19.146 | -1,90 | 1.045 | -10,15 | ||||
| 2025-11-07 | 13F | Beacon Capital Management, LLC | 0 | -100,00 | 0 | |||||
| 2026-02-05 | 13F | Northwestern Mutual Wealth Management Co | 1.280 | 540,00 | 76 | 581,82 | ||||
| 2026-02-13 | 13F | Quarry LP | 495 | -66,91 | 27 | -69,66 | ||||
| 2026-02-13 | 13F | Wells Fargo & Company/mn | 1.701 | 0,00 | 93 | -8,91 | ||||
| 2025-11-13 | 13F | Arrowstreet Capital, Limited Partnership | 0 | -100,00 | 0 | |||||
| 2026-01-30 | 13F | North Star Investment Management Corp. | 15.000 | 819 | ||||||
| 2026-02-17 | 13F | Tower Research Capital LLC (TRC) | 18 | 1 | ||||||
| 2026-02-17 | 13F | Citadel Advisors Llc | 30.327 | 14,11 | 1.656 | 4,48 | ||||
| 2026-02-17 | 13F | Russell Investments Group, Ltd. | 612 | 34 | ||||||
| 2025-11-14 | 13F | Kestra Advisory Services, LLC | 0 | -100,00 | 0 | |||||
| 2025-09-24 | NP | PRCGX - Perritt MicroCap Opportunities Fund Investor Class | 4.000 | -50,00 | 207 | -16,87 | ||||
| 2026-02-11 | 13F | LPL Financial LLC | 10.382 | 1,03 | 567 | -7,52 | ||||
| 2026-02-05 | 13F | Allworth Financial LP | 1.000 | 0,00 | 55 | -8,47 | ||||
| 2026-02-17 | 13F | Bank Of America Corp /de/ | 20.425 | 200,59 | 1.115 | 175,31 | ||||
| 2026-02-03 | 13F | SBI Securities Co., Ltd. | 139 | -19,19 | 8 | -30,00 | ||||
| 2026-02-17 | 13F | Two Sigma Investments, Lp | 31.273 | 88,54 | 1.708 | 72,77 | ||||
| 2025-11-14 | 13F | Cubist Systematic Strategies, LLC | 13.858 | 49,93 | 826 | 100,00 | ||||
| 2026-02-13 | 13F | Mariner, LLC | 8.041 | -1,63 | 439 | -9,86 | ||||
| 2025-11-10 | 13F | Novem Group | 0 | -100,00 | 0 | |||||
| 2025-11-07 | 13F | Gsa Capital Partners Llp | 0 | -100,00 | 0 | |||||
| 2026-02-09 | 13F | Geode Capital Management, Llc | 5.058 | 0,00 | 276 | -8,31 | ||||
| 2026-02-17 | 13F | Royal Bank Of Canada | 317 | 11,62 | 17 | 0,00 | ||||
| 2026-02-17 | 13F | Lazard Asset Management Llc | 35.031 | 3,74 | 1.913 | -4,97 | ||||
| 2025-11-13 | 13F | Marshall Wace, Llp | 0 | -100,00 | 0 | |||||
| 2026-01-30 | 13F | Archer Investment Corp | 213 | 0,00 | 12 | -8,33 | ||||
| 2026-02-17 | 13F | Susquehanna International Group, Llp | 9.901 | 133,18 | 541 | 113,44 | ||||
| 2026-01-05 | 13F | Commons Capital, Llc | 10.304 | 563 | ||||||
| 2026-02-17 | 13F | Credit Agricole S A | 14.234 | 0,00 | 777 | -8,37 |
Other Listings
| US:ESEA | 64,76 $ |