Grundlæggende statistik
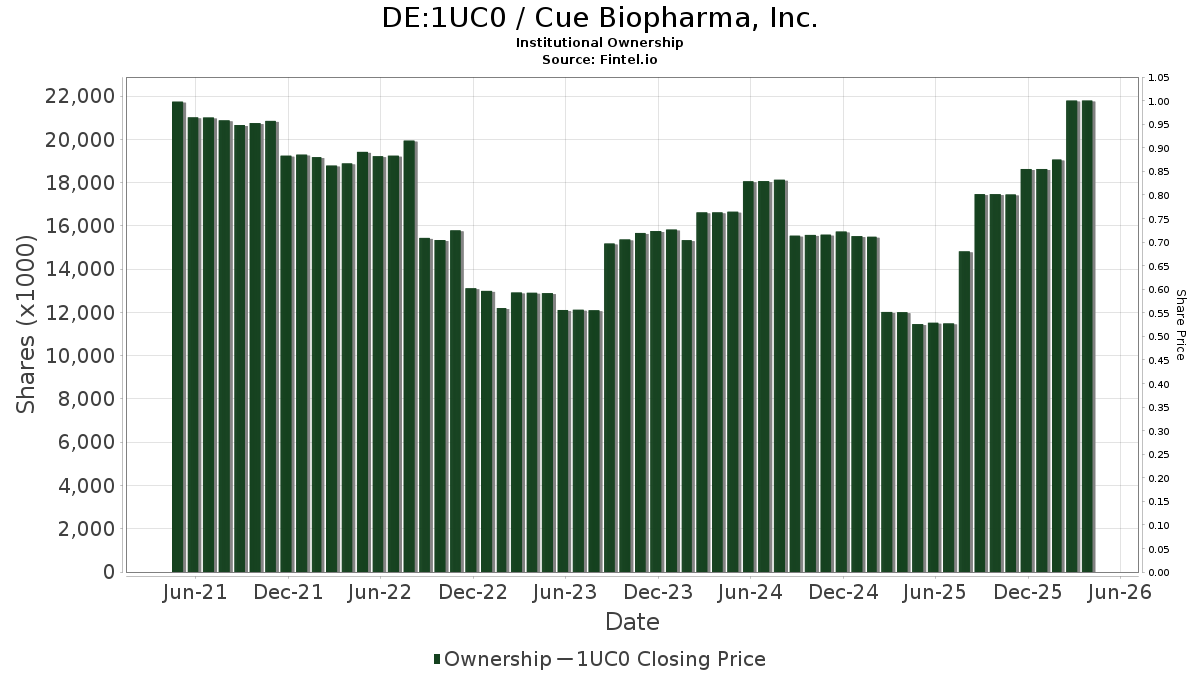
| Institutionelle aktier (lange) | 21.789.520 - 669,34% (ex 13D/G) - change of 3,16MM shares 16,98% MRQ |
| Institutionel værdi (lang) | $ 6.626 USD ($1000) |
Institutionelt ejerskab og aktionærer
Cue Biopharma, Inc. (DE:1UC0) har 49 institutionelle ejere og aktionærer, der har indsendt 13D/G- eller 13F-formularer til Securities Exchange Commission (SEC). Disse institutioner har i alt 21,789,520 aktier. Største aktionærer omfatter Bleichroeder LP, Catalytic Wealth RIA, LLC, Vanguard Group Inc, Lion Point Capital, LP, Geode Capital Management, Llc, Boothbay Fund Management, Llc, Robertson Stephens Wealth Management, LLC, BlackRock, Inc., Texas Capital Bank Wealth Management Services Inc, and Angeles Wealth Management, Llc .
Cue Biopharma, Inc. (DB:1UC0) institutionel ejerskabsstruktur viser aktuelle positioner i virksomheden efter institutioner og fonde, samt seneste ændringer i positionsstørrelse. Større aktionærer kan omfatte individuelle investorer, investeringsforeninger, hedgefonde eller institutioner. Skema 13D angiver, at investoren besidder (eller besidder) mere end 5 % af virksomheden og har til hensigt (eller har til hensigt at) aktivt at forfølge en ændring i forretningsstrategi. Skema 13G indikerer en passiv investering på over 5%.
Fondens stemningsscore
Fund Sentiment Score (fka Ownership Accumulation Score) finder de aktier, der bliver mest købt af fonde. Det er resultatet af en sofistikeret, multi-faktor kvantitativ model, der identificerer virksomheder med de højeste niveauer af institutionel akkumulering. Scoringsmodellen bruger en kombination af den samlede stigning i oplyste ejere, ændringerne i porteføljeallokeringer i disse ejere og andre målinger. Tallet går fra 0 til 100, hvor højere tal indikerer et højere niveau af akkumulering for sine jævnaldrende, og 50 er gennemsnittet.
Opdateringsfrekvens: Dagligt
Se Ownership Explorer, som giver en liste over højest rangerende virksomheder.
AI+ Ask Fintel’s AI assistant about Cue Biopharma, Inc..
Select a question to share a public post with an AI-crafted answer.
Thinking of good questions…
13F og NPORT arkivering
Detaljer om 13F-arkivering er gratis. Detaljer om NP-ansøgninger kræver et premium-medlemskab. Grønne rækker angiver nye positioner. Røde rækker angiver lukkede positioner. Klik på linket ikon for at se den fulde transaktionshistorik.
Opgrader
for at låse premium-data op og eksportere til Excel ![]() .
.
| Fil dato | Kilde | Investor | Type | Gennemsnitlig pris (Øst) |
Aktier | Δ Aktier (%) |
Rapporteret Værdi ($1000) |
Δ Værdi (%) |
Port Alloc (%) |
|
|---|---|---|---|---|---|---|---|---|---|---|
| 2026-02-17 | 13F | Two Sigma Securities, Llc | 0 | -100,00 | 0 | |||||
| 2026-02-17 | 13F | Lion Point Capital, LP | 2.202.854 | 673 | ||||||
| 2026-02-13 | 13F | Morgan Stanley | 18.594 | -32,41 | 6 | -73,68 | ||||
| 2026-01-28 | 13F | Chicago Partners Investment Group LLC | 85.937 | 0,00 | 33 | -49,21 | ||||
| 2026-04-13 | 13F | IFP Advisors, Inc | 100 | 0,00 | 0 | |||||
| 2026-02-10 | 13F/A | Northwestern Mutual Wealth Management Co | 79.500 | 0,00 | 24 | -57,89 | ||||
| 2026-02-10 | 13F | Goldman Sachs Group Inc | 14.371 | -0,13 | 4 | -60,00 | ||||
| 2026-02-10 | 13F | Tidemark, LLC | 1.500 | 0,00 | 0 | -100,00 | ||||
| 2026-02-12 | 13F | Renaissance Technologies Llc | 238.354 | 4,97 | 73 | -55,83 | ||||
| 2026-01-15 | 13F | Gleason Group, Inc. | 6.000 | 0,00 | 2 | -75,00 | ||||
| 2026-02-02 | 13F | Robertson Stephens Wealth Management, LLC | 478.500 | 0,00 | 146 | -57,43 | ||||
| 2026-02-17 | 13F | Advisor Group Holdings, Inc. | 680 | 0,00 | 0 | |||||
| 2026-02-09 | 13F | Geode Capital Management, Llc | 803.291 | 0,32 | 245 | -57,39 | ||||
| 2026-04-24 | 13F | UMA Financial Services, Inc. | 1.006 | 0,00 | 0 | |||||
| 2026-02-11 | 13F | Simplex Trading, Llc | 2.557 | -47,08 | 1 | |||||
| 2026-02-11 | 13F | Simplex Trading, Llc | Put | 200 | 100,00 | 0 | ||||
| 2026-02-17 | 13F | Boothbay Fund Management, Llc | 704.297 | 15,28 | 215 | -51,03 | ||||
| 2026-04-13 | 13F | Mather Group, Llc. | 1.000 | 0 | ||||||
| 2026-02-13 | 13F | Golden State Wealth Management, LLC | 2.000 | 0,00 | 1 | -100,00 | ||||
| 2026-02-17 | 13F | XTX Topco Ltd | 0 | -100,00 | 0 | |||||
| 2026-04-15 | 13F | Seacrest Wealth Management, Llc | 10.000 | 0,00 | 2 | -33,33 | ||||
| 2026-02-05 | 13F | Cambridge Investment Research Advisors, Inc. | 20.000 | 0,00 | 0 | |||||
| 2026-02-13 | 13F | Citigroup Inc | 0 | -100,00 | 0 | |||||
| 2026-02-13 | 13F | Barclays Plc | 6.029 | 0,00 | 2 | -75,00 | ||||
| 2026-02-03 | 13F | SBI Securities Co., Ltd. | 0 | -100,00 | 0 | |||||
| 2026-02-13 | 13F | MAI Capital Management | 350 | 0,00 | 0 | |||||
| 2026-02-11 | 13F | Jpmorgan Chase & Co | 4 | -99,56 | 0 | |||||
| 2026-01-29 | 13F | UBS Group AG | 46.848 | -76,48 | 14 | -90,21 | ||||
| 2026-02-13 | 13F | Stifel Financial Corp | 246.556 | 25,44 | 75 | -46,81 | ||||
| 2026-02-13 | 13F | State Street Corp | 179.353 | -5,48 | 55 | -60,29 | ||||
| 2026-02-17 | 13F | Tower Research Capital LLC (TRC) | 0 | -100,00 | 0 | |||||
| 2026-02-13 | 13F | Wells Fargo & Company/mn | 2.563 | -86,91 | 1 | -100,00 | ||||
| 2026-01-29 | 13F | Vanguard Group Inc | 3.014.034 | -0,83 | 919 | -57,94 | ||||
| 2026-02-10 | 13F | Bnp Paribas Arbitrage, Sa | 415 | -39,86 | 0 | |||||
| 2026-02-13 | 13F | Advisory Research Inc | 257.225 | 0,00 | 79 | -57,61 | ||||
| 2026-02-09 | 13F | Texas Capital Bank Wealth Management Services Inc | 440.670 | 1.231,25 | 135 | 482,61 | ||||
| 2026-02-13 | 13F | Squarepoint Ops LLC | 0 | -100,00 | 0 | |||||
| 2026-01-30 | 13F | Sigma Planning Corp | 41.050 | -22,98 | 13 | -68,42 | ||||
| 2026-02-17 | 13F | Susquehanna International Group, Llp | 168.829 | 1,43 | 52 | -57,14 | ||||
| 2026-02-17 | 13F | Advisory Services Network, LLC | 0 | -100,00 | 0 | |||||
| 2026-02-18 | 13F | GWM Advisors LLC | 20.000 | 0,00 | 6 | -57,14 | ||||
| 2026-02-12 | 13F | Hrt Financial Lp | 20.863 | 0 | ||||||
| 2026-02-12 | 13F | BlackRock, Inc. | 449.162 | 0,00 | 137 | -57,45 | ||||
| 2026-02-17 | 13F | Northern Trust Corp | 100.958 | 0,00 | 31 | -58,33 | ||||
| 2026-02-23 | 13F | Virtu Financial LLC | 0 | -100,00 | 0 | |||||
| 2026-02-17 | 13F | Angeles Wealth Management, Llc | 310.000 | 158,33 | 95 | 9,30 | ||||
| 2026-02-06 | 13F | Prevail Innovative Wealth Advisors, Llc | 18.987 | 0,00 | 6 | -61,54 | ||||
| 2026-02-06 | 13F | HighTower Advisors, LLC | 10.929 | 3 | ||||||
| 2026-02-12 | 13F | Jane Street Group, Llc | 69.793 | 21 | ||||||
| 2026-04-10 | 13F | Armstrong Advisory Group, Inc | 120 | 0,00 | 0 | |||||
| 2026-02-06 | 13F | New Millennium Group LLC | 5.750 | 2 | ||||||
| 2026-01-30 | 13F | Torren Management, LLC | 324 | 0 | ||||||
| 2026-02-05 | 13F | Navalign, LLC | 0 | -100,00 | 0 | |||||
| 2025-11-14 | 13F | Raymond James Financial Inc | 0 | -100,00 | 0 | |||||
| 2026-02-17 | 13F | Jones Financial Companies Lllp | 400 | 0 | ||||||
| 2026-02-11 | 13F | LPL Financial LLC | 46.390 | 0,00 | 14 | -57,58 | ||||
| 2026-02-17 | 13F | Bank Of America Corp /de/ | 207.569 | -36,04 | 63 | -72,96 | ||||
| 2025-11-14 | 13F | Beacon Pointe Advisors, LLC | 0 | -100,00 | 0 | |||||
| 2026-01-30 | 13F | Catalytic Wealth RIA, LLC | 4.631.644 | 34,97 | 1.415 | -42,66 | ||||
| 2026-02-13 | 13F | Bleichroeder LP | 6.819.164 | 0,00 | 2.083 | -57,51 | ||||
| 2026-02-20 | 13F | Sunbelt Securities, Inc. | 0 | -100,00 | 0 | |||||
| 2026-01-21 | 13F | Newbridge Financial Services Group, Inc. | 3.000 | 0,00 | 1 | -100,00 |
Other Listings
| US:CUE | 17,70 $ |