Grundlæggende statistik
| Institutionelle aktier (lange) | 69.621.157 - 53,48% (ex 13D/G) - change of 32,88MM shares 89,49% MRQ |
| Institutionel værdi (lang) | $ 108.019 USD ($1000) |
Institutionelt ejerskab og aktionærer
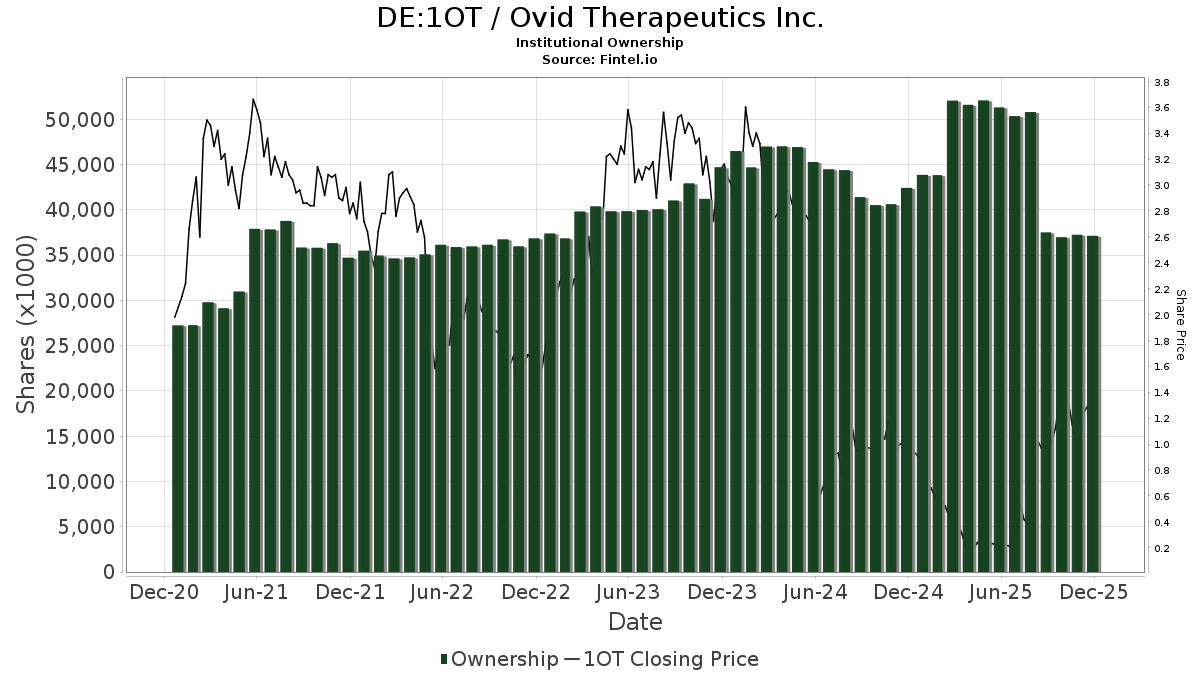
Ovid Therapeutics Inc. (DE:1OT) har 91 institutionelle ejere og aktionærer, der har indsendt 13D/G- eller 13F-formularer til Securities Exchange Commission (SEC). Disse institutioner har i alt 69,621,157 aktier. Største aktionærer omfatter Ra Capital Management, L.p., Takeda Pharmaceutical Co Ltd, Affinity Asset Advisors, LLC, Eventide Asset Management, Llc, ADAR1 Capital Management, LLC, Federated Hermes, Inc., Point72 Asset Management, L.P., Adage Capital Partners Gp, L.l.c., Vanguard Group Inc, and Saturn V Capital Management LLC .
Ovid Therapeutics Inc. (DB:1OT) institutionel ejerskabsstruktur viser aktuelle positioner i virksomheden efter institutioner og fonde, samt seneste ændringer i positionsstørrelse. Større aktionærer kan omfatte individuelle investorer, investeringsforeninger, hedgefonde eller institutioner. Skema 13D angiver, at investoren besidder (eller besidder) mere end 5 % af virksomheden og har til hensigt (eller har til hensigt at) aktivt at forfølge en ændring i forretningsstrategi. Skema 13G indikerer en passiv investering på over 5%.
The share price as of March 6, 2026 is 1,54 / share. Previously, on March 7, 2025, the share price was 0,44 / share. This represents an increase of 250,00% over that period.
Fondens stemningsscore
Fund Sentiment Score (fka Ownership Accumulation Score) finder de aktier, der bliver mest købt af fonde. Det er resultatet af en sofistikeret, multi-faktor kvantitativ model, der identificerer virksomheder med de højeste niveauer af institutionel akkumulering. Scoringsmodellen bruger en kombination af den samlede stigning i oplyste ejere, ændringerne i porteføljeallokeringer i disse ejere og andre målinger. Tallet går fra 0 til 100, hvor højere tal indikerer et højere niveau af akkumulering for sine jævnaldrende, og 50 er gennemsnittet.
Opdateringsfrekvens: Dagligt
Se Ownership Explorer, som giver en liste over højest rangerende virksomheder.
AI+ Ask Fintel’s AI assistant about Ovid Therapeutics Inc..
Select a question to share a public post with an AI-crafted answer.
Thinking of good questions…
13F og NPORT arkivering
Detaljer om 13F-arkivering er gratis. Detaljer om NP-ansøgninger kræver et premium-medlemskab. Grønne rækker angiver nye positioner. Røde rækker angiver lukkede positioner. Klik på linket ikon for at se den fulde transaktionshistorik.
Opgrader
for at låse premium-data op og eksportere til Excel ![]() .
.
| Fil dato | Kilde | Investor | Type | Gennemsnitlig pris (Øst) |
Aktier | Δ Aktier (%) |
Rapporteret Værdi ($1000) |
Δ Værdi (%) |
Port Alloc (%) |
|
|---|---|---|---|---|---|---|---|---|---|---|
| 2026-02-17 | 13F | SageView Advisory Group, LLC | 44 | 0 | ||||||
| 2026-02-17 | 13F | Ikarian Capital, LLC | 247.558 | -77,40 | 404 | -71,70 | ||||
| 2026-02-17 | 13F | Citadel Advisors Llc | Put | 16.700 | -73,28 | 27 | -66,67 | |||
| 2026-02-17 | 13F | Parkman Healthcare Partners LLC | 201.036 | -0,96 | 328 | 24,33 | ||||
| 2026-02-17 | 13F | Citadel Advisors Llc | Call | 106.900 | 36,18 | 174 | 70,59 | |||
| 2026-02-13 | 13F | Kennedy Capital Management, Inc. | 0 | -100,00 | 0 | |||||
| 2026-02-17 | 13F | First Manhattan Co | 0 | -100,00 | 0 | |||||
| 2026-02-17 | 13F | Sio Capital Management, LLC | 1.427.495 | 0,00 | 2.327 | 25,39 | ||||
| 2025-11-14 | 13F | Cubist Systematic Strategies, LLC | 86.652 | 2.136,76 | 113 | 11.100,00 | ||||
| 2026-02-11 | 13F | Empowered Funds, LLC | 91.234 | 0,00 | 149 | 25,42 | ||||
| 2026-02-17 | 13F | Citadel Advisors Llc | 797.824 | 96,81 | 1.300 | 147,15 | ||||
| 2026-01-07 | 13F | Sovereign Financial Group, Inc. | 10.000 | 0,00 | 16 | 23,08 | ||||
| 2026-02-04 | 13F | Atlantic Union Bankshares Corp | 2.300 | 0,00 | 4 | 50,00 | ||||
| 2026-02-12 | 13F | Federated Hermes, Inc. | 3.571.000 | 5.307 | ||||||
| 2026-02-11 | 13F | Group One Trading, L.p. | Put | 4.500 | -96,65 | 7 | -95,98 | |||
| 2026-02-12 | 13F | Jane Street Group, Llc | 883.867 | 270,73 | 1.441 | 366,02 | ||||
| 2026-02-17 | 13F | Advisory Services Network, LLC | 0 | -100,00 | 0 | |||||
| 2026-02-11 | 13F | Group One Trading, L.p. | Call | 86.400 | 0,23 | 141 | 25,00 | |||
| 2026-02-17 | 13F | Millennium Management Llc | 1.339.465 | 35,81 | 2.183 | 70,28 | ||||
| 2026-02-04 | 13F | Tls Advisors Llc | 13.600 | -27,88 | 0 | |||||
| 2026-02-17 | 13F | Ra Capital Management, L.p. | 10.714.000 | 17.464 | ||||||
| 2026-02-17 | 13F | Quadrature Capital Ltd | 87.874 | 217,20 | 143 | 308,57 | ||||
| 2026-02-13 | 13F | Barclays Plc | 1 | -98,59 | 0 | |||||
| 2025-11-14 | 13F | Point72 (DIFC) Ltd | 197 | -84,86 | 0 | |||||
| 2025-11-14 | 13F | Aqr Capital Management Llc | 0 | -100,00 | 0 | |||||
| 2026-02-13 | 13F | OMERS ADMINISTRATION Corp | 125.300 | 204 | ||||||
| 2025-11-14 | 13F | Bvf Inc/il | 0 | -100,00 | 0 | -100,00 | ||||
| 2026-02-06 | 13F | Gsa Capital Partners Llp | 108.334 | -59,27 | 0 | |||||
| 2026-02-17 | 13F | Graham Capital Management, L.P. | 127.459 | 208 | ||||||
| 2026-02-13 | 13F | Velan Capital Investment Management LP | 160.000 | 0,00 | 261 | 25,00 | ||||
| 2026-02-17 | 13F | Point72 Asset Management, L.P. | 3.551.129 | 5.788 | ||||||
| 2026-02-11 | 13F | Simplex Trading, Llc | 31.603 | -91,84 | 52 | |||||
| 2026-02-11 | 13F | Simplex Trading, Llc | Call | 50.900 | 1.239,47 | 83 | ||||
| 2025-09-24 | NP | PPNMX - SmallCap Growth Fund I R-3 | 0 | -100,00 | 0 | -100,00 | ||||
| 2026-02-11 | 13F | Simplex Trading, Llc | Put | 7.100 | -95,40 | 12 | ||||
| 2025-10-31 | 13F | Y-Intercept (Hong Kong) Ltd | 0 | -100,00 | 0 | -100,00 | ||||
| 2026-02-19 | 13F | Invesco Ltd. | 33.308 | 54 | ||||||
| 2026-01-14 | 13F | Tradewinds Capital Management, LLC | 100 | 0 | ||||||
| 2026-02-13 | 13F | Eventide Asset Management, Llc | 4.285.000 | 6.985 | ||||||
| 2026-02-10 | 13F | NINE MASTS CAPITAL Ltd | 13.960 | 23 | ||||||
| 2026-02-13 | 13F | State Street Corp | 276.533 | 21,80 | 451 | 52,54 | ||||
| 2026-02-06 | 13F | Pnc Financial Services Group, Inc. | 903 | 0,00 | 1 | 0,00 | ||||
| 2026-02-17 | 13F | Two Sigma Securities, Llc | 0 | -100,00 | 0 | |||||
| 2026-02-17 | 13F | Diadema Partners Lp | 0 | -100,00 | 0 | |||||
| 2026-02-10 | 13F | Goldman Sachs Group Inc | 170.457 | 497,74 | 278 | 648,65 | ||||
| 2025-11-14 | 13F | Hrt Financial Lp | 0 | -100,00 | 0 | |||||
| 2026-02-17 | 13F | Ally Bridge Group (NY) LLC | 1.785.000 | 2.910 | ||||||
| 2025-09-15 | 13F/A | Charles Schwab Investment Management Inc | 135.487 | -16,27 | 42 | -72,19 | ||||
| 2025-11-13 | 13F | Rosalind Advisors, Inc. | 0 | -100,00 | 0 | -100,00 | ||||
| 2026-02-17 | 13F | Driehaus Capital Management Llc | 0 | -100,00 | 0 | |||||
| 2026-02-13 | 13F | Stonepine Capital Management, LLC | 102.367 | 167 | ||||||
| 2025-10-09 | 13F | Newman Dignan & Sheerar, Inc. | 0 | -100,00 | 0 | -100,00 | ||||
| 2026-02-03 | 13F | SBI Securities Co., Ltd. | 189 | -55,53 | 0 | |||||
| 2026-02-17 | 13F | Private Advisor Group, LLC | 0 | -100,00 | 0 | |||||
| 2026-02-17 | 13F | Saturn V Capital Management LLC | 2.500.000 | 4.075 | ||||||
| 2025-09-29 | NP | KCXIX - Knights of Columbus U.S. All Cap Index Fund I Shares | 256 | 18,52 | 0 | |||||
| 2026-02-12 | 13F | BlackRock, Inc. | 613.475 | 0,35 | 1.000 | 25,82 | ||||
| 2026-01-15 | 13F | Allspring Global Investments Holdings, LLC | 11.262 | 0,00 | 19 | 20,00 | ||||
| 2026-02-11 | 13F | Group One Trading, L.p. | 0 | -100,00 | 0 | -100,00 | ||||
| 2026-02-12 | 13F | Renaissance Technologies Llc | 1.484.478 | -26,44 | 2.420 | -7,78 | ||||
| 2026-02-17 | 13F | XTX Topco Ltd | 188.456 | 2,81 | 307 | 28,99 | ||||
| 2026-02-13 | 13F | Citigroup Inc | 4.721 | 484,28 | 8 | 600,00 | ||||
| 2026-02-17 | 13F | Fmr Llc | 43.974 | -6,41 | 72 | 16,39 | ||||
| 2025-11-13 | 13F | Hsbc Holdings Plc | 0 | -100,00 | 0 | -100,00 | ||||
| 2026-02-13 | 13F | AWM Investment Company, Inc. | 899.200 | 1.466 | ||||||
| 2026-02-17 | 13F | Persistent Asset Partners Ltd | 0 | -100,00 | 0 | |||||
| 2026-02-09 | 13F | Hartland & Co., LLC | 2.734 | 4 | ||||||
| 2025-11-10 | 13F | EverSource Wealth Advisors, LLC | 0 | -100,00 | 0 | |||||
| 2026-01-23 | 13F | TFC Financial Management | 1.000 | 2 | ||||||
| 2025-11-14 | 13F | Rubric Capital Management LP | 0 | -100,00 | 0 | |||||
| 2026-02-17 | 13F | Boothbay Fund Management, Llc | 155.741 | -68,01 | 254 | -59,97 | ||||
| 2026-01-12 | 13F | Benin Management CORP | 19.000 | 31 | ||||||
| 2026-02-17 | 13F | Balyasny Asset Management Llc | 325.000 | -48,00 | 530 | -34,85 | ||||
| 2026-02-17 | 13F | Tower Research Capital LLC (TRC) | 10.676 | 355,46 | 17 | 466,67 | ||||
| 2026-02-10 | 13F | Bnp Paribas Arbitrage, Sa | 980 | 1,87 | 2 | 0,00 | ||||
| 2026-02-17 | 13F | ADAR1 Capital Management, LLC | 4.285.000 | 33.256,69 | 6.985 | 43.550,00 | ||||
| 2026-01-29 | 13F | Quadcap Wealth Management, LLC | Call | 4.000 | 0,00 | 7 | 20,00 | |||
| 2026-02-12 | 13F | Sepio Capital, LP | 10.145 | 17 | ||||||
| 2026-01-29 | 13F | Quadcap Wealth Management, LLC | 11.111 | 0,00 | 18 | 28,57 | ||||
| 2026-01-09 | 13F | Assenagon Asset Management S.A. | 618.019 | -33,16 | 1.007 | -16,15 | ||||
| 2026-02-13 | 13F | Squarepoint Ops LLC | 39.034 | -66,03 | 64 | -57,72 | ||||
| 2026-01-26 | 13F | Cwm, Llc | 0 | -100,00 | 0 | |||||
| 2026-02-13 | 13F | Marshall Wace, Llp | 1.271.487 | 2.073 | ||||||
| 2026-02-17 | 13F | Abel Hall, LLC | 31.427 | -2,85 | 51 | 21,43 | ||||
| 2026-02-17 | 13F | Adage Capital Partners Gp, L.l.c. | 3.492.000 | 158,67 | 5.692 | 224,27 | ||||
| 2025-11-14 | 13F | Virtu Financial LLC | 0 | -100,00 | 0 | |||||
| 2026-02-17 | 13F | Advisor Group Holdings, Inc. | 0 | -100,00 | 0 | |||||
| 2026-02-14 | 13F | Rockefeller Capital Management L.P. | 4.000 | 7 | ||||||
| 2026-02-11 | 13F | LPL Financial LLC | 30.000 | 150,00 | 49 | 220,00 | ||||
| 2025-10-31 | 13F | PFG Investments, LLC | 0 | -100,00 | 0 | -100,00 | ||||
| 2026-01-15 | 13F | Nisa Investment Advisors, Llc | 2.351 | 0,00 | 4 | 0,00 | ||||
| 2026-02-13 | 13F | Morgan Stanley | 36.952 | 1.496,89 | 60 | 1.900,00 | ||||
| 2026-01-29 | 13F | UBS Group AG | 192.985 | -18,91 | 315 | 1,62 | ||||
| 2026-02-10 | 13F | Acadian Asset Management Llc | 1.231.698 | -46,13 | 2 | 0,00 | ||||
| 2026-02-17 | 13F | Northern Trust Corp | 166.631 | 9,83 | 272 | 37,56 | ||||
| 2026-02-11 | 13F | Jpmorgan Chase & Co | 147 | -95,00 | 0 | -100,00 | ||||
| 2025-11-13 | 13F | Takeda Pharmaceutical Co Ltd | 7.531.996 | 0,00 | 9.792 | 294,00 | ||||
| 2025-11-14 | 13F | Madison Avenue Partners, LP | 0 | -100,00 | 0 | |||||
| 2026-02-17 | 13F | Schonfeld Strategic Advisors LLC | 192.496 | -78,20 | 314 | -72,74 | ||||
| 2026-02-17 | 13F | Susquehanna International Group, Llp | 341.740 | -41,99 | 557 | -27,19 | ||||
| 2026-02-17 | 13F | Susquehanna International Group, Llp | Put | 14.300 | 23 | |||||
| 2026-01-21 | 13F | Sound Income Strategies, LLC | 6 | 0,00 | 0 | |||||
| 2026-02-02 | 13F | Total Clarity Wealth Management, Inc. | 28.600 | 47 | ||||||
| 2026-02-17 | 13F | Two Sigma Investments, Lp | 598.869 | 75,55 | 976 | 120,32 | ||||
| 2026-02-17 | 13F | Bank Of America Corp /de/ | 194.900 | -46,27 | 318 | -32,70 | ||||
| 2026-02-17 | 13F | Susquehanna International Group, Llp | Call | 12.000 | -79,35 | 20 | -74,67 | |||
| 2026-01-29 | 13F | Vanguard Group Inc | 3.072.227 | 8,91 | 5.008 | 36,54 | ||||
| 2026-02-13 | 13F | Affinity Asset Advisors, LLC | 7.150.000 | 169,81 | 11.654 | 238,29 | ||||
| 2026-01-21 | 13F | Aaron Wealth Advisors LLC | 11.234 | 0,00 | 18 | 28,57 | ||||
| 2026-02-17 | 13F | Two Sigma Advisers, Lp | 239.200 | 57,58 | 390 | 97,46 | ||||
| 2026-01-27 | 13F | TD Waterhouse Canada Inc. | 30 | 0,00 | 0 | |||||
| 2026-01-22 | 13F | Apollon Wealth Management, LLC | 0 | -100,00 | 0 | |||||
| 2026-02-13 | 13F | SRS Capital Advisors, Inc. | 57 | -59,29 | 0 | |||||
| 2026-02-13 | 13F | Wells Fargo & Company/mn | 720.848 | -1,35 | 1.175 | 23,71 | ||||
| 2026-02-13 | 13F | Integrated Wealth Concepts LLC | 0 | -100,00 | 0 | |||||
| 2026-02-17 | 13F | Bridgeway Capital Management Inc | 95.434 | 0,00 | 156 | 25,00 | ||||
| 2026-02-17 | 13F | Blair William & Co/il | 26.339 | 4,98 | 43 | 31,25 | ||||
| 2026-02-17 | 13F | Cetera Investment Advisers | 17.001 | 0,01 | 28 | 22,73 | ||||
| 2026-02-09 | 13F | Geode Capital Management, Llc | 672.004 | 3,70 | 1.096 | 30,05 | ||||
| 2025-10-21 | 13F | True Wealth Design, LLC | 0 | -100,00 | 0 | |||||
| 2025-11-13 | 13F | Jump Financial, LLC | 0 | -100,00 | 0 | |||||
| 2026-02-17 | 13F | Royal Bank Of Canada | 1.075 | -76,55 | 2 | -66,67 | ||||
| 2026-02-13 | 13F | Walleye Capital LLC | 530.020 | -11,18 | 864 | 11,35 | ||||
| 2026-01-30 | 13F | North Star Investment Management Corp. | 1.043 | 0,00 | 2 | 0,00 | ||||
| 2026-02-10 | 13F | Bank of New York Mellon Corp | 57.698 | 0,00 | 94 | 25,33 | ||||
| 2026-02-17 | 13F | Qube Research & Technologies Ltd | 53.951 | 113,44 | 88 | 171,88 | ||||
| 2025-11-14 | 13F | Point72 Asia (Singapore) Pte. Ltd. | 19.173 | -50,05 | 25 | 100,00 | ||||
| 2025-10-08 | 13F/A | New York State Common Retirement Fund | 0 | -100,00 | 0 | -100,00 |
Other Listings
| US:OVID | 1,91 $ |