Grundlæggende statistik
| Institutionelle aktier (lange) | 15.581.573 - 45,62% (ex 13D/G) - change of 0,63MM shares 4,22% MRQ |
| Institutionel værdi (lang) | $ 119.626 USD ($1000) |
Institutionelt ejerskab og aktionærer
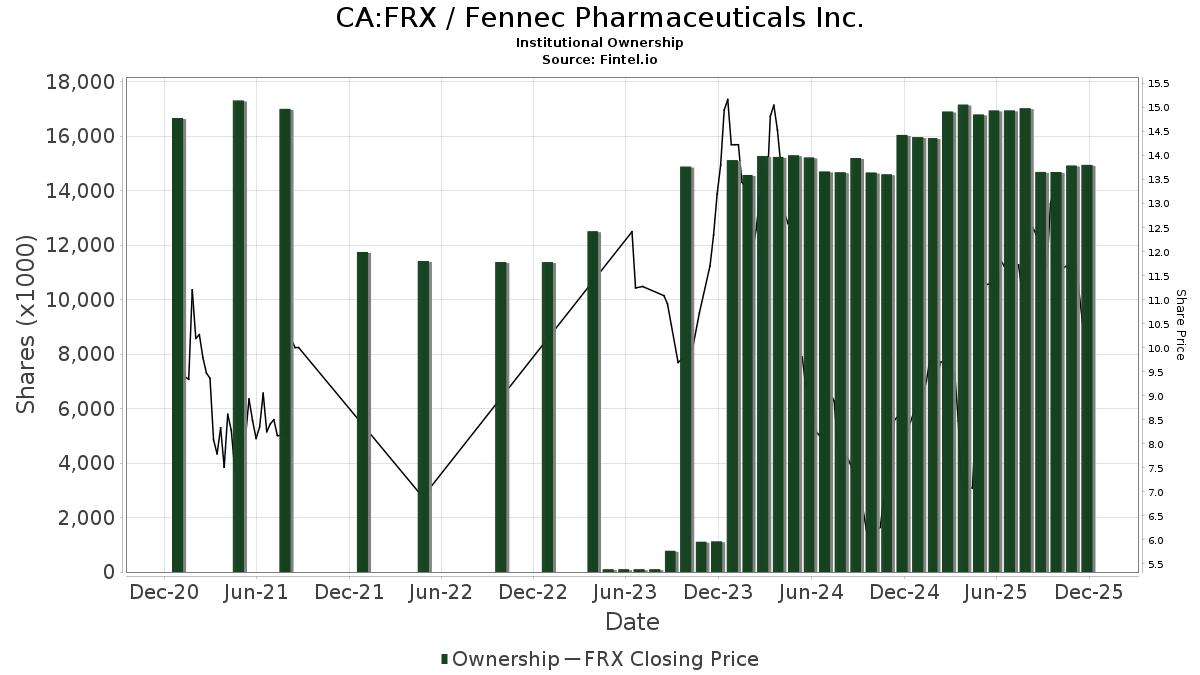
Fennec Pharmaceuticals Inc. (CA:FRX) har 108 institutionelle ejere og aktionærer, der har indsendt 13D/G- eller 13F-formularer til Securities Exchange Commission (SEC). Disse institutioner har i alt 15,581,573 aktier. Største aktionærer omfatter Southpoint Capital Advisors LP, Rosalind Advisors, Inc., Solas Capital Management, LLC, AIGH Capital Management LLC, BlackRock, Inc., Vanguard Group Inc, AWM Investment Company, Inc., State Street Corp, Geode Capital Management, Llc, and Morgan Stanley .
Fennec Pharmaceuticals Inc. (TSX:FRX) institutionel ejerskabsstruktur viser aktuelle positioner i virksomheden efter institutioner og fonde, samt seneste ændringer i positionsstørrelse. Større aktionærer kan omfatte individuelle investorer, investeringsforeninger, hedgefonde eller institutioner. Skema 13D angiver, at investoren besidder (eller besidder) mere end 5 % af virksomheden og har til hensigt (eller har til hensigt at) aktivt at forfølge en ændring i forretningsstrategi. Skema 13G indikerer en passiv investering på over 5%.
The share price as of March 5, 2026 is 11,42 / share. Previously, on March 7, 2025, the share price was 9,82 / share. This represents an increase of 16,29% over that period.
Fondens stemningsscore
Fund Sentiment Score (fka Ownership Accumulation Score) finder de aktier, der bliver mest købt af fonde. Det er resultatet af en sofistikeret, multi-faktor kvantitativ model, der identificerer virksomheder med de højeste niveauer af institutionel akkumulering. Scoringsmodellen bruger en kombination af den samlede stigning i oplyste ejere, ændringerne i porteføljeallokeringer i disse ejere og andre målinger. Tallet går fra 0 til 100, hvor højere tal indikerer et højere niveau af akkumulering for sine jævnaldrende, og 50 er gennemsnittet.
Opdateringsfrekvens: Dagligt
Se Ownership Explorer, som giver en liste over højest rangerende virksomheder.
AI+ Ask Fintel’s AI assistant about Fennec Pharmaceuticals Inc..
Select a question to share a public post with an AI-crafted answer.
Thinking of good questions…
13F og NPORT arkivering
Detaljer om 13F-arkivering er gratis. Detaljer om NP-ansøgninger kræver et premium-medlemskab. Grønne rækker angiver nye positioner. Røde rækker angiver lukkede positioner. Klik på linket ikon for at se den fulde transaktionshistorik.
Opgrader
for at låse premium-data op og eksportere til Excel ![]() .
.
| Fil dato | Kilde | Investor | Type | Gennemsnitlig pris (Øst) |
Aktier | Δ Aktier (%) |
Rapporteret Værdi ($1000) |
Δ Værdi (%) |
Port Alloc (%) |
|
|---|---|---|---|---|---|---|---|---|---|---|
| 2026-02-10 | 13F | Acadian Asset Management Llc | 27.059 | 152,70 | 0 | |||||
| 2026-02-17 | 13F | Price T Rowe Associates Inc /md/ | 12.504 | 0,00 | 0 | |||||
| 2025-09-26 | NP | UAPIX - Ultrasmall-cap Profund Investor Class | 260 | 6,56 | 2 | 100,00 | ||||
| 2026-02-17 | 13F | Southpoint Capital Advisors LP | 2.744.741 | -32,68 | 21.135 | -44,62 | ||||
| 2026-02-02 | 13F | Fifth Third Bancorp | 0 | -100,00 | 0 | -100,00 | ||||
| 2026-02-05 | 13F | Amalgamated Bank | 736 | -10,35 | 0 | |||||
| 2025-11-14 | 13F | Sherbrooke Park Advisers Llc | 0 | -100,00 | 0 | |||||
| 2026-02-13 | 13F | Charles Schwab Investment Management Inc | 57.249 | 0,00 | 441 | -17,76 | ||||
| 2025-09-29 | NP | SUNAMERICA SERIES TRUST - SA Small Cap Index Portfolio Class 1 | 2.693 | -0,30 | 22 | 37,50 | ||||
| 2026-02-12 | 13F | Nuveen, LLC | 26.006 | 0,00 | 200 | -17,70 | ||||
| 2026-02-12 | 13F | Jane Street Group, Llc | 24.044 | -66,90 | 185 | -72,75 | ||||
| 2026-02-12 | 13F | Renaissance Technologies Llc | 20.000 | 88,68 | 154 | 55,56 | ||||
| 2025-09-24 | NP | PJARX - SmallCap Value Fund II R-3 | 1.014 | -14,36 | 8 | 14,29 | ||||
| 2026-02-10 | 13F | State of Wyoming | 309 | 2,32 | 2 | 0,00 | ||||
| 2026-02-17 | 13F | Solas Capital Management, LLC | 2.560.726 | 17,04 | 19.718 | -3,72 | ||||
| 2026-02-10 | 13F | 1492 Capital Management LLC | 28.092 | 216 | ||||||
| 2026-02-17 | 13F | State Of Wisconsin Investment Board | 51.000 | 58,88 | 393 | 30,67 | ||||
| 2026-02-13 | 13F | SRS Capital Advisors, Inc. | 0 | -100,00 | 0 | |||||
| 2025-11-14 | 13F | EAM Investors, LLC | 0 | -100,00 | 0 | |||||
| 2026-02-17 | 13F | Advisor Group Holdings, Inc. | 75 | -20,21 | 1 | |||||
| 2026-02-17 | 13F | Royal Bank Of Canada | 2.467 | 122,05 | 19 | 90,00 | ||||
| 2025-09-26 | NP | SLPIX - Small-cap Profund Investor Class | 21 | -8,70 | 0 | |||||
| 2026-02-17 | 13F | Bank Of America Corp /de/ | 22.533 | 67,62 | 174 | 38,40 | ||||
| 2025-09-26 | NP | SUNAMERICA SERIES TRUST - SA Legg Mason Tactical Opportunities Portfolio Class 1 | 543 | 0,00 | 4 | 33,33 | ||||
| 2026-02-17 | 13F | XTX Topco Ltd | 26.786 | 26,07 | 206 | 4,04 | ||||
| 2026-02-06 | 13F | HighTower Advisors, LLC | 15.000 | 0,00 | 116 | -17,86 | ||||
| 2026-02-17 | 13F | Tower Research Capital LLC (TRC) | 1.384 | -14,78 | 11 | -33,33 | ||||
| 2026-02-11 | 13F | Franklin Resources Inc | 0 | -100,00 | 0 | |||||
| 2026-02-13 | 13F | Sterling Capital Management LLC | 1.030 | -14,02 | 8 | -36,36 | ||||
| 2026-01-23 | 13F | State of Alaska, Department of Revenue | 1.570 | 0 | ||||||
| 2026-02-12 | 13F | CIBC Private Wealth Group, LLC | 1.565 | 0,00 | 12 | -14,29 | ||||
| 2026-02-11 | 13F | Jpmorgan Chase & Co | 9.771 | -0,56 | 75 | -17,58 | ||||
| 2026-02-13 | 13F | Stonepine Capital Management, LLC | 50.000 | 385 | ||||||
| 2026-02-13 | 13F | Citigroup Inc | 530 | -34,65 | 4 | -42,86 | ||||
| 2026-01-05 | 13F | GAMMA Investing LLC | 113 | 0,00 | 1 | -100,00 | ||||
| 2026-02-17 | 13F | Aqr Capital Management Llc | 15.139 | 0,85 | 117 | -17,14 | ||||
| 2026-02-06 | 13F | Pnc Financial Services Group, Inc. | 637 | -34,19 | 5 | -55,56 | ||||
| 2025-11-14 | 13F | Hrt Financial Lp | 0 | -100,00 | 0 | |||||
| 2026-02-17 | 13F | Point72 Asset Management, L.P. | 21.298 | 164 | ||||||
| 2025-09-17 | NP | GMRAX - Nationwide Small Cap Index Fund Class A | 1.717 | 0,00 | 14 | 40,00 | ||||
| 2026-02-17 | 13F | MIRAE ASSET GLOBAL ETFS HOLDINGS Ltd. | 10.873 | -0,18 | 84 | -17,82 | ||||
| 2026-01-29 | 13F | Vanguard Group Inc | 1.067.651 | 11,71 | 8.221 | -8,11 | ||||
| 2025-09-24 | NP | BLACKROCK FUNDS - iShares Russell Small/Mid-Cap Index Fund Investor A | 2.977 | 95,73 | 24 | 166,67 | ||||
| 2026-02-13 | 13F | Smartleaf Asset Management LLC | 110 | 0,00 | 1 | |||||
| 2026-02-12 | 13F | BlackRock, Inc. | 1.234.277 | 1,85 | 9.504 | -16,21 | ||||
| 2026-01-07 | 13F | Massmutual Trust Co Fsb/adv | 357 | 0,00 | 3 | -33,33 | ||||
| 2026-02-12 | 13F | Rosalind Advisors, Inc. | 2.613.508 | 25,84 | 20.124 | 3,52 | ||||
| 2026-02-13 | 13F | Barclays Plc | 36.597 | 10,77 | 282 | -9,06 | ||||
| 2026-02-12 | 13F | New York State Common Retirement Fund | 9.753 | 0,00 | 75 | -17,58 | ||||
| 2026-02-13 | 13F | Morgan Stanley | 242.476 | 4,33 | 1.867 | -14,16 | ||||
| 2026-02-17 | 13F | Northern Trust Corp | 112.092 | -14,14 | 863 | -29,32 | ||||
| 2026-02-13 | 13F | Pinnacle Wealth Planning Services, Inc. | 507 | 4 | ||||||
| 2026-01-28 | 13F | Quaker Wealth Management, LLC | 160 | 1 | ||||||
| 2026-01-23 | 13F | Private Wealth Management Group, LLC | 247 | 0,00 | 2 | -50,00 | ||||
| 2026-02-13 | 13F | Marshall Wace, Llp | 127.693 | 983 | ||||||
| 2026-02-13 | 13F | Rhumbline Advisers | 29.038 | -13,38 | 224 | -28,75 | ||||
| 2026-02-17 | 13F | Lion Point Capital, LP | 112.434 | -8,59 | 866 | -24,85 | ||||
| 2026-02-11 | 13F | Ameritas Investment Partners, Inc. | 1.499 | 12 | ||||||
| 2026-02-03 | 13F | SBI Securities Co., Ltd. | 0 | -100,00 | 0 | |||||
| 2026-02-17 | 13F | Citadel Advisors Llc | 199.749 | 85,82 | 1.538 | 52,88 | ||||
| 2026-02-09 | 13F | Legal & General Group Plc | 8.128 | 0,00 | 63 | -17,33 | ||||
| 2026-02-10 | 13F | Hillsdale Investment Management Inc. | 44.000 | 339 | ||||||
| 2026-01-21 | 13F | Hartford Financial Management Inc. | 50.646 | 0,00 | 390 | -17,93 | ||||
| 2025-09-29 | NP | RSSL - Global X Russell 2000 ETF | 11.933 | -15,98 | 98 | 14,12 | ||||
| 2026-02-13 | 13F | AWM Investment Company, Inc. | 711.869 | 5.481 | ||||||
| 2026-02-11 | 13F | Simplex Trading, Llc | 0 | -100,00 | 0 | |||||
| 2026-02-13 | 13F | Police & Firemen's Retirement System of New Jersey | 6.250 | 0,00 | 48 | -17,24 | ||||
| 2026-02-17 | 13F | Russell Investments Group, Ltd. | 2.924 | -20,41 | 23 | -35,29 | ||||
| 2026-02-11 | 13F | Potomac Capital Management, Inc. | 95.100 | 732 | ||||||
| 2026-02-13 | 13F | Wells Fargo & Company/mn | 26.159 | 53,74 | 201 | 26,42 | ||||
| 2026-01-26 | 13F | Cwm, Llc | 750 | -7,52 | 0 | |||||
| 2026-01-29 | 13F | UBS Group AG | 4.995 | -63,57 | 38 | -70,31 | ||||
| 2026-02-02 | 13F | Strs Ohio | 5.200 | 0,00 | 40 | -16,67 | ||||
| 2026-02-20 | 13F | Sunbelt Securities, Inc. | 7 | 0,00 | 0 | |||||
| 2025-09-26 | NP | FSSNX - Fidelity Small Cap Index Fund This fund is a listed as child fund of Fmr Llc and if that institution has disclosed ownership in this security, then these positions will not be double counted when calculating total shares and total value | 233.626 | -3,68 | 1.911 | 30,53 | ||||
| 2026-02-17 | 13F | Tang Capital Management Llc | 0 | -100,00 | 0 | -100,00 | ||||
| 2026-02-11 | 13F | Deutsche Bank Ag\ | 17.365 | 134 | ||||||
| 2025-09-24 | NP | SWSSX - Schwab Small-Cap Index Fund This fund is a listed as child fund of Charles Schwab Investment Management Inc and if that institution has disclosed ownership in this security, then these positions will not be double counted when calculating total shares and total value | 61.287 | 0,23 | 501 | 35,77 | ||||
| 2025-09-26 | NP | TISBX - TIAA-CREF Small-Cap Blend Index Fund Institutional Class | 24.461 | 0,00 | 200 | 36,05 | ||||
| 2026-02-13 | 13F | Ubs Asset Management Americas Inc | 303 | 2 | ||||||
| 2026-02-09 | 13F | Geode Capital Management, Llc | 297.100 | -1,22 | 2.288 | -18,76 | ||||
| 2026-02-10 | 13F | Goldman Sachs Group Inc | 43.589 | 64,55 | 336 | 35,63 | ||||
| 2026-02-12 | 13F | Harbert Fund Advisors, Inc. | 0 | -100,00 | 0 | -100,00 | ||||
| 2026-02-17 | 13F | Susquehanna International Group, Llp | 0 | -100,00 | 0 | |||||
| 2026-02-06 | 13F | EverSource Wealth Advisors, LLC | 135 | 0,00 | 1 | 0,00 | ||||
| 2026-02-12 | 13F | Federated Hermes, Inc. | 2.916 | 0,00 | 22 | -18,52 | ||||
| 2026-02-17 | 13F | Quadrature Capital Ltd | 14.761 | -3,66 | 114 | -20,98 | ||||
| 2026-01-08 | 13F | True Wealth Design, LLC | 1 | 0 | ||||||
| 2026-02-12 | 13F | Federation des caisses Desjardins du Quebec | 6 | 0,00 | 0 | |||||
| 2026-02-17 | 13F | Bridgeway Capital Management Inc | 83.005 | 170,37 | 639 | 122,65 | ||||
| 2026-02-17 | 13F | Fmr Llc | 2.423 | -11,05 | 19 | -28,00 | ||||
| 2026-02-10 | 13F | Bnp Paribas Arbitrage, Sa | 5.051 | 12,05 | 39 | -9,52 | ||||
| 2026-02-17 | 13F | Millennium Management Llc | 24.402 | 102,05 | 188 | 65,49 | ||||
| 2025-09-24 | NP | PPNMX - SmallCap Growth Fund I R-3 | 449 | -20,67 | 4 | 0,00 | ||||
| 2026-02-13 | 13F | Gendell Jeffrey L | 139.559 | 0,00 | 1.075 | -17,76 | ||||
| 2026-02-17 | 13F | Jones Financial Companies Lllp | 24.952 | 165,45 | 192 | 128,57 | ||||
| 2026-01-23 | 13F | Optima Capital Llc | 63 | 0 | ||||||
| 2026-02-02 | 13F | AIGH Capital Management LLC | 1.581.501 | 132,06 | 12.178 | 90,92 | ||||
| 2026-02-17 | 13F | Trexquant Investment LP | 51.380 | 396 | ||||||
| 2026-02-17 | 13F | Two Sigma Advisers, Lp | 13.000 | 100 | ||||||
| 2026-02-10 | 13F | Bank of New York Mellon Corp | 49.219 | -5,85 | 379 | -22,70 | ||||
| 2026-02-17 | 13F | California State Teachers Retirement System | 1.441 | -15,19 | 11 | -26,67 | ||||
| 2026-01-27 | 13F | TD Waterhouse Canada Inc. | 29 | 0,00 | 0 | |||||
| 2025-11-14 | 13F | Manatuck Hill Partners, LLC | 0 | -100,00 | 0 | |||||
| 2026-02-17 | 13F | Apis Capital Advisors, LLC | 204.000 | 1.571 | ||||||
| 2026-02-10 | 13F | Intech Investment Management Llc | 10.452 | -8,19 | 80 | -24,53 | ||||
| 2026-02-11 | 13F | Hughes Financial Services, LLC | 97 | -10,19 | 1 | |||||
| 2026-02-13 | 13F | Arrowstreet Capital, Limited Partnership | 32.460 | 19,98 | 250 | -1,58 | ||||
| 2026-02-17 | 13F | Lazard Asset Management Llc | 13.121 | 101 | ||||||
| 2026-02-12 | 13F | MetLife Investment Management, LLC | 13.019 | 35,71 | 100 | 12,36 | ||||
| 2026-02-19 | 13F | Invesco Ltd. | 14.328 | 18,15 | 110 | -2,65 | ||||
| 2026-02-13 | 13F | Squarepoint Ops LLC | 13.109 | 101 | ||||||
| 2026-02-13 | 13F | National Bank Of Canada /fi/ | 97 | -47,85 | 1 | -100,00 | ||||
| 2026-02-17 | 13F | Alliancebernstein L.p. | 10.310 | 0,00 | 79 | -17,71 | ||||
| 2026-02-17 | 13F | Qube Research & Technologies Ltd | 44.692 | 344 | ||||||
| 2026-01-23 | 13F | Farther Finance Advisors, LLC | 274 | 0,00 | 2 | 0,00 | ||||
| 2026-02-02 | 13F | Cornerstone Planning Group LLC | 88 | 0,00 | 1 | |||||
| 2026-02-11 | 13F | Simplex Trading, Llc | Call | 100 | -90,00 | 1 | ||||
| 2026-02-13 | 13F | State Street Corp | 352.775 | 3,39 | 2.716 | -14,94 | ||||
| 2025-12-02 | 13F | IFP Advisors, Inc | 0 | 0 | ||||||
| 2026-01-15 | 13F | Nisa Investment Advisors, Llc | 46 | 0,00 | 0 |