Grundlæggende statistik
| Institutionelle ejere | 120 total, 106 long only, 1 short only, 13 long/short - change of -27,27% MRQ |
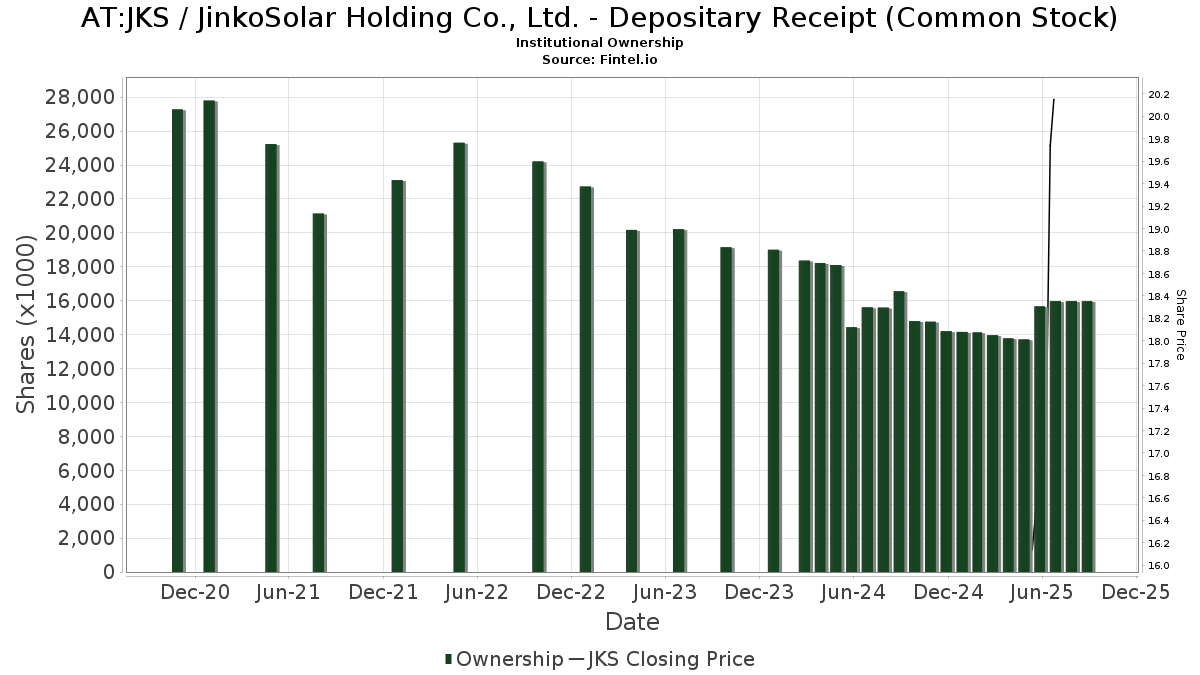
| Del pris | 18,54 |
| Gennemsnitlig porteføljeallokering | 0.0408 % - change of -73,84% MRQ |
| Institutionelle aktier (lange) | 15.465.598 (ex 13D/G) - change of -0,41MM shares -2,61% MRQ |
| Institutionel værdi (lang) | $ 374.104 USD ($1000) |
Institutionelt ejerskab og aktionærer
JinkoSolar Holding Co., Ltd. - Depositary Receipt (Common Stock) (AT:JKS) har 120 institutionelle ejere og aktionærer, der har indsendt 13D/G- eller 13F-formularer til Securities Exchange Commission (SEC). Disse institutioner har i alt 15,465,598 aktier. Største aktionærer omfatter Invesco Ltd., BlackRock, Inc., Mackenzie Financial Corp, Vanguard Group Inc, Morgan Stanley, Dimensional Fund Advisors Lp, Greenwoods Asset Management Hong Kong Ltd., Acadian Asset Management Llc, State Street Corp, and UBS Group AG .
JinkoSolar Holding Co., Ltd. - Depositary Receipt (Common Stock) (WBAG:JKS) institutionel ejerskabsstruktur viser aktuelle positioner i virksomheden efter institutioner og fonde, samt seneste ændringer i positionsstørrelse. Større aktionærer kan omfatte individuelle investorer, investeringsforeninger, hedgefonde eller institutioner. Skema 13D angiver, at investoren besidder (eller besidder) mere end 5 % af virksomheden og har til hensigt (eller har til hensigt at) aktivt at forfølge en ændring i forretningsstrategi. Skema 13G indikerer en passiv investering på over 5%.
The share price as of April 17, 2026 is 18,54 / share. Previously, on May 9, 2025, the share price was 16,64 / share. This represents an increase of 11,42% over that period.
Fondens stemningsscore
Fund Sentiment Score (fka Ownership Accumulation Score) finder de aktier, der bliver mest købt af fonde. Det er resultatet af en sofistikeret, multi-faktor kvantitativ model, der identificerer virksomheder med de højeste niveauer af institutionel akkumulering. Scoringsmodellen bruger en kombination af den samlede stigning i oplyste ejere, ændringerne i porteføljeallokeringer i disse ejere og andre målinger. Tallet går fra 0 til 100, hvor højere tal indikerer et højere niveau af akkumulering for sine jævnaldrende, og 50 er gennemsnittet.
Opdateringsfrekvens: Dagligt
Se Ownership Explorer, som giver en liste over højest rangerende virksomheder.
AI+ Ask Fintel’s AI assistant about JinkoSolar Holding Co., Ltd. - Depositary Receipt (Common Stock).
Select a question to share a public post with an AI-crafted answer.
Thinking of good questions…
13F og NPORT arkivering
Detaljer om 13F-arkivering er gratis. Detaljer om NP-ansøgninger kræver et premium-medlemskab. Grønne rækker angiver nye positioner. Røde rækker angiver lukkede positioner. Klik på linket ikon for at se den fulde transaktionshistorik.
Opgrader
for at låse premium-data op og eksportere til Excel ![]() .
.
| Fil dato | Kilde | Investor | Type | Gennemsnitlig pris (Øst) |
Aktier | Δ Aktier (%) |
Rapporteret Værdi ($1000) |
Δ Værdi (%) |
Port Alloc (%) |
|
|---|---|---|---|---|---|---|---|---|---|---|
| 2026-02-03 | 13F | Strengthening Families & Communities, LLC | 116 | 0,00 | 3 | 0,00 | ||||
| 2026-02-12 | 13F | Dimensional Fund Advisors Lp | 841.899 | -1,30 | 21.739 | 6,07 | ||||
| 2026-01-29 | 13F | UMA Financial Services, Inc. | 19 | 0 | ||||||
| 2025-11-14 | 13F | Virtu Financial LLC | 0 | -100,00 | 0 | |||||
| 2026-02-11 | 13F | Janney Montgomery Scott LLC | 8.115 | 0 | ||||||
| 2025-11-17 | 13F | Great West Life Assurance Co /can/ | 0 | -100,00 | 0 | |||||
| 2026-02-17 | 13F | Millennium Management Llc | 9.840 | -86,61 | 254 | -85,67 | ||||
| 2026-02-06 | 13F | Greenwoods Asset Management Hong Kong Ltd. | 780.933 | 0,00 | 20.156 | 7,41 | ||||
| 2026-02-06 | 13F | Maj Invest Holding A/S | 3.200 | 0,00 | 0 | |||||
| 2026-02-06 | 13F | EverSource Wealth Advisors, LLC | 10 | 0,00 | 0 | |||||
| 2026-02-18 | 13F | GWM Advisors LLC | 500 | 0,00 | 13 | 0,00 | ||||
| 2026-02-12 | 13F | Nuveen, LLC | 28.100 | 0,00 | 725 | 7,41 | ||||
| 2026-02-10 | 13F | Bnp Paribas Arbitrage, Sa | 5.345 | -90,70 | 138 | -90,08 | ||||
| 2026-02-10 | 13F | Goldman Sachs Group Inc | 297.503 | -4,65 | 7.679 | 2,41 | ||||
| 2026-02-10 | 13F | Ritter Daniher Financial Advisory LLC / DE | 1.028 | 27 | ||||||
| 2025-11-14 | 13F | CoreCommodity Management, LLC | 0 | -100,00 | 0 | -100,00 | ||||
| 2026-02-13 | 13F | Walleye Trading LLC | Put | 5.100 | 24,39 | 132 | 33,67 | |||
| 2025-11-05 | 13F | Evermay Wealth Management Llc | 0 | -100,00 | 0 | |||||
| 2026-02-13 | 13F | Walleye Trading LLC | Call | 2.600 | -64,86 | 67 | -62,15 | |||
| 2025-11-14 | 13F | S&t Bank/pa | 0 | -100,00 | 0 | |||||
| 2026-01-26 | 13F | Mirae Asset Global Investments Co., Ltd. | 1.079 | -3,14 | 28 | 3,85 | ||||
| 2026-02-13 | 13F | Walleye Trading LLC | 17.831 | 1.146,05 | 460 | 1.252,94 | ||||
| 2026-02-06 | 13F | Pnc Financial Services Group, Inc. | 0 | -100,00 | 0 | |||||
| 2026-02-10 | 13F | Daiwa Securities Group Inc. | 17.600 | 18,12 | 0 | |||||
| 2026-02-17 | 13F | Russell Investments Group, Ltd. | 8.171 | 215 | ||||||
| 2025-11-14 | 13F | Jain Global LLC | 0 | -100,00 | 0 | |||||
| 2026-01-29 | 13F | IMC-Chicago, LLC | 29.953 | 144,97 | 773 | 163,82 | ||||
| 2026-02-17 | 13F | Jump Financial, LLC | 83.697 | 2.160 | ||||||
| 2026-01-29 | 13F | IMC-Chicago, LLC | Put | 79.300 | 158,31 | 2.047 | 177,61 | |||
| 2026-01-29 | 13F | IMC-Chicago, LLC | Call | 39.700 | 34,58 | 1.025 | 44,63 | |||
| 2026-04-15 | 13F | FNY Investment Advisers, LLC | 0 | -100,00 | 0 | |||||
| 2026-02-13 | 13F | Centiva Capital, LP | 88.654 | 2.288 | ||||||
| 2026-02-18 | 13F | Mackenzie Financial Corp | 1.381.478 | 1,47 | 36.289 | 10,92 | ||||
| 2026-02-17 | 13F | Clear Street Markets Llc | 6.900 | 0,00 | 178 | 7,88 | ||||
| 2026-02-17 | 13F | Public Employees Retirement System Of Ohio | 43.804 | 28,84 | 1.131 | 38,31 | ||||
| 2025-11-13 | 13F | Riggs Asset Managment Co. Inc. | 0 | -100,00 | 0 | |||||
| 2026-02-13 | 13F | Centiva Capital, LP | Put | 250.800 | 6.473 | |||||
| 2026-02-17 | 13F | Himension Fund | 78.358 | 12,98 | 2.022 | 21,37 | ||||
| 2026-02-12 | 13F | Federation des caisses Desjardins du Quebec | 7.086 | 277,92 | 183 | 304,44 | ||||
| 2026-01-16 | 13F | Standard Life Aberdeen plc | 49.500 | -20,76 | 1.278 | -14,64 | ||||
| 2026-02-12 | 13F | New York State Common Retirement Fund | 7.578 | 0,00 | 196 | 7,14 | ||||
| 2025-11-12 | 13F | Stifel Financial Corp | 0 | -100,00 | 0 | |||||
| 2026-02-12 | 13F | Quadrant Capital Group Llc | 217 | 6 | ||||||
| 2026-01-29 | 13F | UBS Group AG | Call | 58.232 | -83,68 | 1.503 | -82,49 | |||
| 2026-02-06 | 13F | Larson Financial Group LLC | 52 | -75,93 | 1 | -80,00 | ||||
| 2026-02-17 | 13F | Toronto Dominion Bank | 0 | -100,00 | 0 | |||||
| 2026-01-29 | 13F | UBS Group AG | 602.744 | -29,99 | 15.557 | -24,81 | ||||
| 2026-02-12 | 13F | Hrt Financial Lp | 110.000 | 3 | ||||||
| 2026-02-17 | 13F | Lloyd Harbor Capital Management, LLC | 336.877 | -50,23 | 8.695 | -46,55 | ||||
| 2026-02-13 | 13F | State Street Corp | 735.159 | 8,03 | 18.978 | 16,05 | ||||
| 2026-02-13 | 13F | Squarepoint Ops LLC | Put | 10.200 | 0,00 | 263 | 7,35 | |||
| 2026-02-06 | 13F | GPS Wealth Strategies Group, LLC | 0 | -100,00 | 0 | |||||
| 2026-02-10 | 13F | Bank of New York Mellon Corp | 0 | -100,00 | 0 | |||||
| 2026-02-17 | 13F | MIRAE ASSET GLOBAL ETFS HOLDINGS Ltd. | 347.661 | 2.226,89 | 9.143 | 2.446,80 | ||||
| 2026-01-29 | 13F | Vanguard Group Inc | 1.266.726 | 0,97 | 32.694 | 8,45 | ||||
| 2026-02-06 | 13F | Profund Advisors Llc | 0 | -100,00 | 0 | |||||
| 2026-02-17 | 13F | Progeny 3, Inc. | 119.000 | 22,18 | 3.071 | 31,24 | ||||
| 2026-02-11 | 13F | LPL Financial LLC | 40.550 | 1.047 | ||||||
| 2026-02-10 | 13F | CIBC World Markets Inc. | 13.087 | 338 | ||||||
| 2026-02-17 | 13F | Parallax Volatility Advisers, L.P. | Put | 375.000 | 0,00 | 9.679 | 7,40 | |||
| 2026-02-13 | 13F | Macquarie Group Ltd | 0 | -100,00 | 0 | |||||
| 2026-02-17 | 13F | Parallax Volatility Advisers, L.P. | 16.201 | -53,87 | 418 | -50,42 | ||||
| 2026-02-11 | 13F | Krane Funds Advisors LLC | 18.886 | -12,54 | 487 | -2,40 | ||||
| 2026-02-17 | 13F | Susquehanna International Group, Llp | 91.129 | -29,14 | 2.352 | -23,88 | ||||
| 2026-02-17 | 13F | Susquehanna International Group, Llp | Put | 191.900 | -36,48 | 4.953 | -31,78 | |||
| 2026-02-02 | 13F | Hussman Strategic Advisors, Inc. | 0 | -100,00 | 0 | -100,00 | ||||
| 2026-02-17 | 13F | Two Sigma Advisers, Lp | 217.147 | 206,50 | 5.605 | 229,26 | ||||
| 2026-02-17 | 13F | Advisory Services Network, LLC | 0 | -100,00 | 0 | |||||
| 2026-02-17 | 13F | Signature Equity Partners, LLC | 72 | 2 | ||||||
| 2026-02-17 | 13F | Susquehanna International Group, Llp | Call | 319.200 | 193,65 | 8.239 | 215,39 | |||
| 2026-02-17 | 13F | Susquehanna Portfolio Strategies, LLC | 129.653 | 0,00 | 3.346 | 7,42 | ||||
| 2026-02-13 | 13F | Smartleaf Asset Management LLC | 14 | 0 | ||||||
| 2025-11-14 | 13F | Wolverine Trading, Llc | 13.876 | 332 | ||||||
| 2025-11-14 | 13F | Wolverine Trading, Llc | Call | 9.500 | 228 | |||||
| 2025-11-14 | 13F | Wolverine Trading, Llc | Put | 23.500 | 563 | |||||
| 2026-02-05 | 13F | Allworth Financial LP | 57 | 54,05 | 1 | |||||
| 2026-02-17 | 13F | Citadel Advisors Llc | Put | 42.100 | -7,47 | 1.087 | -0,64 | |||
| 2026-02-13 | 13F | Sei Investments Co | 21.955 | 0,50 | 567 | 8,02 | ||||
| 2026-03-30 | 13F/A | Barclays Plc | Call | 0 | -100,00 | 0 | -100,00 | |||
| 2025-11-14 | 13F | Raymond James Financial Inc | 0 | -100,00 | 0 | -100,00 | ||||
| 2026-02-17 | 13F | Tower Research Capital LLC (TRC) | 1.563 | 567,95 | 40 | 700,00 | ||||
| 2026-02-17 | 13F | Numerai GP LLC | 0 | -100,00 | 0 | |||||
| 2026-01-22 | 13F/A | Cresset Asset Management, LLC | 0 | -100,00 | 0 | |||||
| 2026-02-10 | 13F | Quantbot Technologies LP | 100 | 3 | ||||||
| 2026-02-12 | 13F | Jane Street Group, Llc | 14.762 | -83,25 | 381 | -82,01 | ||||
| 2026-02-17 | 13F | Dv Equities, Llc | 200 | 5 | ||||||
| 2025-11-14 | 13F | Squarepoint Ops LLC | 0 | -100,00 | 0 | -100,00 | ||||
| 2026-02-13 | 13F | Pathstone Holdings, LLC | 22.968 | -0,16 | 593 | 7,25 | ||||
| 2026-02-12 | 13F | Jane Street Group, Llc | Put | 69.600 | 5,30 | 1.796 | 13,10 | |||
| 2026-02-12 | 13F | Jane Street Group, Llc | Call | 36.300 | 15,24 | 937 | 23,81 | |||
| 2026-02-17 | 13F | Fmr Llc | 15.549 | 401 | ||||||
| 2026-02-17 | 13F | Northern Trust Corp | 71.614 | 4,70 | 1.848 | 12,48 | ||||
| 2025-11-14 | 13F | Parallax Volatility Advisers, L.P. | Call | 0 | -100,00 | 0 | -100,00 | |||
| 2026-02-12 | 13F | Principal Securities, Inc. | 0 | -100,00 | 0 | -100,00 | ||||
| 2026-02-03 | 13F | SBI Securities Co., Ltd. | 4.609 | -3,76 | 119 | 2,61 | ||||
| 2025-11-14 | 13F | Tudor Investment Corp Et Al | Call | 0 | -100,00 | 0 | ||||
| 2026-02-13 | 13F | Barclays Plc | Put | 180.000 | 4.646 | |||||
| 2026-02-17 | 13F | Balyasny Asset Management Llc | 28.020 | -28,91 | 723 | -23,65 | ||||
| 2026-02-19 | 13F | Invesco Ltd. | 1.604.250 | 15,39 | 41.406 | 23,93 | ||||
| 2026-04-16 | 13F | SG Americas Securities, LLC | 104.036 | -46,44 | 3 | -60,00 | ||||
| 2026-02-11 | 13F | Group One Trading, L.p. | Put | 16.100 | -60,34 | 416 | -57,44 | |||
| 2026-02-10 | 13F | Nomura Asset Management Co Ltd | 2.600 | 0,00 | 67 | 8,06 | ||||
| 2026-04-17 | 13F | CENTRAL TRUST Co | 387 | 0,00 | 10 | 0,00 | ||||
| 2026-02-11 | 13F | Group One Trading, L.p. | Call | 229.400 | -7,24 | 5.921 | -0,37 | |||
| 2026-02-12 | 13F | Renaissance Technologies Llc | 41.900 | 146,47 | 1.081 | 164,95 | ||||
| 2026-02-11 | 13F | Group One Trading, L.p. | 8.288 | -57,96 | 214 | -54,97 | ||||
| 2026-02-13 | 13F | MAI Capital Management | 38 | 0,00 | 1 | |||||
| 2026-01-29 | 13F | Cornerstone Investment Partners, LLC | 7.940 | 205 | ||||||
| 2025-11-14 | 13F | Skopos Labs, Inc. | 0 | -100,00 | 0 | |||||
| 2026-02-17 | 13F | Citadel Advisors Llc | Call | 128.800 | 10,94 | 3.324 | 19,18 | |||
| 2026-02-13 | 13F | SPX Equities Gestao de Recursos Ltda | 0 | -100,00 | 0 | |||||
| 2026-02-17 | 13F | Atom Investors LP | 0 | -100,00 | 0 | |||||
| 2026-01-23 | 13F | Assetmark, Inc | 10 | 0,00 | 0 | |||||
| 2025-11-07 | 13F | Shell Asset Management Co | 902 | -66,72 | 0 | |||||
| 2026-04-07 | 13F | Signaturefd, Llc | 843 | -3,21 | 21 | -4,55 | ||||
| 2026-02-13 | 13F | Charles Schwab Investment Management Inc | 414.228 | 35,60 | 10.691 | 45,65 | ||||
| 2026-02-10 | 13F | Commonwealth Of Pennsylvania Public School Empls Retrmt Sys | 20.193 | -18,50 | 521 | -12,44 | ||||
| 2026-02-13 | 13F | Verition Fund Management LLC | 0 | -100,00 | 0 | |||||
| 2026-01-27 | 13F | Zurcher Kantonalbank (Zurich Cantonalbank) | 683 | 11,06 | 18 | 21,43 | ||||
| 2026-02-09 | 13F | MTM Investment Management, LLC | 1.300 | 0,00 | 34 | 6,45 | ||||
| 2026-02-17 | 13F | Point72 Asset Management, L.P. | 29.033 | 749 | ||||||
| 2026-02-13 | 13F | Wells Fargo & Company/mn | 201 | 0,00 | 5 | 25,00 | ||||
| 2026-01-30 | 13F | Us Bancorp \de\ | 287 | 17,14 | 7 | 40,00 | ||||
| 2026-02-02 | 13F | Sachetta, LLC | 0 | -100,00 | 0 | |||||
| 2026-02-09 | 13F | Legal & General Group Plc | 499.964 | 9.212,05 | 12.904 | 9.903,10 | ||||
| 2026-02-12 | 13F | BRYN MAWR TRUST Co | 25 | 0,00 | 1 | |||||
| 2026-02-17 | 13F | Delaware Management Holdings, Inc. | 7.738 | 200 | ||||||
| 2026-01-30 | 13F | Mitsubishi UFJ Trust & Banking Corp | 83.404 | 72,51 | 2.153 | 85,36 | ||||
| 2026-02-06 | 13F | Harvest Portfolios Group Inc. | 12.799 | -4,66 | 330 | 2,48 | ||||
| 2026-02-03 | 13F | Mitsubishi UFJ Kokusai Asset Management Co., Ltd. | 20.751 | -1,53 | 580 | 14,43 | ||||
| 2026-02-13 | 13F | Ubs Asset Management Americas Inc | 0 | -100,00 | 0 | |||||
| 2026-02-13 | 13F | Barclays Plc | 100.199 | 246,46 | 2.586 | 272,62 | ||||
| 2026-02-13 | 13F | Quarry LP | 0 | -100,00 | 0 | |||||
| 2025-11-14 | 13F | Susquehanna Fundamental Investments, Llc | 0 | -100,00 | 0 | |||||
| 2026-02-12 | 13F | BlackRock, Inc. | 1.542.906 | -1,86 | 39.822 | 5,41 | ||||
| 2026-04-07 | 13F | Farther Finance Advisors, LLC | 536 | 67,50 | 14 | 62,50 | ||||
| 2026-02-11 | 13F | Capital Wealth Planning, LLC | 118.079 | 3.299 | ||||||
| 2026-02-17 | 13F | Trexquant Investment LP | 42.378 | 2,14 | 1.094 | 9,74 | ||||
| 2026-02-10 | 13F | Acadian Asset Management Llc | 758.101 | 65,00 | 20 | 72,73 | ||||
| 2026-02-17 | 13F | Man Group plc | 62.884 | 359,01 | 1.623 | 393,31 | ||||
| 2026-01-15 | 13F | Nisa Investment Advisors, Llc | 39 | 1 | ||||||
| 2026-01-30 | 13F | Bogart Wealth, LLC | 100 | 0,00 | 3 | 0,00 | ||||
| 2026-02-13 | 13F | Police & Firemen's Retirement System of New Jersey | 17.065 | 7,69 | 440 | 15,79 | ||||
| 2026-02-17 | 13F | Bank Of America Corp /de/ | 23.259 | -29,00 | 600 | -23,76 | ||||
| 2026-02-09 | 13F | Geode Capital Management, Llc | 40.566 | 9,23 | 1.047 | 17,38 | ||||
| 2026-02-11 | 13F | Parallel Advisors, LLC | 507 | 27,07 | 13 | 44,44 | ||||
| 2026-02-13 | 13F | Van Eck Associates Corp | 0 | -100,00 | 0 | |||||
| 2026-03-12 | 13F/A | Peak6 Llc | 0 | -100,00 | 0 | -100,00 | ||||
| 2026-02-06 | 13F | Banque Cantonale Vaudoise | 2.240 | 58 | ||||||
| 2026-02-17 | 13F | Royal Bank Of Canada | 3.557 | -2,04 | 92 | 5,75 | ||||
| 2026-02-06 | 13F | Leonteq Securities AG | 3.910 | 537,85 | 101 | 614,29 | ||||
| 2026-02-11 | 13F | Simplex Trading, Llc | Put | 54.300 | -8,89 | 1.401 | 140.000,00 | |||
| 2026-01-27 | 13F | TD Waterhouse Canada Inc. | 4 | 0,00 | 0 | |||||
| 2026-03-06 | 13F | Hsbc Holdings Plc | 41.577 | -25,30 | 1.077 | -18,42 | ||||
| 2025-11-14 | 13F | Eqis Capital Management, Inc. | 0 | -100,00 | 0 | |||||
| 2026-02-11 | 13F | Simplex Trading, Llc | 492 | -96,76 | 13 | |||||
| 2026-02-12 | 13F | Triumph Capital Management | 200 | 0,00 | 5 | 25,00 | ||||
| 2026-02-17 | 13F | DZ BANK AG Deutsche Zentral Genossenschafts Bank, Frankfurt am Main | 6.800 | 294,43 | 187 | 365,00 | ||||
| 2026-02-10 | 13F | Greenwich Wealth Management LLC | 11.025 | -22,30 | 0 | |||||
| 2026-02-11 | 13F | Simplex Trading, Llc | Call | 22.000 | -24,40 | 568 | ||||
| 2026-02-09 | 13F | Jefferies Financial Group Inc. | Call | 125.000 | 3.226 | |||||
| 2026-02-11 | 13F | Jpmorgan Chase & Co | 4.233 | -57,47 | 109 | -54,39 | ||||
| 2026-02-12 | 13F | Groupe la Francaise | 0 | -100,00 | 0 | |||||
| 2026-02-13 | 13F | Commerce Bank | 27.777 | -57,90 | 717 | -54,83 | ||||
| 2026-02-10 | 13F | Envestnet Asset Management Inc | 12.247 | -0,50 | 316 | 7,12 | ||||
| 2026-01-26 | 13F | Quattro Financial Advisors Llc | 13.200 | 341 | ||||||
| 2026-02-17 | 13F | Brevan Howard Capital Management LP | 24.707 | 0,00 | 643 | 8,26 | ||||
| 2026-02-13 | 13F | Citigroup Inc | 26.608 | -3,45 | 687 | 3,63 | ||||
| 2026-02-13 | 13F | Walleye Capital LLC | Call | 6.700 | 173 | |||||
| 2026-02-17 | 13F | Two Sigma Investments, Lp | 333.462 | 1.984,14 | 8.607 | 2.141,15 | ||||
| 2026-02-13 | 13F | Walleye Capital LLC | Put | 1.600 | 41 | |||||
| 2026-02-12 | 13F | California Public Employees Retirement System | 40.272 | -6,36 | 1.039 | 0,58 | ||||
| 2026-02-13 | 13F | Walleye Capital LLC | 31.954 | 825 | ||||||
| 2026-02-17 | 13F | Citadel Advisors Llc | 0 | -100,00 | 0 | |||||
| 2026-02-13 | 13F | Rhumbline Advisers | 562 | -10,08 | 15 | -6,67 | ||||
| 2026-03-12 | 13F/A | Peak6 Llc | Put | 1.000 | 0,00 | 26 | 4,17 | |||
| 2026-02-17 | 13F | Advisor Group Holdings, Inc. | 1.672 | 38,64 | 43 | 53,57 | ||||
| 2026-03-12 | 13F/A | Peak6 Llc | Call | 109.100 | -35,75 | 2.816 | -31,00 | |||
| 2026-02-13 | 13F | Vontobel Holding Ltd. | 14.255 | 0,00 | 368 | 7,31 | ||||
| 2025-11-14 | 13F | Axa S.a. | 0 | -100,00 | 0 | |||||
| 2025-11-14 | 13F | XTX Topco Ltd | 0 | -100,00 | 0 | -100,00 | ||||
| 2026-02-13 | 13F | Morgan Stanley | 1.257.680 | -5,86 | 32.461 | 1,12 | ||||
| 2026-02-13 | 13F | National Bank Of Canada /fi/ | 0 | -100,00 | 0 |