Grundlæggende statistik
| Porteføljeværdi | $ 1.241.075.751 |
| Nuværende stillinger | 53 |
Seneste beholdninger, ydeevne, AUM (fra 13F, 13D)
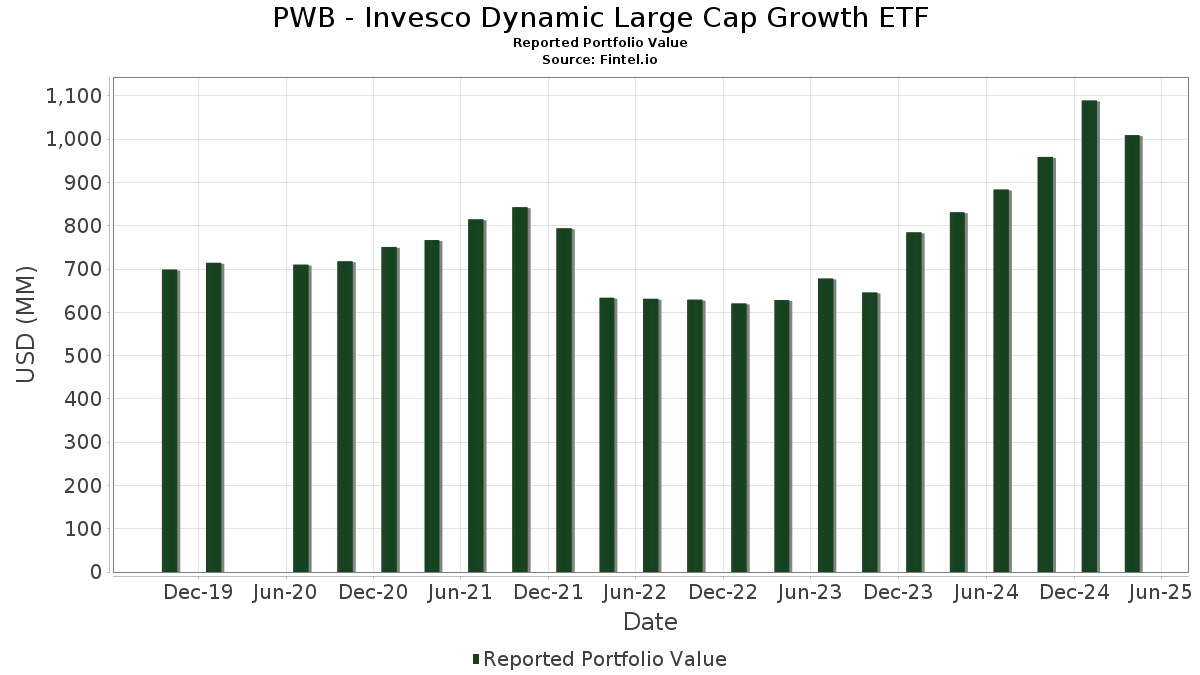
PWB - Invesco Dynamic Large Cap Growth ETF har afsløret 53 samlede besiddelser i deres seneste SEC-arkivering. Den seneste porteføljeværdi er beregnet til at være $ 1.241.075.751 USD. Faktiske aktiver under forvaltning (AUM) er denne værdi plus kontanter (som ikke er oplyst). PWB - Invesco Dynamic Large Cap Growth ETFs største beholdninger er Oracle Corporation (US:ORCL) , NVIDIA Corporation (US:NVDA) , Broadcom Inc. (US:AVGO) , Meta Platforms, Inc. (US:META) , and Microsoft Corporation (US:MSFT) . PWB - Invesco Dynamic Large Cap Growth ETFs nye stillinger omfatter Philip Morris International Inc. (US:PM) , GE Vernova Inc. (US:GEV) , Nasdaq, Inc. (US:NDAQ) , .
Top øger dette kvartal
Vi bruger ændringen i porteføljeallokeringen, fordi dette er den mest meningsfulde metrik. Ændringer kan skyldes handler eller ændringer i aktiekurser.
| Sikkerhed | Aktier (MM) |
Værdi (MM$) |
Portefølje % | ΔPortefølje % |
|---|---|---|---|---|
| PM / Philip Morris International Inc. | 0,21 | 34,67 | 2,8056 | 2,8056 |
| ORCL / Oracle Corporation | 0,23 | 59,37 | 4,8042 | 1,8974 |
| GEV / GE Vernova Inc. | 0,03 | 22,70 | 1,8370 | 1,8370 |
| NDAQ / Nasdaq, Inc. | 0,20 | 18,78 | 1,5198 | 1,5198 |
| ISRG / Intuitive Surgical, Inc. | 0,07 | 33,12 | 2,6802 | 1,3388 |
| ADSK / Autodesk, Inc. | 0,05 | 16,36 | 1,3239 | 1,3239 |
| MCK / McKesson Corporation | 0,02 | 15,61 | 1,2634 | 1,2634 |
| MNST / Monster Beverage Corporation | 0,25 | 14,83 | 1,1998 | 1,1998 |
| NVDA / NVIDIA Corporation | 0,28 | 49,73 | 4,0237 | 1,0291 |
| RBLX / Roblox Corporation | 0,19 | 26,15 | 2,1160 | 0,9751 |
Top falder i dette kvartal
Vi bruger ændringen i porteføljeallokeringen, fordi dette er den mest meningsfulde metrik. Ændringer kan skyldes handler eller ændringer i aktiekurser.
| Sikkerhed | Aktier (MM) |
Værdi (MM$) |
Portefølje % | ΔPortefølje % |
|---|---|---|---|---|
| SPGI / S&P Global Inc. | 0,00 | 0,00 | -1,3989 | |
| TRGP / Targa Resources Corp. | 0,00 | 0,00 | -1,3081 | |
| NFLX / Netflix, Inc. | 0,03 | 36,23 | 2,9312 | -1,1015 |
| V / Visa Inc. | 0,11 | 36,42 | 2,9470 | -0,4695 |
| COST / Costco Wholesale Corporation | 0,04 | 34,98 | 2,8301 | -0,4498 |
| MELI / MercadoLibre, Inc. | 0,01 | 15,06 | 1,2184 | -0,3856 |
| FICO / Fair Isaac Corporation | 0,01 | 15,48 | 1,2526 | -0,3809 |
| PGR / The Progressive Corporation | 0,06 | 14,08 | 1,1391 | -0,3700 |
| MA / Mastercard Incorporated | 0,07 | 37,35 | 3,0218 | -0,3615 |
| TT / Trane Technologies plc | 0,04 | 16,28 | 1,3175 | -0,3225 |
13F og Fondsarkivering
Denne formular blev indsendt den 2025-09-26 for rapporteringsperioden 2025-07-31. Klik på linkikonet for at se den fulde transaktionshistorik.
Opgrader for at låse op for premium-data og eksportere til Excel ![]() .
.
| Sikkerhed | Type | Gennemsnitlig aktiekurs | Aktier (MM) |
Δ Aktier (%) |
Værdi ($MM) |
Δ Aktier (%) |
Portefølje (%) |
ΔPortefølje (%) |
|
|---|---|---|---|---|---|---|---|---|---|
| ORCL / Oracle Corporation | 0,23 | 16,02 | 59,37 | 109,23 | 4,8042 | 1,8974 | |||
| NVDA / NVIDIA Corporation | 0,28 | 4,16 | 49,73 | 70,10 | 4,0237 | 1,0291 | |||
| AVGO / Broadcom Inc. | 0,16 | -4,29 | 47,17 | 46,05 | 3,8169 | 0,5084 | |||
| META / Meta Platforms, Inc. | 0,06 | 13,95 | 45,56 | 60,53 | 3,6864 | 0,7793 | |||
| MSFT / Microsoft Corporation | 0,08 | -3,73 | 43,87 | 29,95 | 3,5497 | 0,0915 | |||
| AMZN / Amazon.com, Inc. | 0,18 | 14,98 | 42,99 | 45,96 | 3,4786 | 0,4615 | |||
| GE / General Electric Company | 0,16 | -8,15 | 42,47 | 23,54 | 3,4361 | -0,0849 | |||
| AAPL / Apple Inc. | 0,19 | 37,53 | 39,28 | 34,33 | 3,1780 | 0,1831 | |||
| AXP / American Express Company | 0,13 | 11,31 | 38,60 | 25,05 | 3,1232 | -0,0385 | |||
| MA / Mastercard Incorporated | 0,07 | 9,39 | 37,35 | 13,07 | 3,0218 | -0,3615 | |||
| V / Visa Inc. | 0,11 | 9,21 | 36,42 | 9,20 | 2,9470 | -0,4695 | |||
| NFLX / Netflix, Inc. | 0,03 | -10,18 | 36,23 | -7,98 | 2,9312 | -1,1015 | |||
| COST / Costco Wholesale Corporation | 0,04 | 15,61 | 34,98 | 9,24 | 2,8301 | -0,4498 | |||
| PM / Philip Morris International Inc. | 0,21 | 34,67 | 2,8056 | 2,8056 | |||||
| ISRG / Intuitive Surgical, Inc. | 0,07 | 171,19 | 33,12 | 152,95 | 2,6802 | 1,3388 | |||
| RBLX / Roblox Corporation | 0,19 | 61,29 | 26,15 | 188,71 | 2,1160 | 0,9751 | |||
| HOOD / Robinhood Markets, Inc. | 0,25 | -22,53 | 25,32 | 62,56 | 2,0491 | 0,4534 | |||
| GEV / GE Vernova Inc. | 0,03 | 22,70 | 1,8370 | 1,8370 | |||||
| ANET / Arista Networks Inc | 0,18 | 11,79 | 21,60 | 67,44 | 1,7478 | 0,4263 | |||
| VST / Vistra Corp. | 0,10 | -6,32 | 20,63 | 50,72 | 1,6695 | 0,2672 | |||
| DASH / DoorDash, Inc. | 0,08 | 3,90 | 19,80 | 34,80 | 1,6023 | 0,0975 | |||
| APH / Amphenol Corporation | 0,18 | -18,04 | 19,56 | 13,44 | 1,5827 | -0,1834 | |||
| VEEV / Veeva Systems Inc. | 0,07 | 79,88 | 19,36 | 84,93 | 1,5664 | 0,1719 | |||
| PWR / Quanta Services, Inc. | 0,05 | -13,79 | 19,29 | 19,63 | 1,5607 | -0,0909 | |||
| NDAQ / Nasdaq, Inc. | 0,20 | 18,78 | 1,5198 | 1,5198 | |||||
| KLAC / KLA Corporation | 0,02 | 2,25 | 18,07 | 27,91 | 1,4618 | 0,0151 | |||
| SCHW / The Charles Schwab Corporation | 0,18 | -0,79 | 17,88 | 19,12 | 1,4466 | -0,0909 | |||
| ORLY / O'Reilly Automotive, Inc. | 0,18 | 1.657,03 | 17,55 | 68,85 | 1,4204 | 0,0584 | |||
| HWM / Howmet Aerospace Inc. | 0,10 | -14,41 | 17,21 | 11,03 | 1,3925 | -0,1952 | |||
| HLT / Hilton Worldwide Holdings Inc. | 0,06 | 13,46 | 17,18 | 34,89 | 1,3898 | 0,0855 | |||
| ICE / Intercontinental Exchange, Inc. | 0,09 | 6,74 | 16,78 | 17,45 | 1,3581 | -0,1057 | |||
| APP / AppLovin Corporation | 0,04 | 10,22 | 16,63 | 59,90 | 1,3456 | 0,2803 | |||
| AZO / AutoZone, Inc. | 0,00 | 3,20 | 16,52 | 3,36 | 1,3364 | -0,3004 | |||
| BKNG / Booking Holdings Inc. | 0,00 | 2,80 | 16,38 | 10,96 | 1,3254 | -0,1868 | |||
| ADSK / Autodesk, Inc. | 0,05 | 16,36 | 1,3239 | 1,3239 | |||||
| TT / Trane Technologies plc | 0,04 | -11,01 | 16,28 | 1,70 | 1,3175 | -0,3225 | |||
| BSX / Boston Scientific Corporation | 0,15 | 5,59 | 16,02 | 7,70 | 1,2965 | -0,2275 | |||
| CTAS / Cintas Corporation | 0,07 | 1,43 | 15,97 | 6,64 | 1,2925 | -0,2419 | |||
| TJX / The TJX Companies, Inc. | 0,13 | 6,74 | 15,78 | 3,30 | 1,2767 | -0,2880 | |||
| MCK / McKesson Corporation | 0,02 | 15,61 | 1,2634 | 1,2634 | |||||
| SPOT / Spotify Technology S.A. | 0,02 | 0,30 | 15,55 | 2,34 | 1,2581 | -0,2981 | |||
| WDAY / Workday, Inc. | 0,07 | 33,52 | 15,54 | 97,48 | 1,2574 | -0,0239 | |||
| FICO / Fair Isaac Corporation | 0,01 | 34,44 | 15,48 | -2,93 | 1,2526 | -0,3809 | |||
| FTNT / Fortinet, Inc. | 0,15 | 14,84 | 15,46 | 10,57 | 1,2513 | -0,1814 | |||
| ADP / Automatic Data Processing, Inc. | 0,05 | 35,98 | 15,41 | 91,32 | 1,2466 | -0,0869 | |||
| MELI / MercadoLibre, Inc. | 0,01 | -5,58 | 15,06 | -3,84 | 1,2184 | -0,3856 | |||
| MNST / Monster Beverage Corporation | 0,25 | 14,83 | 1,1998 | 1,1998 | |||||
| RSG / Republic Services, Inc. | 0,06 | -3,27 | 14,67 | 2,88 | 1,1870 | -0,1904 | |||
| VRSK / Verisk Analytics, Inc. | 0,05 | 10,72 | 14,29 | 41,59 | 1,1563 | -0,1005 | |||
| PGR / The Progressive Corporation | 0,06 | 11,23 | 14,08 | -4,45 | 1,1391 | -0,3700 | |||
| Invesco Private Prime Fund / STIV (N/A) | 3,26 | 3,26 | 0,2639 | 0,2639 | |||||
| Invesco Private Government Fund / STIV (N/A) | 1,26 | 1,26 | 0,1019 | 0,1019 | |||||
| US8252528851 / Invesco Government & Agency Portfolio, Institutional Class | 0,94 | 61,95 | 0,94 | 62,03 | 0,0764 | 0,0167 | |||
| TRGP / Targa Resources Corp. | 0,00 | -100,00 | 0,00 | -100,00 | -1,3081 | ||||
| SPGI / S&P Global Inc. | 0,00 | -100,00 | 0,00 | -100,00 | -1,3989 |