Grundlæggende statistik
| Institutionelle ejere | 134 total, 134 long only, 0 short only, 0 long/short - change of -1,47% MRQ |
| Gennemsnitlig porteføljeallokering | 0.0723 % - change of -43,47% MRQ |
| Institutionelle aktier (lange) | 6.568.868 (ex 13D/G) - change of -0,09MM shares -1,39% MRQ |
| Institutionel værdi (lang) | $ 375.262 USD ($1000) |
Institutionelt ejerskab og aktionærer
ALPS ETF Trust - ALPS | O'Shares U.S. Quality Dividend ETF (US:OUSA) har 134 institutionelle ejere og aktionærer, der har indsendt 13D/G- eller 13F-formularer til Securities Exchange Commission (SEC). Disse institutioner har i alt 6,568,868 aktier. Største aktionærer omfatter Morgan Stanley, LPL Financial LLC, Ameriprise Financial Inc, Bank Of America Corp /de/, Royal Bank Of Canada, Wells Fargo & Company/mn, We Are One Seven, LLC, Raymond James Financial Inc, Rockefeller Capital Management L.P., and UBS Group AG .
ALPS ETF Trust - ALPS | O'Shares U.S. Quality Dividend ETF (ARCA:OUSA) institutionel ejerskabsstruktur viser aktuelle positioner i virksomheden efter institutioner og fonde, samt seneste ændringer i positionsstørrelse. Større aktionærer kan omfatte individuelle investorer, investeringsforeninger, hedgefonde eller institutioner. Skema 13D angiver, at investoren besidder (eller besidder) mere end 5 % af virksomheden og har til hensigt (eller har til hensigt at) aktivt at forfølge en ændring i forretningsstrategi. Skema 13G indikerer en passiv investering på over 5%.
The share price as of March 13, 2026 is 56,60 / share. Previously, on March 14, 2025, the share price was 52,44 / share. This represents an increase of 7,93% over that period.

Fondens stemningsscore
Fund Sentiment Score (fka Ownership Accumulation Score) finder de aktier, der bliver mest købt af fonde. Det er resultatet af en sofistikeret, multi-faktor kvantitativ model, der identificerer virksomheder med de højeste niveauer af institutionel akkumulering. Scoringsmodellen bruger en kombination af den samlede stigning i oplyste ejere, ændringerne i porteføljeallokeringer i disse ejere og andre målinger. Tallet går fra 0 til 100, hvor højere tal indikerer et højere niveau af akkumulering for sine jævnaldrende, og 50 er gennemsnittet.
Opdateringsfrekvens: Dagligt
Se Ownership Explorer, som giver en liste over højest rangerende virksomheder.
AI+ Ask Fintel’s AI assistant about ALPS ETF Trust - ALPS | O'Shares U.S. Quality Dividend ETF.
Select a question to share a public post with an AI-crafted answer.
Thinking of good questions…
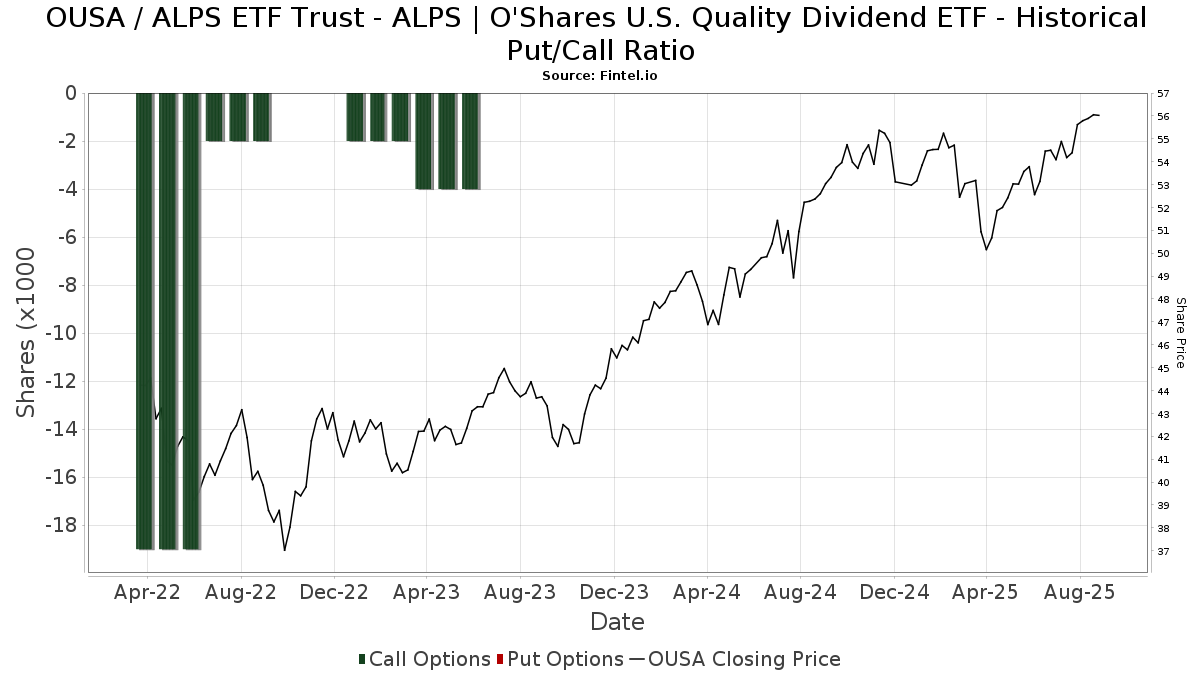
Institutionel Put/Call-forhold
Ud over at indberette standardaktie- og gældsudstedelser skal institutter med mere end 100 mill. aktiver under forvaltning også oplyse deres put- og call-optionsbeholdninger. Da salgsoptioner generelt indikerer negativ stemning, og købsoptioner indikerer positiv stemning, kan vi få en fornemmelse af den overordnede institutionelle stemning ved at plotte forholdet mellem put og kald. Diagrammet til højre viser det historiske put/call-forhold for dette instrument.
Brug af Put/Call Ratio som en indikator for investorernes stemning overvinder en af de vigtigste mangler ved at bruge totalt institutionelt ejerskab, som er, at en betydelig mængde af aktiver under forvaltning investeres passivt for at spore indekser. Passivt forvaltede fonde køber typisk ikke optioner, så indikatoren for put/call-forholdet følger mere nøje følelsen af aktivt forvaltede fonde.
13F og NPORT arkivering
Detaljer om 13F-arkivering er gratis. Detaljer om NP-ansøgninger kræver et premium-medlemskab. Grønne rækker angiver nye positioner. Røde rækker angiver lukkede positioner. Klik på linket ikon for at se den fulde transaktionshistorik.
Opgrader
for at låse premium-data op og eksportere til Excel ![]() .
.
| Fil dato | Kilde | Investor | Type | Gennemsnitlig pris (Øst) |
Aktier | Δ Aktier (%) |
Rapporteret Værdi ($1000) |
Δ Værdi (%) |
Port Alloc (%) |
|
|---|---|---|---|---|---|---|---|---|---|---|
| 2026-01-12 | 13F | DAVENPORT & Co LLC | 33.110 | -6,70 | 1.910 | -4,79 | ||||
| 2026-02-02 | 13F | CENTRAL TRUST Co | 1.076 | 0,00 | 62 | 3,33 | ||||
| 2026-01-26 | 13F | Grandview Asset Management LLC | 12.069 | 0,27 | 696 | 2,35 | ||||
| 2026-02-10 | 13F | Envestnet Asset Management Inc | 63.182 | -4,67 | 3.646 | -2,72 | ||||
| 2026-02-17 | 13F | Russell Investments Group, Ltd. | 37 | 0,00 | 2 | 0,00 | ||||
| 2026-02-03 | 13F | We Are One Seven, LLC | 270.552 | 2,44 | 15.611 | 4,54 | ||||
| 2026-02-17 | 13F | Cetera Investment Advisers | 20.533 | -2,14 | 1.185 | -0,17 | ||||
| 2026-02-02 | 13F | Truist Financial Corp | 9.332 | 16,42 | 538 | 18,76 | ||||
| 2026-02-12 | 13F | BRYN MAWR TRUST Co | 1.569 | 0,00 | 91 | 2,27 | ||||
| 2026-01-12 | 13F | Focus Financial Network, Inc. | 7.893 | 0,36 | 455 | 2,48 | ||||
| 2026-01-07 | 13F | Next Level Private LLC | 4.641 | 0,00 | 268 | 1,52 | ||||
| 2026-02-11 | 13F | Jpmorgan Chase & Co | 7.106 | 0,00 | 410 | 2,24 | ||||
| 2026-02-17 | 13F | Tower Research Capital LLC (TRC) | 0 | -100,00 | 0 | |||||
| 2025-11-14 | 13F | Sofos Investments, Inc. | 0 | -100,00 | 0 | |||||
| 2026-01-29 | 13F | Kestra Private Wealth Services, Llc | 113.584 | 0,70 | 6.554 | 2,76 | ||||
| 2026-02-17 | 13F | Fmr Llc | 4.275 | 0,66 | 247 | 2,50 | ||||
| 2026-02-17 | 13F | Mercer Global Advisors Inc /adv | 6.552 | 0,17 | 378 | 2,44 | ||||
| 2026-02-24 | 13F | Astoria Portfolio Advisors LLC. | 3.746 | 5,73 | 219 | 9,50 | ||||
| 2026-01-14 | 13F | ORG Partners LLC | 3.413 | 0,41 | 197 | 2,60 | ||||
| 2026-01-30 | 13F | Caldwell Trust Co | 29.423 | -0,90 | 1.698 | 1,13 | ||||
| 2026-02-11 | 13F | J.w. Cole Advisors, Inc. | 7.306 | 0,19 | 418 | 1,46 | ||||
| 2026-01-20 | 13F | Princeton Global Asset Management LLC | 424 | 0,00 | 24 | 4,35 | ||||
| 2026-02-13 | 13F | SRS Capital Advisors, Inc. | 300 | 0,00 | 17 | 6,25 | ||||
| 2026-02-13 | 13F | Mml Investors Services, Llc | 50.311 | -4,59 | 2.903 | -2,65 | ||||
| 2026-01-08 | 13F | Elmwood Wealth Management, Inc. | 6.508 | 376 | ||||||
| 2026-02-13 | 13F | Pine Valley Investments Ltd Liability Co | 6.241 | 0,35 | 360 | 2,56 | ||||
| 2026-02-14 | 13F | Rockefeller Capital Management L.P. | 197.148 | -2,20 | 11.375 | -0,19 | ||||
| 2025-11-10 | 13F | Citigroup Inc | 0 | -100,00 | 0 | |||||
| 2026-02-05 | 13F | WealthPlan Investment Management, LLC | 35.510 | 2,19 | 2.049 | 4,28 | ||||
| 2026-01-07 | 13F | Sovereign Financial Group, Inc. | 22.115 | 0,13 | 1.276 | 2,24 | ||||
| 2026-02-12 | 13F | Summit Financial, LLC | 6.550 | -0,76 | 378 | 1,07 | ||||
| 2025-10-21 | 13F | Optimum Investment Advisors | 303 | 0,00 | 17 | 6,25 | ||||
| 2026-02-05 | 13F | High Note Wealth, LLC | 1.760 | -1,84 | 102 | 0,00 | ||||
| 2026-02-17 | 13F | Signature Equity Partners, LLC | 366 | 21 | ||||||
| 2026-02-13 | 13F | Aptus Capital Advisors, LLC | 49 | 3 | ||||||
| 2026-01-23 | 13F | Diligent Investors, LLC | 6.471 | 0,06 | 373 | 2,19 | ||||
| 2026-01-28 | 13F | Hobbs Group Advisors, LLC | 4.148 | 0,24 | 239 | 2,58 | ||||
| 2026-01-23 | 13F | Farther Finance Advisors, LLC | 2 | 0,00 | 0 | |||||
| 2026-01-29 | 13F | Comerica Bank | 2.838 | -0,73 | 164 | 1,24 | ||||
| 2026-02-13 | 13F | Atlas Capital Advisors Llc | 0 | -100,00 | 0 | |||||
| 2026-02-17 | 13F | Advisor Group Holdings, Inc. | 65.511 | 1,76 | 3.781 | 4,74 | ||||
| 2026-02-17 | 13F | Citadel Advisors Llc | 0 | -100,00 | 0 | |||||
| 2026-01-12 | 13F | Salem Investment Counselors Inc | 0 | -100,00 | 0 | |||||
| 2026-02-04 | 13F | Fourth Dimension Wealth, LLC | 1.150 | 0,00 | 66 | 1,54 | ||||
| 2026-02-11 | 13F | Cerity Partners LLC | 8.216 | 9,30 | 474 | 11,53 | ||||
| 2026-01-23 | 13F | Assetmark, Inc | 51 | -8,93 | 3 | -33,33 | ||||
| 2026-02-12 | 13F | Commonwealth Equity Services, Llc | 19.851 | -9,59 | 1.145 | 114.400,00 | ||||
| 2026-02-10 | 13F | KERR FINANCIAL PLANNING Corp | 8.382 | -4,85 | 498 | 0,20 | ||||
| 2026-02-12 | 13F | Triumph Capital Management | 839 | 0,36 | 48 | 2,13 | ||||
| 2026-01-08 | 13F | Wealth Enhancement Advisory Services, Llc | 68.500 | 0,05 | 3.987 | 2,78 | ||||
| 2026-02-25 | 13F | Tempo Wealth, LLC | 19.552 | 1.128 | ||||||
| 2026-01-15 | 13F | Burns Matteson Capital Management, LLC | 6.715 | 0,00 | 387 | 2,11 | ||||
| 2026-01-21 | 13F | Capital Advisors, Ltd. LLC | 15.923 | -0,36 | 1 | |||||
| 2026-02-17 | 13F | Equitable Holdings, Inc. | 124.325 | -9,26 | 7.174 | -7,40 | ||||
| 2026-01-29 | 13F | Sanctuary Advisors, LLC | 78.381 | 1,55 | 4.523 | 3,64 | ||||
| 2026-02-13 | 13F | MAI Capital Management | 118 | 0,85 | 7 | 0,00 | ||||
| 2026-02-12 | 13F | Steward Partners Investment Advisory, Llc | 5.960 | -2,45 | 344 | -0,58 | ||||
| 2026-02-06 | 13F | Pnc Financial Services Group, Inc. | 310 | 0,00 | 18 | 0,00 | ||||
| 2026-01-05 | 13F | Park Avenue Securities Llc | 7.619 | 0,00 | 0 | |||||
| 2026-01-20 | 13F | Signaturefd, Llc | 0 | -100,00 | 0 | |||||
| 2026-02-17 | 13F | Raymond James Financial Inc | 233.081 | -1,62 | 13.449 | 0,40 | ||||
| 2026-02-17 | 13F | Jones Financial Companies Lllp | 24.121 | 20,17 | 1.392 | 23,32 | ||||
| 2026-02-17 | 13F | Wiley Bros.-aintree Capital, Llc | 100.878 | -14,15 | 5.821 | -12,39 | ||||
| 2026-02-18 | 13F | Beacon Pointe Advisors, LLC | 5.570 | -1,80 | 321 | 0,31 | ||||
| 2026-02-05 | 13F | AlphaCore Capital LLC | 200 | 12 | ||||||
| 2026-02-12 | 13F | Hrt Financial Lp | 0 | -100,00 | 0 | |||||
| 2026-02-12 | 13F | BlackRock, Inc. | 416 | 24 | ||||||
| 2026-02-09 | 13F | Hantz Financial Services, Inc. | 0 | -100,00 | 0 | |||||
| 2026-02-17 | 13F | Cresset Asset Management, LLC | 13.592 | 0,00 | 784 | 2,08 | ||||
| 2026-02-13 | 13F | Mariner, LLC | 7.716 | 2,88 | 445 | 4,95 | ||||
| 2026-03-02 | 13F | Sankala Group LLC | 411 | 24 | ||||||
| 2026-01-13 | 13F | Mather Group, Llc. | 0 | -100,00 | 0 | |||||
| 2026-01-16 | 13F | Park Edge Advisors, LLC | 12.914 | 0,01 | 745 | 2,05 | ||||
| 2026-01-14 | 13F | USA Financial Portformulas Corp | 12.493 | 3,21 | 721 | 5,26 | ||||
| 2026-02-12 | 13F | Alps Advisors Inc | 55.610 | 0,00 | 3.209 | 2,04 | ||||
| 2026-02-05 | 13F | Blue Water Asset Management | 5.183 | 299 | ||||||
| 2026-02-11 | 13F | TruNorth Capital Management, LLC | 0 | -100,00 | 0 | |||||
| 2026-02-12 | 13F | Wedbush Securities Inc | 9.062 | 0,00 | 1 | |||||
| 2026-01-20 | 13F | BXM Wealth LLC | 10.000 | 300,00 | 577 | 155,31 | ||||
| 2026-02-10 | 13F | Madison Wealth Partners, Inc | 5.266 | 304 | ||||||
| 2026-01-20 | 13F | Sovran Advisors, LLC | 3.621 | 0,00 | 213 | 4,43 | ||||
| 2026-02-02 | 13F | Highland Capital Management, Llc | 5.350 | -1,55 | 309 | 0,33 | ||||
| 2026-02-11 | 13F | LPL Financial LLC | 528.599 | -3,17 | 30.500 | -1,19 | ||||
| 2026-02-06 | 13F | Kingdom Financial Group LLC. | 117 | 7 | ||||||
| 2026-02-10 | 13F/A | Northwestern Mutual Wealth Management Co | 5.500 | 6,55 | 317 | 8,93 | ||||
| 2026-01-05 | 13F | Rosenberg Matthew Hamilton | 318 | 0,00 | 18 | 5,88 | ||||
| 2026-01-26 | 13F | AE Wealth Management LLC | 2.769 | 6,25 | 160 | 8,16 | ||||
| 2026-02-13 | 13F | Kestra Advisory Services, LLC | 0 | -100,00 | 0 | |||||
| 2026-02-19 | 13F | Atomi Financial Group, Inc. | 11.552 | 3,50 | 667 | 5,55 | ||||
| 2026-01-26 | 13F | Whittier Trust Co Of Nevada Inc | 1.000 | 0,00 | 58 | 3,57 | ||||
| 2026-02-13 | 13F | Glen Eagle Advisors, LLC | 325 | 0,62 | 19 | 0,00 | ||||
| 2026-01-30 | 13F | Sigma Planning Corp | 10.517 | 1,15 | 607 | 3,24 | ||||
| 2026-02-17 | 13F | Two Sigma Investments, Lp | 7.300 | -69,46 | 421 | -68,84 | ||||
| 2026-01-16 | 13F | Beaumont Financial Advisors, LLC | 27.173 | -0,28 | 1.568 | 1,75 | ||||
| 2026-01-13 | 13F | Stephens Consulting, LLC | 3.294 | 0,00 | 190 | 2,15 | ||||
| 2026-02-02 | 13F | Pittenger & Anderson Inc | 0 | -100,00 | 0 | |||||
| 2026-02-10 | 13F | Goldman Sachs Group Inc | 31.531 | -58,79 | 1.819 | -57,95 | ||||
| 2026-02-17 | 13F | Advisory Services Network, LLC | 0 | -100,00 | 0 | |||||
| 2026-01-30 | 13F | Us Bancorp \de\ | 1.022 | -4,66 | 59 | -3,33 | ||||
| 2026-01-29 | 13F | Nbc Securities, Inc. | 665 | 0,30 | 38 | 2,70 | ||||
| 2026-02-02 | 13F | Fifth Third Bancorp | 140 | 0,00 | 8 | 14,29 | ||||
| 2026-01-16 | 13F | Dorato Capital Management | 192 | 11 | ||||||
| 2026-02-17 | 13F | Miller Capital Partners, Inc. | 2.298 | 133 | ||||||
| 2026-02-17 | 13F | Royal Bank Of Canada | 329.887 | 7,93 | 19.034 | 10,14 | ||||
| 2026-01-20 | 13F | Thurston, Springer, Miller, Herd & Titak, Inc. | 131.668 | 126,82 | 7.597 | 131,47 | ||||
| 2026-02-11 | 13F | Janney Montgomery Scott LLC | 23.872 | -19,36 | 1 | 0,00 | ||||
| 2026-02-13 | 13F | Stifel Financial Corp | 92.431 | 1,66 | 5.333 | 3,75 | ||||
| 2026-01-26 | 13F | Cwm, Llc | 300 | 0,00 | 0 | |||||
| 2026-01-29 | 13F | UBS Group AG | 192.030 | -2,71 | 11.080 | -0,71 | ||||
| 2026-02-13 | 13F | Beacon Financial Advisory LLC | 6.653 | 0,33 | 384 | 2,41 | ||||
| 2025-11-14 | 13F | Mount Yale Investment Advisors, LLC | 0 | -100,00 | 0 | |||||
| 2025-09-25 | NP | RLGAX - RiverFront Asset Allocation Growth & Income Investor Shares | 55.610 | 0,00 | 2.993 | 3,82 | ||||
| 2026-02-04 | 13F | Ameritas Advisory Services, LLC | 56.167 | 3.241 | ||||||
| 2026-02-06 | 13F | HighTower Advisors, LLC | 8.774 | -2,06 | 506 | 0,00 | ||||
| 2026-01-21 | 13F | Flagship Harbor Advisors, Llc | 20.121 | -6,90 | 1.161 | -4,91 | ||||
| 2026-01-23 | 13F | Rsm Us Wealth Management Llc | 3.655 | -57,37 | 212 | -56,20 | ||||
| 2026-02-11 | 13F | Nemes Rush Group LLC | 4.029 | -19,92 | 232 | -18,31 | ||||
| 2026-02-17 | 13F | Blair William & Co/il | 473 | 0,42 | 27 | 3,85 | ||||
| 2026-01-20 | 13F | Stratos Wealth Partners, LTD. | 55.572 | -0,09 | 3.207 | 1,97 | ||||
| 2026-02-13 | 13F | Avant Capital LLC | 36.016 | 4,57 | 2.078 | 6,73 | ||||
| 2026-02-09 | 13F | Kingsview Wealth Management, LLC | 13.459 | 0,11 | 777 | 2,11 | ||||
| 2026-02-17 | 13F | Creative Planning | 7.178 | 0,00 | 414 | 2,22 | ||||
| 2026-02-17 | 13F | Bank Of America Corp /de/ | 399.917 | 4,52 | 23.075 | 6,67 | ||||
| 2026-02-27 | 13F | Compass Financial Services Inc | 187 | 0,00 | 11 | 0,00 | ||||
| 2026-01-30 | 13F | Jackson Hole Capital Partners, LLC | 552 | 0,00 | 32 | 0,00 | ||||
| 2026-02-12 | 13F | Brown Brothers Harriman & Co | 2.173 | 0,00 | 125 | 2,46 | ||||
| 2026-03-04 | 13F | SHP Wealth Management | 197 | 11 | ||||||
| 2026-02-02 | 13F | Mutual Advisors, LLC | 4.793 | 0,02 | 277 | 2,60 | ||||
| 2026-01-13 | 13F | CoreCap Advisors, LLC | 140 | 0,00 | 8 | 14,29 | ||||
| 2026-02-13 | 13F | Wells Fargo & Company/mn | 323.080 | 1,02 | 18.642 | 3,09 | ||||
| 2026-02-02 | 13F | Oppenheimer & Co Inc | 8.374 | -1,40 | 483 | 0,63 | ||||
| 2026-02-11 | 13F | O'shaughnessy Asset Management, Llc | 792 | 760,87 | 46 | 800,00 | ||||
| 2026-02-12 | 13F | Principal Securities, Inc. | 0 | -100,00 | 0 | |||||
| 2026-02-13 | 13F | Intrepid Financial Planning Group LLC | 8.680 | 5,21 | 501 | 7,30 | ||||
| 2026-02-26 | 13F | TD Capital Management LLC | 662 | 0,00 | 38 | 2,70 | ||||
| 2026-02-17 | 13F | Ameriprise Financial Inc | 461.629 | -0,97 | 26.634 | 0,70 | ||||
| 2025-11-07 | 13F | Beacon Capital Management, LLC | 0 | -100,00 | 0 | |||||
| 2026-01-29 | 13F | Quest 10 Wealth Builders, Inc. | 123 | -2,38 | 7 | 0,00 | ||||
| 2026-01-09 | 13F | Capstone Wealth Management Group LLC | 5.130 | -3,75 | 296 | -1,66 | ||||
| 2026-01-15 | 13F | SILVER OAK SECURITIES, Inc | 0 | -100,00 | 0 | |||||
| 2026-02-13 | 13F | Integrated Wealth Concepts LLC | 6.419 | -6,46 | 370 | -4,39 | ||||
| 2026-01-22 | 13F | Apollon Financial, LLC | 29.415 | -10,70 | 1.697 | -8,86 | ||||
| 2026-02-13 | 13F | Morgan Stanley | 1.588.646 | 2,35 | 91.665 | 4,45 | ||||
| 2026-01-07 | 13F | Wisconsin Wealth Advisors, LLC | 0 | -100,00 | 0 | |||||
| 2026-02-18 | 13F | GWM Advisors LLC | 61.669 | -1,91 | 3.558 | 0,11 | ||||
| 2026-02-12 | 13F | Symphony Financial Services, Inc. | 10.253 | -17,22 | 592 | -15,57 | ||||
| 2026-01-26 | 13F | Asset Dedication, LLC | 0 | -100,00 | 0 | |||||
| 2026-02-17 | 13F | Susquehanna International Group, Llp | 15.615 | -33,24 | 901 | -31,92 | ||||
| 2026-02-12 | 13F | Bank Of Montreal /can/ | 91 | 0,00 | 5 | 0,00 | ||||
| 2026-01-26 | 13F | Private Trust Co Na | 1.243 | 0,00 | 72 | 1,43 | ||||
| 2026-02-05 | 13F | Cambridge Investment Research Advisors, Inc. | 4.619 | -14,54 | 0 | |||||
| 2026-02-17 | 13F | Private Advisor Group, LLC | 81.070 | -1,54 | 4.678 | 0,47 | ||||
| 2026-01-21 | 13F | Newbridge Financial Services Group, Inc. | 0 | -100,00 | 0 | -100,00 | ||||
| 2026-02-03 | 13F | NewEdge Wealth, LLC | 3.714 | -45,77 | 214 | -44,13 | ||||
| 2026-01-30 | 13F | Archer Investment Corp | 148 | 0,00 | 9 | 0,00 |