Grundlæggende statistik
| Institutionelle ejere | 62 total, 62 long only, 0 short only, 0 long/short - change of 8,77% MRQ |
| Gennemsnitlig porteføljeallokering | 0.9219 % - change of -14,80% MRQ |
| Institutionelle aktier (lange) | 18.597.447 (ex 13D/G) - change of 1,01MM shares 5,77% MRQ |
| Institutionel værdi (lang) | $ 671.512 USD ($1000) |
Institutionelt ejerskab og aktionærer
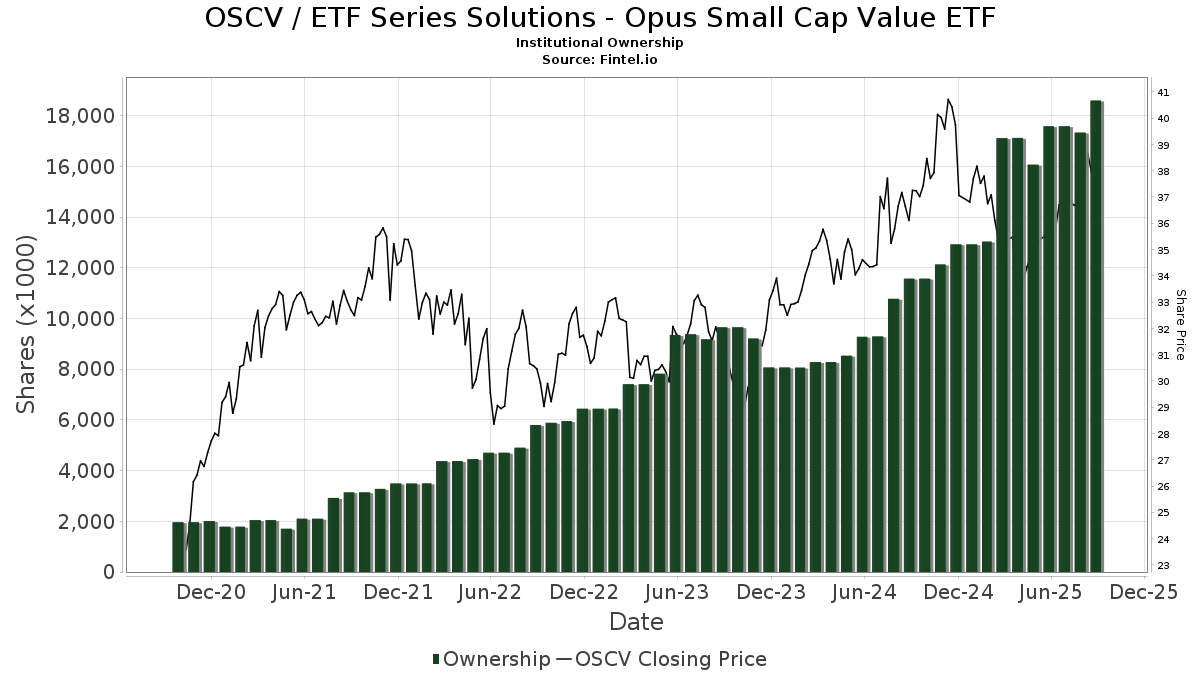
ETF Series Solutions - Opus Small Cap Value ETF (US:OSCV) har 62 institutionelle ejere og aktionærer, der har indsendt 13D/G- eller 13F-formularer til Securities Exchange Commission (SEC). Disse institutioner har i alt 18,597,447 aktier. Største aktionærer omfatter Aptus Capital Advisors, LLC, Integrated Wealth Concepts LLC, Raymond James Financial Inc, Diversified Enterprises, LLC, Guardian Wealth Advisors, Llc / Nc, Envestnet Asset Management Inc, Brogan Financial, Inc., First Heartland Consultants, Inc., Second Line Capital, LLC, and Park Place Capital Corp .
ETF Series Solutions - Opus Small Cap Value ETF (BATS:OSCV) institutionel ejerskabsstruktur viser aktuelle positioner i virksomheden efter institutioner og fonde, samt seneste ændringer i positionsstørrelse. Større aktionærer kan omfatte individuelle investorer, investeringsforeninger, hedgefonde eller institutioner. Skema 13D angiver, at investoren besidder (eller besidder) mere end 5 % af virksomheden og har til hensigt (eller har til hensigt at) aktivt at forfølge en ændring i forretningsstrategi. Skema 13G indikerer en passiv investering på over 5%.
The share price as of September 12, 2025 is 38,38 / share. Previously, on September 13, 2024, the share price was 36,90 / share. This represents an increase of 4,01% over that period.
Fondens stemningsscore
Fund Sentiment Score (fka Ownership Accumulation Score) finder de aktier, der bliver mest købt af fonde. Det er resultatet af en sofistikeret, multi-faktor kvantitativ model, der identificerer virksomheder med de højeste niveauer af institutionel akkumulering. Scoringsmodellen bruger en kombination af den samlede stigning i oplyste ejere, ændringerne i porteføljeallokeringer i disse ejere og andre målinger. Tallet går fra 0 til 100, hvor højere tal indikerer et højere niveau af akkumulering for sine jævnaldrende, og 50 er gennemsnittet.
Opdateringsfrekvens: Dagligt
Se Ownership Explorer, som giver en liste over højest rangerende virksomheder.
Institutionel Put/Call-forhold
Ud over at indberette standardaktie- og gældsudstedelser skal institutter med mere end 100 mill. aktiver under forvaltning også oplyse deres put- og call-optionsbeholdninger. Da salgsoptioner generelt indikerer negativ stemning, og købsoptioner indikerer positiv stemning, kan vi få en fornemmelse af den overordnede institutionelle stemning ved at plotte forholdet mellem put og kald. Diagrammet til højre viser det historiske put/call-forhold for dette instrument.
Brug af Put/Call Ratio som en indikator for investorernes stemning overvinder en af de vigtigste mangler ved at bruge totalt institutionelt ejerskab, som er, at en betydelig mængde af aktiver under forvaltning investeres passivt for at spore indekser. Passivt forvaltede fonde køber typisk ikke optioner, så indikatoren for put/call-forholdet følger mere nøje følelsen af aktivt forvaltede fonde.
13F og NPORT arkivering
Detaljer om 13F-arkivering er gratis. Detaljer om NP-ansøgninger kræver et premium-medlemskab. Grønne rækker angiver nye positioner. Røde rækker angiver lukkede positioner. Klik på linket ikon for at se den fulde transaktionshistorik.
Opgrader
for at låse premium-data op og eksportere til Excel ![]() .
.
| Fil dato | Kilde | Investor | Type | Gennemsnitlig pris (Øst) |
Aktier | Δ Aktier (%) |
Rapporteret Værdi ($1000) |
Δ Værdi (%) |
Port Alloc (%) |
|
|---|---|---|---|---|---|---|---|---|---|---|
| 2025-07-25 | 13F | Pandora Wealth, Inc. | 74.366 | -1,32 | 2.685 | 2,25 | ||||
| 2025-07-08 | 13F | Parallel Advisors, LLC | 557 | 0,00 | 20 | 5,26 | ||||
| 2025-03-18 | 13F/A | Bank Of America Corp /de/ | 0 | -100,00 | 0 | |||||
| 2025-07-03 | 13F | TrueWealth Advisors, LLC | 49.096 | -1,64 | 1.773 | 1,90 | ||||
| 2025-07-17 | 13F | SWS Partners | 194.440 | 37,01 | 7.021 | 41,98 | ||||
| 2025-07-10 | 13F | Signal Advisors Wealth, LLC | 152.675 | 36,60 | 5.513 | 41,54 | ||||
| 2025-08-08 | 13F | Emerald Investment Partners, Llc | 324 | 0,00 | 12 | 0,00 | ||||
| 2025-08-12 | 13F | Maripau Wealth Management Llc | 58.493 | -2,18 | 2.131 | 2,26 | ||||
| 2025-04-21 | 13F | ORG Partners LLC | 0 | -100,00 | 0 | |||||
| 2025-07-22 | 13F | Wealthcare Advisory Partners LLC | 25.143 | 908 | ||||||
| 2025-08-12 | 13F | MAI Capital Management | 600 | 0,00 | 22 | 5,00 | ||||
| 2025-08-14 | 13F | Guardian Wealth Advisors, Llc / Nc | 1.483.136 | 4,00 | 53.556 | 7,77 | ||||
| 2025-07-25 | 13F | JustInvest LLC | 5.806 | 210 | ||||||
| 2025-08-12 | 13F | Proequities, Inc. | 0 | 0 | ||||||
| 2025-05-14 | 13F | Northwestern Mutual Wealth Management Co | 0 | -100,00 | 0 | |||||
| 2025-07-23 | 13F | Prime Capital Investment Advisors, LLC | 29.212 | 1.055 | ||||||
| 2025-08-01 | 13F | Brookwood Investment Group LLC | 0 | -100,00 | 0 | |||||
| 2025-07-25 | 13F | Second Half Financial Partners, LLC | 18.907 | 9,18 | 683 | 13,10 | ||||
| 2025-08-04 | 13F | Creative Financial Designs Inc /adv | 618 | 1,31 | 22 | 4,76 | ||||
| 2025-08-14 | 13F | Integrated Wealth Concepts LLC | 1.969.227 | 38,82 | 71.109 | 43,84 | ||||
| 2025-07-16 | 13F | MBE Wealth Management, LLC | 160.574 | 0,81 | 5.798 | 4,47 | ||||
| 2025-08-13 | 13F | Safe Harbor Fiduciary, LLC | 6 | 0,00 | 0 | |||||
| 2025-07-11 | 13F | SILVER OAK SECURITIES, Inc | 118.703 | 7,57 | 4.286 | 11,70 | ||||
| 2025-08-12 | 13F | Bokf, Na | 10.483 | 35,25 | 379 | 40,00 | ||||
| 2025-07-28 | 13F | Cushing Capital Partners, LLC | 77.966 | 4,57 | 2.815 | 8,35 | ||||
| 2025-08-08 | 13F | Renasant Bank | 106.017 | -5,75 | 3.828 | -2,32 | ||||
| 2025-08-05 | 13F | Lord & Richards Wealth Management, LLC | 28.876 | 36,89 | 1.043 | 41,77 | ||||
| 2025-08-11 | 13F | Aptus Capital Advisors, LLC | 5.248.401 | 7,84 | 189.520 | 11,74 | ||||
| 2025-07-25 | 13F | Concord Wealth Partners | 0 | -100,00 | 0 | |||||
| 2025-07-14 | 13F | Kfg Wealth Management, Llc | 431.187 | 9,08 | 15.570 | 13,03 | ||||
| 2025-08-07 | 13F | CENTRAL TRUST Co | 105.875 | -5,15 | 3.823 | -1,72 | ||||
| 2025-07-16 | 13F | Diversified Enterprises, LLC | 1.621.115 | 6,82 | 58.538 | 10,69 | ||||
| 2025-07-17 | 13F | Park Place Capital Corp | 467.230 | 7,29 | 17.035 | 12,24 | ||||
| 2025-08-11 | 13F | Independent Advisor Alliance | 14.015 | 506 | ||||||
| 2025-09-04 | 13F/A | Advisor Group Holdings, Inc. | 15.305 | 4.272,86 | 553 | 4.500,00 | ||||
| 2025-08-14 | 13F | Susquehanna International Group, Llp | 0 | -100,00 | 0 | |||||
| 2025-07-30 | 13F | Retirement Planning Group | 19.582 | -5,14 | 707 | -1,67 | ||||
| 2025-07-28 | 13F | Harbour Investments, Inc. | 447 | 0,00 | 16 | 6,67 | ||||
| 2025-07-16 | 13F | One + One Wealth Management, Llc | 39.698 | 1,96 | 1.433 | 5,68 | ||||
| 2025-08-14 | 13F | Wells Fargo & Company/mn | 877 | 0,11 | 32 | 3,33 | ||||
| 2025-08-15 | 13F | Morgan Stanley | 1 | 0,00 | 0 | |||||
| 2025-08-12 | 13F | O'shaughnessy Asset Management, Llc | 697 | 25 | ||||||
| 2025-08-15 | 13F | First Heartland Consultants, Inc. | 622.514 | 9,86 | 22.479 | 13,83 | ||||
| 2025-08-12 | 13F | Global Retirement Partners, LLC | 3.467 | 4,02 | 125 | 1,63 | ||||
| 2025-07-15 | 13F | Fifth Third Bancorp | 748 | 0,00 | 27 | 3,85 | ||||
| 2025-08-08 | 13F | Larson Financial Group LLC | 15 | 1 | ||||||
| 2025-08-12 | 13F | LPL Financial LLC | 164.976 | 9,56 | 5.957 | 13,53 | ||||
| 2025-08-14 | 13F | Heritage Wealth Management, Inc. | 7.830 | 2,62 | 283 | 6,42 | ||||
| 2025-05-16 | 13F/A | Goldman Sachs Group Inc | 0 | -100,00 | 0 | -100,00 | ||||
| 2025-08-11 | 13F | Advisor Resource Council | 8.953 | -81,39 | 323 | -76,32 | ||||
| 2025-08-14 | 13F | Raymond James Financial Inc | 1.703.695 | 4,27 | 61.520 | 8,04 | ||||
| 2025-08-11 | 13F | United Advisor Group, LLC | 213.355 | 10,94 | 7.704 | 14,97 | ||||
| 2025-08-15 | 13F | Kestra Advisory Services, LLC | 23.966 | 14,16 | 865 | 18,33 | ||||
| 2025-08-14 | 13F | Royal Bank Of Canada | 21.641 | 781 | ||||||
| 2025-07-29 | 13F | Financial Guidance Group, Inc. | 107.942 | 41,70 | 3.898 | 46,83 | ||||
| 2025-08-08 | 13F | Brogan Financial, Inc. | 826.627 | 4,73 | 29.850 | 8,52 | ||||
| 2025-08-12 | 13F | Waterloo Capital, L.P. | 457.877 | 14,74 | 16.534 | 18,88 | ||||
| 2025-08-14 | 13F | Mercer Global Advisors Inc /adv | 14.259 | -51,38 | 515 | -49,66 | ||||
| 2025-08-18 | 13F | Second Line Capital, LLC | 552.897 | 5,57 | 19.965 | 9,39 | ||||
| 2025-08-01 | 13F | Envestnet Asset Management Inc | 897.732 | 11,71 | 32.417 | 15,75 | ||||
| 2025-08-14 | 13F | Two Sigma Investments, Lp | 20.600 | -32,68 | 744 | -30,30 | ||||
| 2025-08-14 | 13F | Betterment LLC | 7.475 | 0 | ||||||
| 2025-08-14 | 13F | Talon Private Wealth, LLC | 125.172 | -1,64 | 4.520 | -1,29 | ||||
| 2025-08-14 | 13F | UBS Group AG | 429 | 652,63 | 15 | 1.400,00 | ||||
| 2025-05-14 | 13F | Atomi Financial Group, Inc. | 0 | -100,00 | 0 | |||||
| 2025-07-15 | 13F | Clarus Group, Inc. | 61.128 | 2.207 | ||||||
| 2025-08-12 | 13F | Jpmorgan Chase & Co | 995 | -49,00 | 36 | -47,76 | ||||
| 2025-08-04 | 13F | Atria Investments Llc | 28.932 | 3,90 | 1.045 | 7,63 | ||||
| 2025-07-23 | 13F | True Vision MN LLC | 21.554 | -10,34 | 778 | -7,05 | ||||
| 2025-08-14 | 13F | CoreCap Advisors, LLC | 146 | 0,00 | 5 | 0,00 | ||||
| 2025-08-19 | 13F | Advisory Services Network, LLC | 172.867 | 4,39 | 6.317 | 9,44 |