CTM - Castellum, Inc. Aktie - Aktiekurs, institutionelt ejerskab, aktionærer (NYSEAM)

Castellum, Inc.
US ˙ NYSEAM ˙ US14838T2042

Grundlæggende statistik
Institutionelle ejere 37 total, 37 long only, 0 short only, 0 long/short - change of 19,35% MRQ
Gennemsnitlig porteføljeallokering 0.0146 % - change of 511,83% MRQ
Deler fremragende shares (source: Capital IQ)
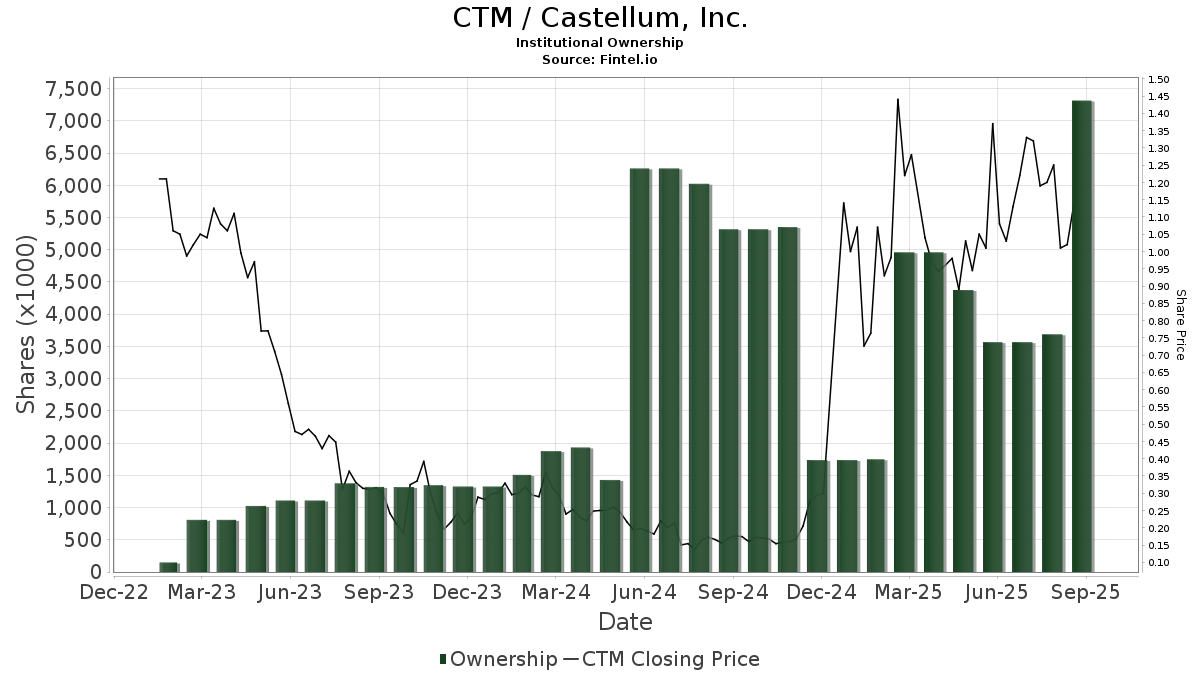
Institutionelle aktier (lange) 7.314.506 - 7,74% (ex 13D/G) - change of 3,75MM shares 105,08% MRQ
Institutionel værdi (lang) $ 7.479 USD ($1000)
Institutionelt ejerskab og aktionærer

Castellum, Inc. (US:CTM) har 37 institutionelle ejere og aktionærer, der har indsendt 13D/G- eller 13F-formularer til Securities Exchange Commission (SEC). Disse institutioner har i alt 7,314,506 aktier. Største aktionærer omfatter Essex Investment Management Co Llc, Vanguard Group Inc, VEXMX - Vanguard Extended Market Index Fund Investor Shares, Legato Capital Management LLC, Meridian Wealth Management, LLC, Geode Capital Management, Llc, Bank of New York Mellon Corp, FSMAX - Fidelity Extended Market Index Fund, Jane Street Group, Llc, and Savvy Advisors, Inc. .

Castellum, Inc. (NYSEAM:CTM) institutionel ejerskabsstruktur viser aktuelle positioner i virksomheden efter institutioner og fonde, samt seneste ændringer i positionsstørrelse. Større aktionærer kan omfatte individuelle investorer, investeringsforeninger, hedgefonde eller institutioner. Skema 13D angiver, at investoren besidder (eller besidder) mere end 5 % af virksomheden og har til hensigt (eller har til hensigt at) aktivt at forfølge en ændring i forretningsstrategi. Skema 13G indikerer en passiv investering på over 5%.

The share price as of September 12, 2025 is 1,11 / share. Previously, on September 13, 2024, the share price was 0,17 / share. This represents an increase of 543,11% over that period.

CTM / Castellum, Inc. Institutional Ownership
Fondens stemningsscore

Fund Sentiment Score (fka Ownership Accumulation Score) finder de aktier, der bliver mest købt af fonde. Det er resultatet af en sofistikeret, multi-faktor kvantitativ model, der identificerer virksomheder med de højeste niveauer af institutionel akkumulering. Scoringsmodellen bruger en kombination af den samlede stigning i oplyste ejere, ændringerne i porteføljeallokeringer i disse ejere og andre målinger. Tallet går fra 0 til 100, hvor højere tal indikerer et højere niveau af akkumulering for sine jævnaldrende, og 50 er gennemsnittet.

Opdateringsfrekvens: Dagligt

Se Ownership Explorer, som giver en liste over højest rangerende virksomheder.

Institutionel Put/Call-forhold

Ud over at indberette standardaktie- og gældsudstedelser skal institutter med mere end 100 mill. aktiver under forvaltning også oplyse deres put- og call-optionsbeholdninger. Da salgsoptioner generelt indikerer negativ stemning, og købsoptioner indikerer positiv stemning, kan vi få en fornemmelse af den overordnede institutionelle stemning ved at plotte forholdet mellem put og kald. Diagrammet til højre viser det historiske put/call-forhold for dette instrument.

Brug af Put/Call Ratio som en indikator for investorernes stemning overvinder en af de vigtigste mangler ved at bruge totalt institutionelt ejerskab, som er, at en betydelig mængde af aktiver under forvaltning investeres passivt for at spore indekser. Passivt forvaltede fonde køber typisk ikke optioner, så indikatoren for put/call-forholdet følger mere nøje følelsen af aktivt forvaltede fonde.

CTM / Castellum, Inc. Historical Put/Call Ratio
13F og NPORT arkivering

Detaljer om 13F-arkivering er gratis. Detaljer om NP-ansøgninger kræver et premium-medlemskab. Grønne rækker angiver nye positioner. Røde rækker angiver lukkede positioner. Klik på linket ikon for at se den fulde transaktionshistorik.

Opgrader for at låse premium-data op og eksportere til Excel .

Fil dato Kilde Investor Type Gennemsnitlig pris
(Øst)
Aktier Δ Aktier
(%)
Rapporteret
Værdi
($1000)
Δ Værdi
(%)
Port Alloc
(%)
2025-08-14 13F Two Sigma Investments, Lp 32.996 35
2025-08-13 13F Townsquare Capital Llc 0 -100,00 0
2025-08-14 13F State Street Corp 156.000 0,00 164 -1,21
2025-08-12 13F XTX Topco Ltd 135.796 107,58 143 105,80
2025-08-05 13F Westside Investment Management, Inc. 0 -100,00 0
2025-08-12 13F Pathstone Holdings, LLC 15.590 16
2025-08-14 13F Mml Investors Services, Llc 0 -100,00 0
2025-08-14 13F Jane Street Group, Llc 194.733 204
2025-08-08 13F Meridian Wealth Management, LLC 616.800 6,20 648 5,20
2025-08-12 13F Inscription Capital, LLC 12.500 -95,00 13 -80,00
2025-08-05 13F Bank of New York Mellon Corp 500.001 -16,67 525 -17,45
2025-04-29 13F Pensionmark Financial Group, Llc 0 -100,00 0 -100,00
2025-07-24 13F Strengthening Families & Communities, LLC 2.700 3
2025-07-24 13F Ronald Blue Trust, Inc. 14.724 0,00 15 0,00
2025-07-24 NP FSMAX - Fidelity Extended Market Index Fund This fund is a listed as child fund of Fmr Llc and if that institution has disclosed ownership in this security, then these positions will not be double counted when calculating total shares and total value 234.093 52,16 229 37,95
2025-08-14 13F Two Sigma Securities, Llc 0 -100,00 0
2025-08-07 13F Kestra Private Wealth Services, Llc 27.250 0,00 29 0,00
2025-08-08 13F Creative Planning 10.000 0,00 10 0,00
2025-05-15 13F Armistice Capital, Llc 0 -100,00 0 -100,00
2025-08-12 13F Proequities, Inc. 0 0
2025-08-12 13F BlackRock, Inc. 127.421 0,00 134 -1,48
2025-08-05 13F American Capital Advisory, LLC 0 -100,00 0
2025-08-08 13F Geode Capital Management, Llc 599.198 43,17 629 41,99
2025-08-14 13F Bank Of America Corp /de/ 589 61,37 1
2025-07-21 13F New Century Financial Group, LLC 12.000 13
2025-08-15 13F Tower Research Capital LLC (TRC) 0 -100,00 0 -100,00
2025-08-27 NP VEXMX - Vanguard Extended Market Index Fund Investor Shares This fund is a listed as child fund of Vanguard Group Inc and if that institution has disclosed ownership in this security, then these positions will not be double counted when calculating total shares and total value 1.039.634 69,80 1.092 68,10
2025-08-14 13F UBS Group AG 76 0,00 0
2025-08-27 13F/A Squarepoint Ops LLC 23.940 25
2025-08-12 13F Global Retirement Partners, LLC 4.812 5
2025-08-12 13F Virtu Financial LLC 105.126 449,56 0
2025-08-12 13F PKS Advisory Services, LLC 42.222 0,00 44 0,00
2025-08-14 13F Sunbelt Securities, Inc. 3.000 6
2025-07-25 13F Almanack Investment Partners, LLC. 50.000 0,00 52 -1,89
2025-07-24 NP FSKAX - Fidelity Total Market Index Fund This fund is a listed as child fund of Fmr Llc and if that institution has disclosed ownership in this security, then these positions will not be double counted when calculating total shares and total value 55.019 0,00 54 -10,17
2025-08-11 13F Vanguard Group Inc 1.051.978 64,47 1.105 62,83
2025-04-11 13F Magnus Financial Group LLC 0 -100,00 0 -100,00
2025-08-13 13F Quadrature Capital Ltd 21.089 22
2025-07-24 NP FCFMX - Fidelity Series Total Market Index Fund This fund is a listed as child fund of Fmr Llc and if that institution has disclosed ownership in this security, then these positions will not be double counted when calculating total shares and total value 73.839 100,40 72 84,62
2025-08-14 13F Cubist Systematic Strategies, LLC 94.152 39,11 99 38,03
2025-08-14 13F Hrt Financial Lp 50.395 0
2025-08-13 13F Northern Trust Corp 94.120 0,00 99 -1,01
2025-08-12 13F Essex Investment Management Co Llc 2.090.500 2.195
2025-08-04 13F Savvy Advisors, Inc. 191.100 201
2025-08-11 13F Citigroup Inc 31.628 33
2025-08-14 13F Legato Capital Management LLC 621.409 652
2025-08-14 13F Susquehanna International Group, Llp 17.710 0,11 19 0,00
Fintel data has been cited in the following publications:
Daily Mail Fox Business Business Insider Wall Street Journal The Washington Post Bloomberg Financial Times Globe and Mail
NASDAQ.com Reuters The Guardian Associated Press FactCheck.org Snopes Politifact
Federal Register The Intercept Forbes Fortune Magazine TheStreet Time Magazine Canadian Broadcasting Corporation International Business Times
Cambridge University Press Investopedia MarketWatch NY Daily News Entrepreneur Newsweek Barron's El Economista