Grundlæggende statistik
| Institutionelle ejere | 99 total, 99 long only, 0 short only, 0 long/short - change of 0,00% MRQ |
| Gennemsnitlig porteføljeallokering | 0.1060 % - change of -7,33% MRQ |
| Institutionelle aktier (lange) | 3.496.240 (ex 13D/G) - change of -0,60MM shares -14,59% MRQ |
| Institutionel værdi (lang) | $ 238.608 USD ($1000) |
Institutionelt ejerskab og aktionærer
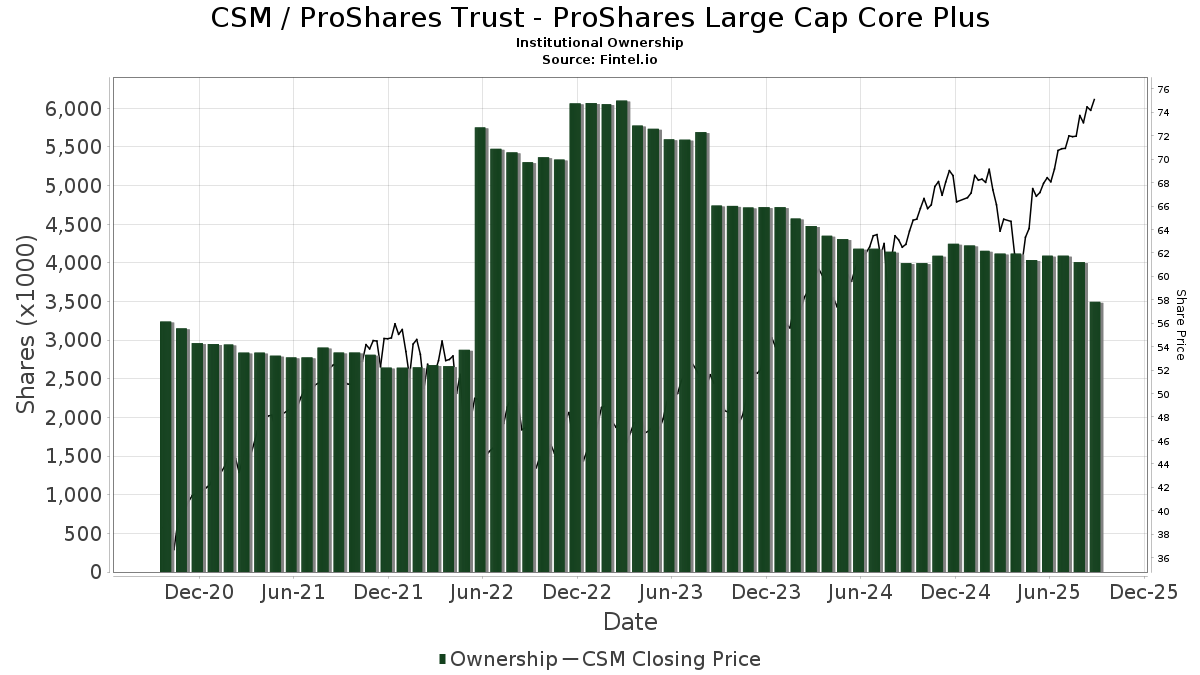
ProShares Trust - ProShares Large Cap Core Plus (US:CSM) har 99 institutionelle ejere og aktionærer, der har indsendt 13D/G- eller 13F-formularer til Securities Exchange Commission (SEC). Disse institutioner har i alt 3,496,240 aktier. Største aktionærer omfatter Morgan Stanley, Kayne Anderson Rudnick Investment Management Llc, LPL Financial LLC, National Asset Management, Inc., Stifel Financial Corp, Onyx Bridge Wealth Group LLC, Waterfront Wealth Inc., Envestnet Asset Management Inc, Apexium Financial, Lp, and Bank of New York Mellon Corp .
ProShares Trust - ProShares Large Cap Core Plus (BATS:CSM) institutionel ejerskabsstruktur viser aktuelle positioner i virksomheden efter institutioner og fonde, samt seneste ændringer i positionsstørrelse. Større aktionærer kan omfatte individuelle investorer, investeringsforeninger, hedgefonde eller institutioner. Skema 13D angiver, at investoren besidder (eller besidder) mere end 5 % af virksomheden og har til hensigt (eller har til hensigt at) aktivt at forfølge en ændring i forretningsstrategi. Skema 13G indikerer en passiv investering på over 5%.
The share price as of September 15, 2025 is 75,99 / share. Previously, on September 16, 2024, the share price was 63,93 / share. This represents an increase of 18,86% over that period.
Fondens stemningsscore
Fund Sentiment Score (fka Ownership Accumulation Score) finder de aktier, der bliver mest købt af fonde. Det er resultatet af en sofistikeret, multi-faktor kvantitativ model, der identificerer virksomheder med de højeste niveauer af institutionel akkumulering. Scoringsmodellen bruger en kombination af den samlede stigning i oplyste ejere, ændringerne i porteføljeallokeringer i disse ejere og andre målinger. Tallet går fra 0 til 100, hvor højere tal indikerer et højere niveau af akkumulering for sine jævnaldrende, og 50 er gennemsnittet.
Opdateringsfrekvens: Dagligt
Se Ownership Explorer, som giver en liste over højest rangerende virksomheder.
Institutionel Put/Call-forhold
Ud over at indberette standardaktie- og gældsudstedelser skal institutter med mere end 100 mill. aktiver under forvaltning også oplyse deres put- og call-optionsbeholdninger. Da salgsoptioner generelt indikerer negativ stemning, og købsoptioner indikerer positiv stemning, kan vi få en fornemmelse af den overordnede institutionelle stemning ved at plotte forholdet mellem put og kald. Diagrammet til højre viser det historiske put/call-forhold for dette instrument.
Brug af Put/Call Ratio som en indikator for investorernes stemning overvinder en af de vigtigste mangler ved at bruge totalt institutionelt ejerskab, som er, at en betydelig mængde af aktiver under forvaltning investeres passivt for at spore indekser. Passivt forvaltede fonde køber typisk ikke optioner, så indikatoren for put/call-forholdet følger mere nøje følelsen af aktivt forvaltede fonde.
13F og NPORT arkivering
Detaljer om 13F-arkivering er gratis. Detaljer om NP-ansøgninger kræver et premium-medlemskab. Grønne rækker angiver nye positioner. Røde rækker angiver lukkede positioner. Klik på linket ikon for at se den fulde transaktionshistorik.
Opgrader
for at låse premium-data op og eksportere til Excel ![]() .
.
| Fil dato | Kilde | Investor | Type | Gennemsnitlig pris (Øst) |
Aktier | Δ Aktier (%) |
Rapporteret Værdi ($1000) |
Δ Værdi (%) |
Port Alloc (%) |
|
|---|---|---|---|---|---|---|---|---|---|---|
| 2025-07-29 | 13F | Manchester Financial Inc | 13.695 | 49,92 | 965 | 65,81 | ||||
| 2025-08-13 | 13F | Baird Financial Group, Inc. | 36.662 | -9,65 | 2.584 | -0,08 | ||||
| 2025-07-31 | 13F | Oppenheimer & Co Inc | 9.150 | 142,96 | 645 | 169,46 | ||||
| 2025-07-17 | 13F | HCR Wealth Advisors | 25.714 | 0,00 | 1.812 | 10,62 | ||||
| 2025-07-11 | 13F | Diversified Trust Co | 4.800 | 0,00 | 338 | 10,82 | ||||
| 2025-07-30 | 13F | Prosperity Financial Group, Inc. | 10.856 | -5,89 | 765 | 3,95 | ||||
| 2025-08-04 | 13F | Waterfront Wealth Inc. | 101.183 | 0,22 | 7.130 | 10,83 | ||||
| 2025-07-28 | 13F | WealthPLAN Partners, LLC | 6.129 | 0,02 | 432 | 10,51 | ||||
| 2025-08-13 | 13F | Kayne Anderson Rudnick Investment Management Llc | 397.971 | -48,76 | 28.029 | -43,46 | ||||
| 2025-07-14 | 13F | S.A. Mason LLC | 621 | 0,32 | 44 | 10,26 | ||||
| 2025-08-12 | 13F | J.w. Cole Advisors, Inc. | 6.472 | 4,10 | 456 | 15,15 | ||||
| 2025-08-12 | 13F | MAI Capital Management | 8.670 | 0,00 | 611 | 10,51 | ||||
| 2025-08-14 | 13F | Susquehanna International Group, Llp | 0 | -100,00 | 0 | |||||
| 2025-08-14 | 13F | Mariner, LLC | 4.535 | 0,11 | 320 | 10,76 | ||||
| 2025-08-08 | 13F | Empower Advisory Group, LLC | 7.027 | 0,00 | 495 | 10,74 | ||||
| 2025-07-25 | 13F | Cwm, Llc | 17.292 | 0,00 | 1 | 0,00 | ||||
| 2025-07-10 | 13F | Wealth Enhancement Advisory Services, Llc | 2.896 | 206 | ||||||
| 2025-08-07 | 13F | Runnymede Capital Advisors, Inc. | 0 | -100,00 | 0 | |||||
| 2025-08-11 | 13F | Perennial Investment Advisors, LLC | 5.053 | 0,00 | 356 | 10,90 | ||||
| 2025-07-18 | 13F | QTR Family Wealth, LLC | 10.293 | -0,15 | 725 | 10,52 | ||||
| 2025-07-18 | 13F | First Pacific Financial | 456 | 0,00 | 32 | 10,34 | ||||
| 2025-08-06 | 13F | Wedbush Securities Inc | 16.050 | -10,90 | 1 | 0,00 | ||||
| 2025-08-14 | 13F | Great Valley Advisor Group, Inc. | 4.067 | 0,00 | 287 | 10,42 | ||||
| 2025-07-29 | 13F | Stephens Inc /ar/ | 4.297 | 0,00 | 303 | 10,62 | ||||
| 2025-07-31 | 13F | Leavell Investment Management, Inc. | 20.046 | 0,00 | 1.417 | 10,63 | ||||
| 2025-08-14 | 13F | Raymond James Financial Inc | 47.619 | -3,13 | 3.356 | 7,12 | ||||
| 2025-07-11 | 13F | Seacrest Wealth Management, Llc | 10.722 | -2,56 | 756 | 7,70 | ||||
| 2025-08-12 | 13F | Steward Partners Investment Advisory, Llc | 8.757 | -3,15 | 617 | 7,12 | ||||
| 2025-07-22 | 13F | Merit Financial Group, LLC | 17.314 | -1,34 | 1.220 | 9,12 | ||||
| 2025-07-07 | 13F | RDA Financial Network | 3.901 | -1,74 | 275 | 8,73 | ||||
| 2025-08-08 | 13F | Thoroughbred Financial Services, Llc | 14.050 | 0,01 | 1 | |||||
| 2025-08-13 | 13F | Russell Investments Group, Ltd. | 0 | -100,00 | 0 | |||||
| 2025-07-16 | 13F | ORG Partners LLC | 181 | 13 | ||||||
| 2025-07-22 | 13F | Wealthcare Advisory Partners LLC | 4.445 | -0,67 | 313 | 9,82 | ||||
| 2025-07-29 | 13F | Werba Rubin Papier Wealth Management | 3.464 | 0,00 | 244 | 10,91 | ||||
| 2025-07-11 | 13F | Caldwell Securities, Inc | 3.330 | 0,00 | 235 | 10,38 | ||||
| 2025-08-08 | 13F | Cetera Investment Advisers | 13.051 | -10,38 | 920 | -0,86 | ||||
| 2025-08-13 | 13F | Northwestern Mutual Wealth Management Co | 7.664 | -0,10 | 540 | 10,66 | ||||
| 2025-08-14 | 13F | Stifel Financial Corp | 120.487 | 25,91 | 8.491 | 39,25 | ||||
| 2025-08-19 | 13F | Advisory Services Network, LLC | 4.391 | -7,58 | 316 | 4,30 | ||||
| 2025-08-19 | 13F | National Asset Management, Inc. | 198.963 | -20,84 | 14.021 | -15,65 | ||||
| 2025-07-02 | 13F | Capital Market Strategies LLC | 17.275 | -16,00 | 1.217 | -7,10 | ||||
| 2025-07-23 | 13F | Kingswood Wealth Advisors, Llc | 3.159 | 223 | ||||||
| 2025-07-29 | 13F | Private Trust Co Na | 2.746 | -42,19 | 194 | -36,09 | ||||
| 2025-07-30 | 13F | Onyx Bridge Wealth Group LLC | 116.278 | -3,71 | 8.197 | 6,50 | ||||
| 2025-07-14 | 13F | Toth Financial Advisory Corp | 180 | 0,00 | 13 | 9,09 | ||||
| 2025-08-14 | 13F | Evergreen Capital Management Llc | 13.552 | 0,00 | 958 | 10,64 | ||||
| 2025-08-12 | 13F | Atlas Capital Advisors Llc | 13.880 | 0,00 | 978 | 10,63 | ||||
| 2025-07-15 | 13F | Wealth Effects Llc | 0 | -100,00 | 0 | |||||
| 2025-08-12 | 13F | Proequities, Inc. | 0 | 0 | ||||||
| 2025-08-14 | 13F | UBS Group AG | 105 | -97,14 | 7 | -97,00 | ||||
| 2025-07-31 | 13F | Cambridge Investment Research Advisors, Inc. | 45.730 | 17,53 | 3 | 50,00 | ||||
| 2025-07-30 | 13F | Pacific Sun Financial Corp | 3.540 | 0,00 | 249 | 10,67 | ||||
| 2025-08-01 | 13F | Gwn Securities Inc. | 0 | -100,00 | 0 | |||||
| 2025-08-13 | 13F | Cresset Asset Management, LLC | 3.929 | 0,26 | 278 | 10,80 | ||||
| 2025-08-14 | 13F | Bienville Capital Management, LLC | 6.600 | 0,00 | 466 | 10,69 | ||||
| 2025-08-14 | 13F | Comerica Bank | 5.106 | 0,00 | 360 | 10,46 | ||||
| 2025-08-15 | 13F | Kestra Advisory Services, LLC | 35.427 | 0,11 | 2.497 | 10,74 | ||||
| 2025-08-14 | 13F | Bank Of America Corp /de/ | 82.502 | -4,10 | 5.814 | 6,04 | ||||
| 2025-08-12 | 13F | Global Retirement Partners, LLC | 190 | 13 | ||||||
| 2025-08-06 | 13F | Commonwealth Equity Services, Llc | 12.617 | -38,31 | 1 | -100,00 | ||||
| 2025-08-06 | 13F | Prospera Financial Services Inc | 9.218 | 5,71 | 650 | 16,94 | ||||
| 2025-07-28 | 13F | Mutual Advisors, LLC | 52.415 | -1,32 | 3.787 | 13,56 | ||||
| 2025-07-30 | 13F | Evermay Wealth Management Llc | 4.342 | 0,00 | 307 | 10,47 | ||||
| 2025-09-11 | 13F | Silicon Valley Capital Partners | 634 | 0,32 | 45 | 10,00 | ||||
| 2025-07-25 | 13F | Commonwealth Financial Services, LLC | 5.410 | -6,50 | 381 | 3,53 | ||||
| 2025-07-08 | 13F | Legacy Private Trust Co. | 59.095 | -24,34 | 4.164 | -16,32 | ||||
| 2025-07-10 | 13F | Focus Financial Network, Inc. | 3.489 | -0,03 | 247 | 10,81 | ||||
| 2025-07-30 | 13F | Eqis Capital Management, Inc. | 41.436 | -2,77 | 2.920 | 7,51 | ||||
| 2025-07-22 | 13F/A | Duncan Williams Asset Management, LLC | 31.688 | 0,00 | 2.233 | 10,60 | ||||
| 2025-08-13 | 13F | JBR Co Financial Management Inc | 2.845 | 200 | ||||||
| 2025-07-21 | 13F | DHJJ Financial Advisors, Ltd. | 4 | 0,00 | 0 | |||||
| 2025-07-01 | 13F | Harbor Investment Advisory, Llc | 124 | 0,00 | 9 | 14,29 | ||||
| 2025-07-24 | 13F | JNBA Financial Advisors | 1.050 | 0,00 | 74 | 12,12 | ||||
| 2025-08-11 | 13F | Hopwood Financial Services, Inc. | 800 | 0,00 | 56 | 12,00 | ||||
| 2025-08-13 | 13F | Navis Wealth Advisors, LLC | 12.336 | -0,36 | 869 | 10,28 | ||||
| 2025-08-14 | 13F/A | Rockefeller Capital Management L.P. | 12.547 | -26,65 | 884 | -18,82 | ||||
| 2025-04-29 | 13F | Lee Danner & Bass Inc | 0 | -100,00 | 0 | |||||
| 2025-08-14 | 13F | Royal Bank Of Canada | 16.684 | -34,81 | 1.176 | -27,90 | ||||
| 2025-08-14 | 13F | Financial Engines Advisors L.L.C. | 4.396 | -50,00 | 310 | -44,64 | ||||
| 2025-08-13 | 13F | Cerity Partners LLC | 29.970 | 1,00 | 2.112 | 11,69 | ||||
| 2025-08-14 | 13F | Mercer Global Advisors Inc /adv | 41.492 | 87,14 | 2.924 | 107,01 | ||||
| 2025-08-15 | 13F | Morgan Stanley | 811.143 | -0,94 | 57.160 | 9,56 | ||||
| 2025-08-01 | 13F | Envestnet Asset Management Inc | 99.856 | -34,69 | 7.037 | -27,78 | ||||
| 2025-08-19 | 13F | Newbridge Financial Services Group, Inc. | 34 | 0,00 | 2 | 0,00 | ||||
| 2025-08-05 | 13F | Bank Of Montreal /can/ | 2.144 | 0,00 | 151 | 11,03 | ||||
| 2025-08-06 | 13F | LeClair Wealth Partners LLC | 3.686 | 0,00 | 260 | 10,68 | ||||
| 2025-05-09 | 13F | Atria Wealth Solutions, Inc. | 0 | -100,00 | 0 | -100,00 | ||||
| 2025-08-13 | 13F | First Trust Advisors Lp | 5.177 | 365 | ||||||
| 2025-08-11 | 13F | WPG Advisers, LLC | 352 | 0,00 | 25 | 9,09 | ||||
| 2025-08-14 | 13F | Fmr Llc | 9.608 | -9,59 | 677 | 0,00 | ||||
| 2025-08-11 | 13F | HHM Wealth Advisors, LLC | 2.848 | 184,80 | 201 | 217,46 | ||||
| 2025-08-08 | 13F | Hartland & Co., LLC | 4.745 | 0,00 | 334 | 10,60 | ||||
| 2025-08-14 | 13F | Mml Investors Services, Llc | 5.587 | -4,59 | 0 | |||||
| 2025-08-05 | 13F | Bank of New York Mellon Corp | 83.298 | -11,66 | 5.870 | -2,31 | ||||
| 2025-08-14 | 13F | Silvercrest Asset Management Group Llc | 16.375 | 0,00 | 1.154 | 10,55 | ||||
| 2025-08-12 | 13F | Jpmorgan Chase & Co | 369 | 26 | ||||||
| 2025-08-11 | 13F | Synergy Investment Management, LLC | 0 | -100,00 | 0 | |||||
| 2025-07-22 | 13F | Apexium Financial, Lp | 95.065 | -0,92 | 6.718 | 9,88 | ||||
| 2025-08-15 | 13F | Equitable Holdings, Inc. | 3.460 | -1,14 | 244 | 8,97 | ||||
| 2025-08-12 | 13F | LPL Financial LLC | 289.302 | -16,71 | 20.387 | -7,89 | ||||
| 2025-08-08 | 13F | Pnc Financial Services Group, Inc. | 5.610 | 0,00 | 395 | 10,64 | ||||
| 2025-07-16 | 13F | West Branch Capital LLC | 206 | 0,00 | 15 | 7,69 | ||||
| 2025-09-04 | 13F/A | Advisor Group Holdings, Inc. | 59.868 | 0,14 | 4.219 | 10,76 | ||||
| 2025-07-31 | 13F | Gill Capital Partners, Llc | 54.366 | -10,36 | 3.831 | -0,85 | ||||
| 2025-07-30 | 13F | Patten Group, Inc. | 12.860 | -0,79 | 906 | 9,69 | ||||
| 2025-08-11 | 13F | Principal Securities, Inc. | 141 | 0,71 | 10 | 0,00 | ||||
| 2025-08-14 | 13F | Wells Fargo & Company/mn | 65.075 | -2,70 | 4.586 | 7,60 |