Grundlæggende statistik
| Institutionelle ejere | 60 total, 60 long only, 0 short only, 0 long/short - change of -4,76% MRQ |
| Gennemsnitlig porteføljeallokering | 0.2416 % - change of -3,45% MRQ |
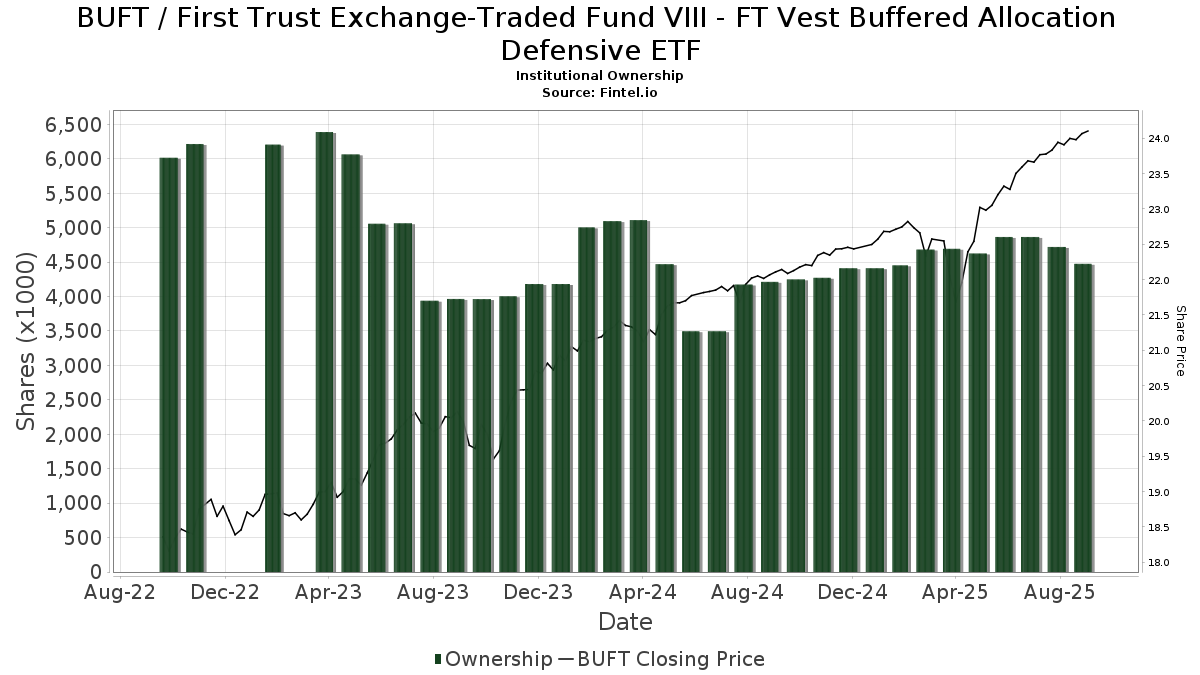
| Institutionelle aktier (lange) | 4.475.728 (ex 13D/G) - change of -0,39MM shares -8,01% MRQ |
| Institutionel værdi (lang) | $ 95.373 USD ($1000) |
Institutionelt ejerskab og aktionærer
First Trust Exchange-Traded Fund VIII - FT Vest Buffered Allocation Defensive ETF (US:BUFT) har 60 institutionelle ejere og aktionærer, der har indsendt 13D/G- eller 13F-formularer til Securities Exchange Commission (SEC). Disse institutioner har i alt 4,475,728 aktier. Største aktionærer omfatter Glen Eagle Advisors, LLC, Centennial Wealth Advisory LLC, Envestnet Asset Management Inc, Cwm, Llc, Geneos Wealth Management Inc., LPL Financial LLC, Cetera Investment Advisers, Synovus Financial Corp, Assetmark, Inc, and Lunt Capital Management, Inc. .
First Trust Exchange-Traded Fund VIII - FT Vest Buffered Allocation Defensive ETF (BATS:BUFT) institutionel ejerskabsstruktur viser aktuelle positioner i virksomheden efter institutioner og fonde, samt seneste ændringer i positionsstørrelse. Større aktionærer kan omfatte individuelle investorer, investeringsforeninger, hedgefonde eller institutioner. Skema 13D angiver, at investoren besidder (eller besidder) mere end 5 % af virksomheden og har til hensigt (eller har til hensigt at) aktivt at forfølge en ændring i forretningsstrategi. Skema 13G indikerer en passiv investering på over 5%.
The share price as of September 15, 2025 is 24,10 / share. Previously, on September 16, 2024, the share price was 22,10 / share. This represents an increase of 9,07% over that period.
Fondens stemningsscore
Fund Sentiment Score (fka Ownership Accumulation Score) finder de aktier, der bliver mest købt af fonde. Det er resultatet af en sofistikeret, multi-faktor kvantitativ model, der identificerer virksomheder med de højeste niveauer af institutionel akkumulering. Scoringsmodellen bruger en kombination af den samlede stigning i oplyste ejere, ændringerne i porteføljeallokeringer i disse ejere og andre målinger. Tallet går fra 0 til 100, hvor højere tal indikerer et højere niveau af akkumulering for sine jævnaldrende, og 50 er gennemsnittet.
Opdateringsfrekvens: Dagligt
Se Ownership Explorer, som giver en liste over højest rangerende virksomheder.
Institutionel Put/Call-forhold
Ud over at indberette standardaktie- og gældsudstedelser skal institutter med mere end 100 mill. aktiver under forvaltning også oplyse deres put- og call-optionsbeholdninger. Da salgsoptioner generelt indikerer negativ stemning, og købsoptioner indikerer positiv stemning, kan vi få en fornemmelse af den overordnede institutionelle stemning ved at plotte forholdet mellem put og kald. Diagrammet til højre viser det historiske put/call-forhold for dette instrument.
Brug af Put/Call Ratio som en indikator for investorernes stemning overvinder en af de vigtigste mangler ved at bruge totalt institutionelt ejerskab, som er, at en betydelig mængde af aktiver under forvaltning investeres passivt for at spore indekser. Passivt forvaltede fonde køber typisk ikke optioner, så indikatoren for put/call-forholdet følger mere nøje følelsen af aktivt forvaltede fonde.
13F og NPORT arkivering
Detaljer om 13F-arkivering er gratis. Detaljer om NP-ansøgninger kræver et premium-medlemskab. Grønne rækker angiver nye positioner. Røde rækker angiver lukkede positioner. Klik på linket ikon for at se den fulde transaktionshistorik.
Opgrader
for at låse premium-data op og eksportere til Excel ![]() .
.
| Fil dato | Kilde | Investor | Type | Gennemsnitlig pris (Øst) |
Aktier | Δ Aktier (%) |
Rapporteret Værdi ($1000) |
Δ Værdi (%) |
Port Alloc (%) |
|
|---|---|---|---|---|---|---|---|---|---|---|
| 2025-05-09 | 13F | Goldman Sachs Group Inc | 0 | -100,00 | 0 | |||||
| 2025-07-10 | 13F | Wealth Enhancement Advisory Services, Llc | 17.567 | -5,69 | 415 | -0,96 | ||||
| 2025-08-12 | 13F | Jaffetilchin Investment Partners, LLC | 16.991 | 0,00 | 400 | 4,99 | ||||
| 2025-08-04 | 13F | Atria Investments Llc | 30.019 | 0,51 | 707 | 5,52 | ||||
| 2025-08-18 | 13F | Geneos Wealth Management Inc. | 223.464 | 65,86 | 5.265 | 74,07 | ||||
| 2025-08-11 | 13F | Principal Securities, Inc. | 0 | -100,00 | 0 | |||||
| 2025-08-14 | 13F | Old Mission Capital Llc | 33.384 | -9,82 | 787 | -5,30 | ||||
| 2025-05-08 | 13F | Armis Advisers, LLC | 0 | -100,00 | 0 | |||||
| 2025-08-06 | 13F | Financial Advisory Corp /ut/ /adv | 34.468 | -0,99 | 1 | |||||
| 2025-08-14 | 13F | Glen Eagle Advisors, LLC | 1.003.870 | -8,24 | 23.651 | -3,69 | ||||
| 2025-08-12 | 13F | Wood Tarver Financial Group, LLC | 2.766 | 0,00 | 0 | -100,00 | ||||
| 2025-07-11 | 13F | Quad-Cities Investment Group, LLC | 15.391 | 0,00 | 363 | 4,93 | ||||
| 2025-05-16 | 13F/A | Kestra Investment Management, LLC | 0 | -100,00 | 0 | |||||
| 2025-05-09 | 13F | Atria Wealth Solutions, Inc. | 0 | -100,00 | 0 | -100,00 | ||||
| 2025-07-21 | 13F | DHJJ Financial Advisors, Ltd. | 2.555 | 0,00 | 60 | 5,26 | ||||
| 2025-04-23 | 13F | International Assets Investment Management, Llc | 0 | -100,00 | 0 | -100,00 | ||||
| 2025-07-28 | 13F | Lunt Capital Management, Inc. | 109.857 | -13,09 | 2.588 | -8,78 | ||||
| 2025-08-18 | 13F | N.E.W. Advisory Services LLC | 1.000 | -50,00 | 24 | -47,73 | ||||
| 2025-08-14 | 13F | GWM Advisors LLC | 10.300 | -1,55 | 243 | 3,42 | ||||
| 2025-08-14 | 13F | Great Valley Advisor Group, Inc. | 73.953 | 1,66 | 1.742 | 6,74 | ||||
| 2025-08-12 | 13F | Proequities, Inc. | 0 | 0 | ||||||
| 2025-08-15 | 13F | Kestra Advisory Services, LLC | 10.112 | -8,11 | 238 | -3,64 | ||||
| 2025-08-12 | 13F | SRS Capital Advisors, Inc. | 768 | -36,42 | 18 | -33,33 | ||||
| 2025-07-21 | 13F | Ameritas Advisory Services, LLC | 4.587 | -80,66 | 108 | -79,70 | ||||
| 2025-08-08 | 13F | Cetera Investment Advisers | 179.290 | -2,37 | 4.224 | 2,47 | ||||
| 2025-07-16 | 13F | American National Bank | 269 | 0,00 | 6 | 0,00 | ||||
| 2025-07-17 | 13F | Janney Montgomery Scott LLC | 10.105 | -6,14 | 0 | |||||
| 2025-07-24 | 13F | IFP Advisors, Inc | 15.280 | 78,05 | 360 | 86,98 | ||||
| 2025-09-04 | 13F/A | Advisor Group Holdings, Inc. | 85.844 | 9,16 | 2.011 | 13,88 | ||||
| 2025-07-29 | 13F | Private Trust Co Na | 1.500 | 0,00 | 35 | 6,06 | ||||
| 2025-07-16 | 13F | Novem Group | 0 | -100,00 | 0 | |||||
| 2025-08-14 | 13F | Integrated Wealth Concepts LLC | 33.558 | 6,11 | 791 | 11,42 | ||||
| 2025-08-04 | 13F | Arkadios Wealth Advisors | 9.069 | 214 | ||||||
| 2025-07-18 | 13F | Truist Financial Corp | 16.306 | -0,21 | 384 | 4,92 | ||||
| 2025-08-08 | 13F | Avantax Advisory Services, Inc. | 10.538 | 4,80 | 248 | 10,22 | ||||
| 2025-07-10 | 13F | Marshall Financial Group LLC | 61.985 | -9,41 | 1.461 | -4,89 | ||||
| 2025-07-17 | 13F | Nelson, Van Denburg & Campbell Wealth Management Group, LLC | 31.549 | -0,21 | 743 | 4,80 | ||||
| 2025-08-13 | 13F | Gateway Wealth Partners, LLC | 23.452 | -5,78 | 553 | -1,08 | ||||
| 2025-08-14 | 13F | Citadel Advisors Llc | 29.525 | 696 | ||||||
| 2025-08-06 | 13F | Legacy Wealth Managment, LLC/ID | 80.030 | 40,47 | 1.886 | 47,50 | ||||
| 2025-08-13 | 13F | Capital Analysts, Inc. | 2.688 | 0,00 | 0 | |||||
| 2025-04-21 | 13F | Envestnet Portfolio Solutions, Inc. | 0 | -100,00 | 0 | |||||
| 2025-07-31 | 13F | Cambridge Investment Research Advisors, Inc. | 27.866 | -0,50 | 1 | |||||
| 2025-08-29 | 13F | Evolution Wealth Management Inc. | 8.677 | 204 | ||||||
| 2025-08-06 | 13F | AE Wealth Management LLC | 0 | -100,00 | 0 | |||||
| 2025-08-06 | 13F | Legacy Investment Solutions, LLC | 80.030 | 68,24 | 1.886 | 74,54 | ||||
| 2025-08-11 | 13F | Aptus Capital Advisors, LLC | 48.095 | -4,16 | 1.133 | 0,62 | ||||
| 2025-08-19 | 13F | Advisory Services Network, LLC | 8.859 | 211 | ||||||
| 2025-07-25 | 13F | Cwm, Llc | 226.900 | -1,33 | 5 | 0,00 | ||||
| 2025-08-14 | 13F | Synovus Financial Corp | 164.412 | -1,20 | 3.874 | 3,69 | ||||
| 2025-08-05 | 13F | GPS Wealth Strategies Group, LLC | 32.718 | -3,98 | 771 | 0,79 | ||||
| 2025-08-08 | 13F | Meridian Wealth Management, LLC | 11.507 | 0,00 | 271 | 5,04 | ||||
| 2025-08-12 | 13F | Global Retirement Partners, LLC | 1.128 | 0,45 | 27 | 4,00 | ||||
| 2025-07-21 | 13F | Barrett & Company, Inc. | 12.098 | 0,00 | 285 | 5,17 | ||||
| 2025-08-14 | 13F | Guardian Wealth Advisors, Llc / Nc | 6.520 | -7,25 | 154 | -2,55 | ||||
| 2025-07-07 | 13F | Nova Wealth Management, Inc. | 0 | -100,00 | 0 | -100,00 | ||||
| 2025-07-28 | 13F | Harbour Investments, Inc. | 6.260 | 0,00 | 147 | 5,00 | ||||
| 2025-08-11 | 13F | Private Advisor Group, LLC | 0 | -100,00 | 0 | |||||
| 2025-05-14 | 13F | Caitlin John, LLC | 0 | -100,00 | 0 | |||||
| 2025-08-14 | 13F | Financial Network Wealth Advisors LLC | 45.054 | -0,05 | 1.061 | 4,95 | ||||
| 2025-05-15 | 13F | Mariner, LLC | 0 | -100,00 | 0 | |||||
| 2025-08-14 | 13F | Susquehanna International Group, Llp | 31.378 | 739 | ||||||
| 2025-07-17 | 13F | Centennial Wealth Advisory LLC | 631.353 | -0,79 | 14.875 | 4,12 | ||||
| 2025-07-29 | 13F | Financial Guidance Group, Inc. | 41.575 | -3,65 | 980 | 1,14 | ||||
| 2025-07-07 | 13F | Trust Co | 1.584 | 0,00 | 37 | 5,71 | ||||
| 2025-08-29 | 13F | Centaurus Financial, Inc. | 20.263 | 1,05 | 0 | |||||
| 2025-07-30 | 13F | IMG Wealth Management, Inc. | 1.141 | 0,00 | 27 | 4,00 | ||||
| 2025-08-01 | 13F | Envestnet Asset Management Inc | 360.007 | -9,64 | 8.482 | -5,17 | ||||
| 2025-08-12 | 13F | LPL Financial LLC | 212.630 | -43,72 | 5.010 | -40,93 | ||||
| 2025-08-14 | 13F | UBS Group AG | 0 | -100,00 | 0 | |||||
| 2025-08-04 | 13F | Assetmark, Inc | 117.333 | 17,76 | 2.764 | 23,61 | ||||
| 2025-07-14 | 13F | Kfg Wealth Management, Llc | 9.651 | 0,00 | 227 | 5,09 | ||||
| 2025-08-06 | 13F | Valtinson Bruner Financial Planning LLC | 36.419 | 0,00 | 858 | 5,02 | ||||
| 2025-08-13 | 13F | Townsquare Capital Llc | 0 | -100,00 | 0 | |||||
| 2025-07-11 | 13F | SILVER OAK SECURITIES, Inc | 48.694 | 0,27 | 1.147 | 5,52 | ||||
| 2025-08-06 | 13F | Commonwealth Equity Services, Llc | 101.536 | -56,43 | 2 | -60,00 |