Grundlæggende statistik
| Institutionelle ejere | 88 total, 88 long only, 0 short only, 0 long/short - change of -3,30% MRQ |
| Gennemsnitlig porteføljeallokering | 0.2740 % - change of 14,09% MRQ |
| Institutionelle aktier (lange) | 7.830.402 (ex 13D/G) - change of -0,31MM shares -3,83% MRQ |
| Institutionel værdi (lang) | $ 157.702 USD ($1000) |
Institutionelt ejerskab og aktionærer
First Trust Exchange-Traded Fund VIII - FT Vest Buffered Allocation Growth ETF (US:BUFG) har 88 institutionelle ejere og aktionærer, der har indsendt 13D/G- eller 13F-formularer til Securities Exchange Commission (SEC). Disse institutioner har i alt 7,830,402 aktier. Største aktionærer omfatter Commonwealth Equity Services, Llc, Envestnet Asset Management Inc, LPL Financial LLC, Centennial Wealth Advisory LLC, Cetera Investment Advisers, Advisor Group Holdings, Inc., FreeGulliver LLC, Cwm, Llc, Synovus Financial Corp, and Assetmark, Inc .
First Trust Exchange-Traded Fund VIII - FT Vest Buffered Allocation Growth ETF (BATS:BUFG) institutionel ejerskabsstruktur viser aktuelle positioner i virksomheden efter institutioner og fonde, samt seneste ændringer i positionsstørrelse. Større aktionærer kan omfatte individuelle investorer, investeringsforeninger, hedgefonde eller institutioner. Skema 13D angiver, at investoren besidder (eller besidder) mere end 5 % af virksomheden og har til hensigt (eller har til hensigt at) aktivt at forfølge en ændring i forretningsstrategi. Skema 13G indikerer en passiv investering på over 5%.
The share price as of September 15, 2025 is 26,75 / share. Previously, on September 16, 2024, the share price was 23,80 / share. This represents an increase of 12,39% over that period.

Fondens stemningsscore
Fund Sentiment Score (fka Ownership Accumulation Score) finder de aktier, der bliver mest købt af fonde. Det er resultatet af en sofistikeret, multi-faktor kvantitativ model, der identificerer virksomheder med de højeste niveauer af institutionel akkumulering. Scoringsmodellen bruger en kombination af den samlede stigning i oplyste ejere, ændringerne i porteføljeallokeringer i disse ejere og andre målinger. Tallet går fra 0 til 100, hvor højere tal indikerer et højere niveau af akkumulering for sine jævnaldrende, og 50 er gennemsnittet.
Opdateringsfrekvens: Dagligt
Se Ownership Explorer, som giver en liste over højest rangerende virksomheder.
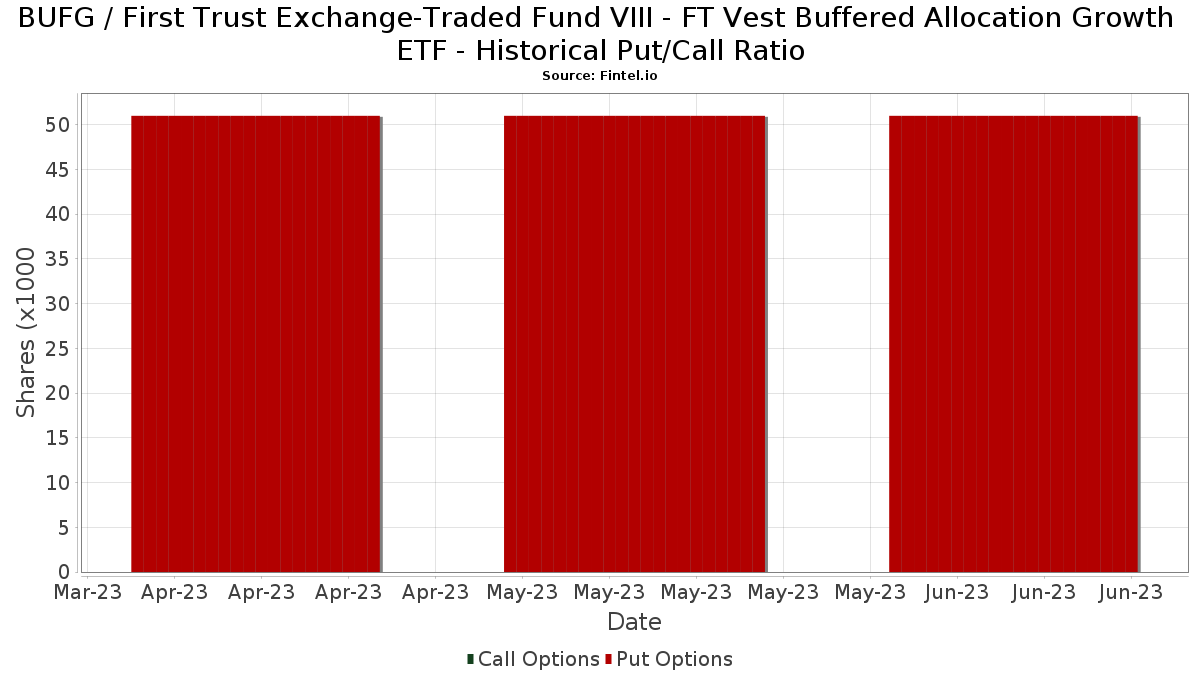
Institutionel Put/Call-forhold
Ud over at indberette standardaktie- og gældsudstedelser skal institutter med mere end 100 mill. aktiver under forvaltning også oplyse deres put- og call-optionsbeholdninger. Da salgsoptioner generelt indikerer negativ stemning, og købsoptioner indikerer positiv stemning, kan vi få en fornemmelse af den overordnede institutionelle stemning ved at plotte forholdet mellem put og kald. Diagrammet til højre viser det historiske put/call-forhold for dette instrument.
Brug af Put/Call Ratio som en indikator for investorernes stemning overvinder en af de vigtigste mangler ved at bruge totalt institutionelt ejerskab, som er, at en betydelig mængde af aktiver under forvaltning investeres passivt for at spore indekser. Passivt forvaltede fonde køber typisk ikke optioner, så indikatoren for put/call-forholdet følger mere nøje følelsen af aktivt forvaltede fonde.
13F og NPORT arkivering
Detaljer om 13F-arkivering er gratis. Detaljer om NP-ansøgninger kræver et premium-medlemskab. Grønne rækker angiver nye positioner. Røde rækker angiver lukkede positioner. Klik på linket ikon for at se den fulde transaktionshistorik.
Opgrader
for at låse premium-data op og eksportere til Excel ![]() .
.
| Fil dato | Kilde | Investor | Type | Gennemsnitlig pris (Øst) |
Aktier | Δ Aktier (%) |
Rapporteret Værdi ($1000) |
Δ Værdi (%) |
Port Alloc (%) |
|
|---|---|---|---|---|---|---|---|---|---|---|
| 2025-07-10 | 13F | Wealth Enhancement Advisory Services, Llc | 111.783 | -0,44 | 2.881 | 7,87 | ||||
| 2025-05-05 | 13F | Private Advisor Group, LLC | 0 | -100,00 | 0 | |||||
| 2025-07-22 | 13F | Wealthcare Advisory Partners LLC | 21.273 | 0,00 | 543 | 7,31 | ||||
| 2025-07-14 | 13F | Iams Wealth Management, Llc | 25.776 | 0,00 | 658 | 7,34 | ||||
| 2025-08-13 | 13F | Jones Financial Companies Lllp | 3.900 | 99 | ||||||
| 2025-08-07 | 13F | PFG Advisors | 22.125 | 7,38 | 565 | 15,31 | ||||
| 2025-07-17 | 13F | Black Point Wealth Management | 9.255 | -68,89 | 236 | -66,62 | ||||
| 2025-07-11 | 13F | Farther Finance Advisors, LLC | 0 | -100,00 | 0 | |||||
| 2025-09-03 | 13F | American Trust | 18.562 | 474 | ||||||
| 2025-07-21 | 13F | DHJJ Financial Advisors, Ltd. | 20.662 | 0,15 | 528 | 7,55 | ||||
| 2025-08-01 | 13F | Transcend Wealth Collective, Llc | 75.005 | 49,68 | 1.916 | 60,65 | ||||
| 2025-08-18 | 13F | Geneos Wealth Management Inc. | 212.705 | 67,22 | 5.432 | 79,51 | ||||
| 2025-07-23 | 13F | REAP Financial Group, LLC | 2.283 | -2,39 | 58 | 5,45 | ||||
| 2025-08-12 | 13F | SRS Capital Advisors, Inc. | 300 | 0,00 | 8 | 0,00 | ||||
| 2025-08-01 | 13F | Gwn Securities Inc. | 0 | -100,00 | 0 | |||||
| 2025-08-12 | 13F | Jpmorgan Chase & Co | 0 | -100,00 | 0 | |||||
| 2025-08-15 | 13F | Kestra Advisory Services, LLC | 53.592 | 5,13 | 1.369 | 12,87 | ||||
| 2025-07-17 | 13F | Kelly Financial Services LLC | 8.342 | 213 | ||||||
| 2025-08-08 | 13F | Larson Financial Group LLC | 330 | 0,00 | 8 | 14,29 | ||||
| 2025-08-14 | 13F | Jane Street Group, Llc | 0 | -100,00 | 0 | |||||
| 2025-07-17 | 13F | Nelson, Van Denburg & Campbell Wealth Management Group, LLC | 18.726 | 18,42 | 478 | 27,13 | ||||
| 2025-08-04 | 13F | Arkadios Wealth Advisors | 8.416 | 215 | ||||||
| 2025-08-14 | 13F | Integrated Wealth Concepts LLC | 145.503 | 4,41 | 3.716 | 12,10 | ||||
| 2025-08-14 | 13F | Mariner, LLC | 28.719 | 7,45 | 733 | 15,43 | ||||
| 2025-08-12 | 13F | FreeGulliver LLC | 328.513 | -1,16 | 8.390 | 6,12 | ||||
| 2025-08-06 | 13F | Legacy Wealth Managment, LLC/ID | 44 | -32,31 | 1 | 0,00 | ||||
| 2025-07-10 | 13F | Signal Advisors Wealth, LLC | 10.296 | -25,89 | 263 | -20,61 | ||||
| 2025-08-06 | 13F | Legacy Investment Solutions, LLC | 44 | -67,16 | 1 | -66,67 | ||||
| 2025-08-11 | 13F | Aptus Capital Advisors, LLC | 60.315 | -2,95 | 1.540 | 4,19 | ||||
| 2025-08-19 | 13F | Advisory Services Network, LLC | 103.624 | -6,75 | 2.691 | 1,82 | ||||
| 2025-08-14 | 13F/A | Rockefeller Capital Management L.P. | 24.935 | -30,14 | 637 | -25,09 | ||||
| 2025-08-14 | 13F | GWM Advisors LLC | 440 | 0,00 | 11 | 10,00 | ||||
| 2025-08-12 | 13F | Global Retirement Partners, LLC | 2.364 | 0,30 | 60 | 5,26 | ||||
| 2025-08-13 | 13F | Townsquare Capital Llc | 0 | -100,00 | 0 | |||||
| 2025-08-06 | 13F | Valtinson Bruner Financial Planning LLC | 107.921 | -0,00 | 2.756 | 7,36 | ||||
| 2025-08-13 | 13F | Capital Analysts, Inc. | 0 | -100,00 | 0 | |||||
| 2025-08-06 | 13F | Wedbush Securities Inc | 8.015 | 0 | ||||||
| 2025-07-22 | 13F | Merit Financial Group, LLC | 0 | -100,00 | 0 | |||||
| 2025-08-05 | 13F | GPS Wealth Strategies Group, LLC | 0 | -100,00 | 0 | |||||
| 2025-08-15 | 13F | Fsb Premier Wealth Management, Inc. | 52.944 | -4,45 | 1.352 | 2,58 | ||||
| 2025-07-14 | 13F | Kfg Wealth Management, Llc | 12.140 | -1,62 | 310 | 5,80 | ||||
| 2025-07-25 | 13F | Cwm, Llc | 277.370 | -6,37 | 7 | 0,00 | ||||
| 2025-08-14 | 13F | Old Mission Capital Llc | 19.442 | 36,96 | 497 | 47,18 | ||||
| 2025-08-12 | 13F | Jaffetilchin Investment Partners, LLC | 33.120 | 0,00 | 846 | 7,37 | ||||
| 2025-07-16 | 13F | Novem Group | 35.977 | -2,01 | 919 | 5,15 | ||||
| 2025-07-28 | 13F | Lunt Capital Management, Inc. | 103.161 | -13,61 | 2.635 | -7,25 | ||||
| 2025-08-06 | 13F | Financial Advisory Corp /ut/ /adv | 82.367 | -8,39 | 2 | 0,00 | ||||
| 2025-07-30 | 13F | TFB Advisors LLC | 11.306 | 0,04 | 289 | 7,46 | ||||
| 2025-08-11 | 13F | Regal Investment Advisors LLC | 0 | -100,00 | 0 | |||||
| 2025-04-11 | 13F | Pitti Group Wealth Management, LLC | 0 | -100,00 | 0 | -100,00 | ||||
| 2025-07-21 | 13F | Ameritas Advisory Services, LLC | 31.858 | -35,01 | 814 | -30,27 | ||||
| 2025-07-21 | 13F | Ameriflex Group, Inc. | 0 | -100,00 | 0 | |||||
| 2025-07-22 | 13F | Foguth Wealth Management, LLC. | 10.296 | -25,89 | 263 | -20,61 | ||||
| 2025-08-12 | 13F | Proequities, Inc. | 0 | 0 | ||||||
| 2025-07-02 | 13F | HBW Advisory Services LLC | 9.590 | 0,00 | 245 | 7,02 | ||||
| 2025-07-16 | 13F | PFS Partners, LLC | 1.258 | 0,00 | 32 | 10,34 | ||||
| 2025-04-17 | 13F | Authentikos Wealth Advisory, LLC | 0 | -100,00 | 0 | |||||
| 2025-07-15 | 13F | World Equity Group, Inc. | 169.675 | -8,62 | 4.334 | -1,90 | ||||
| 2025-08-04 | 13F | Atria Investments Llc | 8.846 | 226 | ||||||
| 2025-08-08 | 13F | Cetera Investment Advisers | 426.838 | -2,74 | 10.901 | 4,43 | ||||
| 2025-07-17 | 13F | Janney Montgomery Scott LLC | 9.431 | 0,00 | 0 | |||||
| 2025-07-24 | 13F | IFP Advisors, Inc | 2.777 | 12,47 | 71 | 20,69 | ||||
| 2025-07-22 | 13F | Simplicity Wealth,LLC | 20.350 | 103,46 | 520 | 118,99 | ||||
| 2025-08-12 | 13F | Change Path, LLC | 12.910 | 3,45 | 330 | 11,15 | ||||
| 2025-08-14 | 13F | Mml Investors Services, Llc | 57.520 | -10,32 | 1 | 0,00 | ||||
| 2025-07-16 | 13F | American National Bank | 245 | 0,00 | 6 | 20,00 | ||||
| 2025-07-23 | 13F | Tcfg Wealth Management, Llc | 22.597 | 1,35 | 577 | 8,87 | ||||
| 2025-08-08 | 13F | Avantax Advisory Services, Inc. | 152.954 | -9,75 | 3.906 | -3,10 | ||||
| 2025-07-30 | 13F | Brookstone Capital Management | 22.957 | 32,79 | 586 | 42,58 | ||||
| 2025-08-13 | 13F | Gateway Wealth Partners, LLC | 20.948 | -9,82 | 535 | -3,08 | ||||
| 2025-07-25 | 13F | Atria Wealth Solutions, Inc. | 0 | -100,00 | 0 | |||||
| 2025-07-30 | 13F | Onyx Bridge Wealth Group LLC | 30.322 | -3,70 | 774 | 3,34 | ||||
| 2025-07-30 | 13F | Crewe Advisors LLC | 11.497 | 294 | ||||||
| 2025-08-12 | 13F | Tradition Wealth Management, LLC | 65.490 | 23,47 | 1.673 | 32,59 | ||||
| 2025-07-31 | 13F | Cambridge Investment Research Advisors, Inc. | 162.034 | 0,81 | 4 | 33,33 | ||||
| 2025-08-14 | 13F | CoreCap Advisors, LLC | 46.844 | -0,81 | 1.196 | 6,50 | ||||
| 2025-08-29 | 13F | Evolution Wealth Management Inc. | 920 | 23 | ||||||
| 2025-07-23 | 13F | Kingswood Wealth Advisors, Llc | 20.975 | -63,70 | 536 | -61,06 | ||||
| 2025-08-14 | 13F | Synovus Financial Corp | 272.927 | -2,82 | 6.971 | 4,34 | ||||
| 2025-08-14 | 13F | Citadel Advisors Llc | 17.208 | -60,30 | 439 | -57,42 | ||||
| 2025-08-14 | 13F | UBS Group AG | 25.385 | 3,28 | 648 | 10,96 | ||||
| 2025-08-14 | 13F | Guardian Wealth Advisors, Llc / Nc | 8.232 | -8,25 | 210 | -1,41 | ||||
| 2025-07-28 | 13F | Harbour Investments, Inc. | 29.547 | -24,97 | 755 | -19,44 | ||||
| 2025-08-14 | 13F | Harvest Investment Services, LLC | 36.352 | -9,50 | 928 | -2,83 | ||||
| 2025-07-17 | 13F | Centennial Wealth Advisory LLC | 567.207 | 4,63 | 14.489 | 12,36 | ||||
| 2025-07-23 | 13F | Ellsworth Advisors, LLC | 123.664 | 1,72 | 3.158 | 9,20 | ||||
| 2025-08-14 | 13F | Susquehanna International Group, Llp | 66.868 | -35,83 | 1.708 | -31,11 | ||||
| 2025-07-29 | 13F | Financial Guidance Group, Inc. | 29.852 | -2,05 | 762 | 5,25 | ||||
| 2025-07-11 | 13F | SILVER OAK SECURITIES, Inc | 45.773 | 0,30 | 1.169 | 8,34 | ||||
| 2025-08-05 | 13F | Sigma Planning Corp | 26.277 | 0,61 | 671 | 8,05 | ||||
| 2025-08-29 | 13F | Centaurus Financial, Inc. | 17.819 | 1,31 | 0 | |||||
| 2025-08-06 | 13F | AE Wealth Management LLC | 3.145 | 0,00 | 80 | 8,11 | ||||
| 2025-08-14 | 13F | Financial Network Wealth Advisors LLC | 22.668 | -0,04 | 579 | 7,24 | ||||
| 2025-07-30 | 13F | IMG Wealth Management, Inc. | 1.696 | -9,64 | 43 | -2,27 | ||||
| 2025-08-12 | 13F | LPL Financial LLC | 717.169 | -13,00 | 18.316 | -6,59 | ||||
| 2025-08-14 | 13F | Raymond James Financial Inc | 597 | 15 | ||||||
| 2025-08-14 | 13F | Sunbelt Securities, Inc. | 2.101 | 0,00 | 51 | 4,08 | ||||
| 2025-08-14 | 13F | Royal Bank Of Canada | 590 | 15 | ||||||
| 2025-09-04 | 13F/A | Advisor Group Holdings, Inc. | 333.964 | -8,65 | 8.509 | -2,17 | ||||
| 2025-08-01 | 13F | Envestnet Asset Management Inc | 801.978 | 9,91 | 20.483 | 18,01 | ||||
| 2025-08-04 | 13F | Assetmark, Inc | 232.252 | 16,31 | 5.932 | 24,86 | ||||
| 2025-07-25 | 13F | Envestnet Portfolio Solutions, Inc. | 0 | -100,00 | 0 | |||||
| 2025-07-23 | 13F | Clear Creek Financial Management, LLC | 23.200 | -0,85 | 593 | 6,47 | ||||
| 2025-08-06 | 13F | Commonwealth Equity Services, Llc | 1.043.204 | 0,52 | 27 | 8,33 |