Grundlæggende statistik
| Institutionelle aktier (lange) | 1.136.474 (ex 13D/G) - change of -0,17MM shares -12,88% MRQ |
| Institutionel værdi (lang) | $ 510 USD ($1000) |
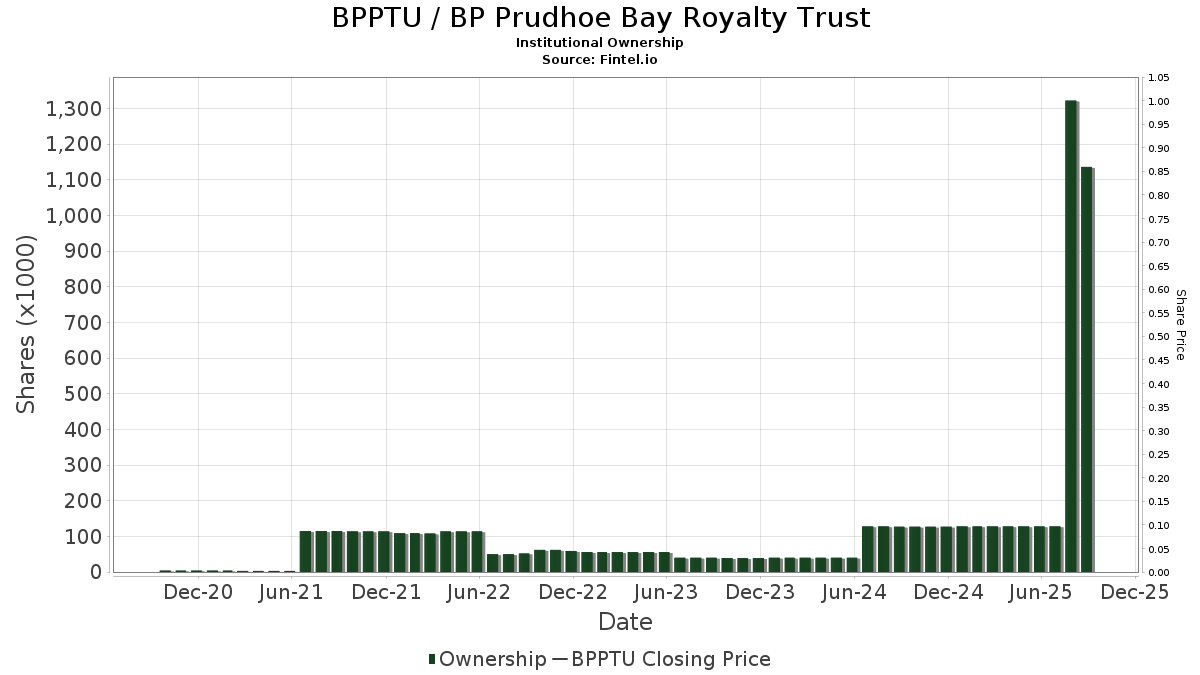
Institutionelt ejerskab og aktionærer
BP Prudhoe Bay Royalty Trust (US:BPPTU) har 43 institutionelle ejere og aktionærer, der har indsendt 13D/G- eller 13F-formularer til Securities Exchange Commission (SEC). Disse institutioner har i alt 1,136,474 aktier. Største aktionærer omfatter Ashton Thomas Private Wealth, LLC, Citadel Advisors Llc, PRFZ - Invesco FTSE RAFI US 1500 Small-Mid ETF, Two Sigma Investments, Lp, Wedbush Securities Inc, Susquehanna International Group, Llp, Welch Group, LLC, XTX Topco Ltd, UBS Group AG, and Morgan Stanley .
BP Prudhoe Bay Royalty Trust (OTCPK:BPPTU) institutionel ejerskabsstruktur viser aktuelle positioner i virksomheden efter institutioner og fonde, samt seneste ændringer i positionsstørrelse. Større aktionærer kan omfatte individuelle investorer, investeringsforeninger, hedgefonde eller institutioner. Skema 13D angiver, at investoren besidder (eller besidder) mere end 5 % af virksomheden og har til hensigt (eller har til hensigt at) aktivt at forfølge en ændring i forretningsstrategi. Skema 13G indikerer en passiv investering på over 5%.
Fondens stemningsscore
Fund Sentiment Score (fka Ownership Accumulation Score) finder de aktier, der bliver mest købt af fonde. Det er resultatet af en sofistikeret, multi-faktor kvantitativ model, der identificerer virksomheder med de højeste niveauer af institutionel akkumulering. Scoringsmodellen bruger en kombination af den samlede stigning i oplyste ejere, ændringerne i porteføljeallokeringer i disse ejere og andre målinger. Tallet går fra 0 til 100, hvor højere tal indikerer et højere niveau af akkumulering for sine jævnaldrende, og 50 er gennemsnittet.
Opdateringsfrekvens: Dagligt
Se Ownership Explorer, som giver en liste over højest rangerende virksomheder.
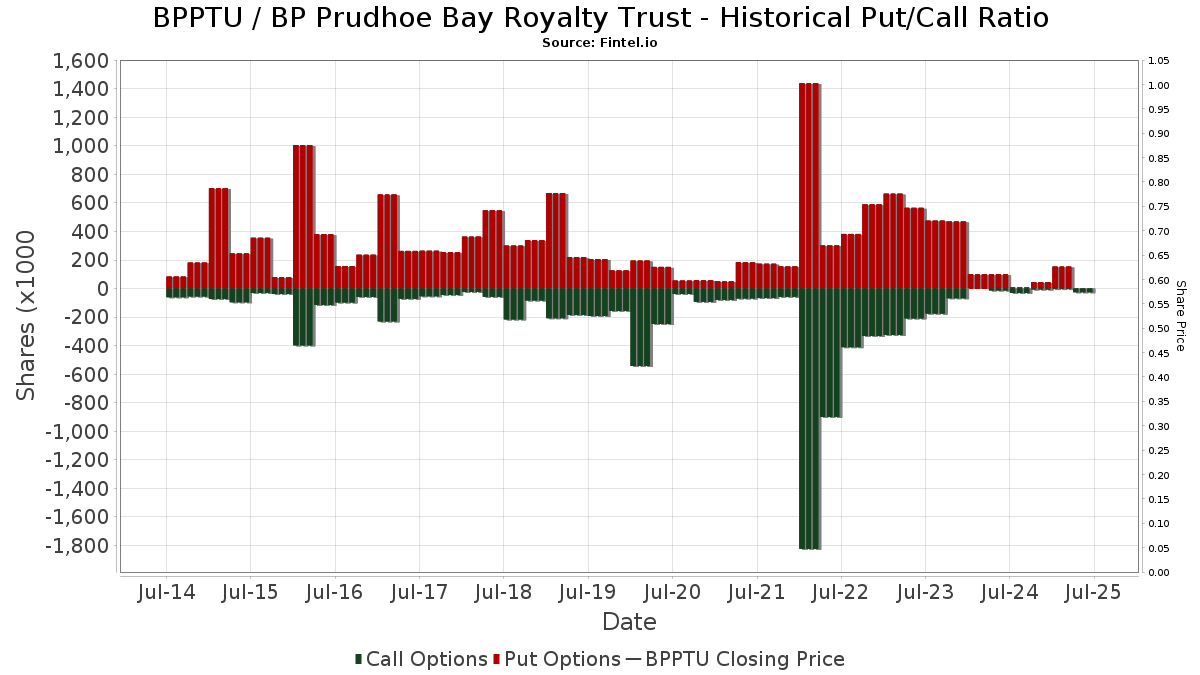
Institutionel Put/Call-forhold
Ud over at indberette standardaktie- og gældsudstedelser skal institutter med mere end 100 mill. aktiver under forvaltning også oplyse deres put- og call-optionsbeholdninger. Da salgsoptioner generelt indikerer negativ stemning, og købsoptioner indikerer positiv stemning, kan vi få en fornemmelse af den overordnede institutionelle stemning ved at plotte forholdet mellem put og kald. Diagrammet til højre viser det historiske put/call-forhold for dette instrument.
Brug af Put/Call Ratio som en indikator for investorernes stemning overvinder en af de vigtigste mangler ved at bruge totalt institutionelt ejerskab, som er, at en betydelig mængde af aktiver under forvaltning investeres passivt for at spore indekser. Passivt forvaltede fonde køber typisk ikke optioner, så indikatoren for put/call-forholdet følger mere nøje følelsen af aktivt forvaltede fonde.
13F og NPORT arkivering
Detaljer om 13F-arkivering er gratis. Detaljer om NP-ansøgninger kræver et premium-medlemskab. Grønne rækker angiver nye positioner. Røde rækker angiver lukkede positioner. Klik på linket ikon for at se den fulde transaktionshistorik.
Opgrader
for at låse premium-data op og eksportere til Excel ![]() .
.
| Fil dato | Kilde | Investor | Type | Gennemsnitlig pris (Øst) |
Aktier | Δ Aktier (%) |
Rapporteret Værdi ($1000) |
Δ Værdi (%) |
Port Alloc (%) |
|
|---|---|---|---|---|---|---|---|---|---|---|
| 2025-08-14 | 13F | Two Sigma Investments, Lp | 77.912 | -22,47 | 39 | -29,09 | ||||
| 2025-08-12 | 13F | PSI Advisors, LLC | 0 | -100,00 | 0 | |||||
| 2025-05-12 | 13F | Invesco Ltd. | 0 | -100,00 | 0 | |||||
| 2025-05-07 | 13F | Sheaff Brock Investment Advisors, LLC | 16.963 | 0,00 | 9 | 12,50 | ||||
| 2025-08-12 | 13F | Virtu Financial LLC | 23.244 | 41,85 | 0 | |||||
| 2025-04-30 | 13F | Sofos Investments, Inc. | 0 | -100,00 | 0 | -100,00 | ||||
| 2025-08-06 | 13F | Wedbush Securities Inc | 47.263 | -0,53 | 0 | |||||
| 2025-08-14 | 13F | Jane Street Group, Llc | 0 | -100,00 | 0 | |||||
| 2025-08-14 | 13F | Royal Bank Of Canada | 733 | -78,75 | 0 | -100,00 | ||||
| 2025-08-14 | 13F | Hunting Hill Global Capital, LLC | 0 | -100,00 | 0 | |||||
| 2025-07-25 | 13F | Welch Group, LLC | 33.759 | 0,00 | 17 | -11,11 | ||||
| 2025-07-21 | 13F | DHJJ Financial Advisors, Ltd. | 25 | 0,00 | 0 | |||||
| 2025-07-10 | 13F | Baader Bank INC | 0 | -100,00 | 0 | |||||
| 2025-08-05 | 13F | Carolinas Wealth Consulting Llc | 0 | -100,00 | 0 | |||||
| 2025-08-13 | 13F | Alerus Financial Na | 3.850 | 2 | ||||||
| 2025-08-14 | 13F | Group One Trading, L.p. | 4.953 | -61,62 | 2 | -71,43 | ||||
| 2025-08-14 | 13F | Wells Fargo & Company/mn | 853 | -56,32 | 0 | -100,00 | ||||
| 2025-08-15 | 13F | Fidelity D & D Bancorp Inc | 21.000 | 0,00 | 11 | -9,09 | ||||
| 2025-08-14 | 13F | Goldman Sachs Group Inc | 0 | -100,00 | 0 | |||||
| 2025-08-14 | 13F | Citadel Advisors Llc | Put | 0 | -100,00 | 0 | ||||
| 2025-08-13 | 13F | StoneX Group Inc. | 0 | -100,00 | 0 | -100,00 | ||||
| 2025-08-14 | 13F | Safeguard Investment Advisory Group, LLC | 15.607 | 0,00 | 8 | -12,50 | ||||
| 2025-05-13 | 13F | Steward Partners Investment Advisory, Llc | 0 | -100,00 | 0 | |||||
| 2025-08-14 | 13F | Fmr Llc | 1.000 | 1 | ||||||
| 2025-08-12 | 13F | CIBC Private Wealth Group, LLC | 0 | -100,00 | 0 | |||||
| 2025-08-14 | 13F | UBS Group AG | 29.509 | -64,67 | 15 | -69,57 | ||||
| 2025-05-15 | 13F | Creative Planning | 0 | -100,00 | 0 | |||||
| 2025-08-14 | 13F | Two Sigma Securities, Llc | 0 | -100,00 | 0 | |||||
| 2025-08-14 | 13F | SIH Partners, LLLP | Put | 0 | -100,00 | 0 | ||||
| 2025-05-16 | 13F | Coppell Advisory Solutions LLC | 0 | -100,00 | 0 | |||||
| 2025-08-14 | 13F | Federation des caisses Desjardins du Quebec | 0 | -100,00 | 0 | |||||
| 2025-08-14 | 13F/A | Barclays Plc | 23 | 0,00 | 0 | |||||
| 2025-07-16 | 13F | Signaturefd, Llc | 47 | 0,00 | 0 | |||||
| 2025-08-04 | 13F | Creekmur Asset Management LLC | 0 | -100,00 | 0 | |||||
| 2025-09-04 | 13F/A | Advisor Group Holdings, Inc. | 10.927 | 3,05 | 5 | 0,00 | ||||
| 2025-08-14 | 13F | Hrt Financial Lp | 16.510 | 0 | ||||||
| 2025-07-31 | 13F | Azzad Asset Management Inc /adv | 22.000 | 0,00 | 11 | -8,33 | ||||
| 2025-08-01 | 13F | Ashton Thomas Private Wealth, LLC | 429.752 | 0,00 | 216 | -9,28 | ||||
| 2025-07-15 | 13F | FLP Wealth Management, LLC | 0 | -100,00 | 0 | |||||
| 2025-08-05 | 13F | Simplex Trading, Llc | 2.213 | -80,98 | 0 | |||||
| 2025-08-12 | 13F | XTX Topco Ltd | 31.569 | -45,53 | 16 | -53,12 | ||||
| 2025-08-15 | 13F | Morgan Stanley | 28.637 | -9,38 | 14 | -17,65 | ||||
| 2025-05-15 | 13F | Gts Securities Llc | 0 | -100,00 | 0 | |||||
| 2025-08-11 | 13F | Private Advisor Group, LLC | 11.510 | 0,00 | 6 | -16,67 | ||||
| 2025-04-01 | NP | PRFZ - Invesco FTSE RAFI US 1500 Small-Mid ETF This fund is a listed as child fund of Invesco Ltd. and if that institution has disclosed ownership in this security, then these positions will not be double counted when calculating total shares and total value | 128.441 | -0,13 | 67 | -49,62 | ||||
| 2025-08-14 | 13F | Bank Of America Corp /de/ | 4.901 | 0,82 | 2 | 0,00 | ||||
| 2025-07-15 | 13F | Mather Group, Llc. | 0 | -100,00 | 0 | |||||
| 2025-08-12 | 13F | Bokf, Na | 64 | -82,42 | 0 | |||||
| 2025-04-24 | 13F | Trust Co Of Vermont | 0 | -100,00 | 0 | |||||
| 2025-07-23 | 13F | Narwhal Capital Management | 23.587 | 0,00 | 12 | -15,38 | ||||
| 2025-08-14 | 13F | Gould Capital, LLC | 70 | 0,00 | 0 | |||||
| 2025-08-12 | 13F | Proequities, Inc. | 0 | 0 | ||||||
| 2025-07-11 | 13F | Adirondack Trust Co | 100 | 0,00 | 0 | |||||
| 2025-05-07 | 13F | Vista Private Wealth Partners. LLC | 0 | -100,00 | 0 | |||||
| 2025-08-07 | 13F | Allworth Financial LP | 17.178 | 6.969,14 | 9 | |||||
| 2025-08-11 | 13F | Bellwether Advisors, LLC | 1 | 0,00 | 0 | |||||
| 2025-08-14 | 13F | GWM Advisors LLC | 894 | 0,00 | 0 | |||||
| 2025-05-02 | 13F | Whittier Trust Co Of Nevada Inc | 0 | -100,00 | 0 | |||||
| 2025-07-15 | 13F | Cranbrook Wealth Management, LLC | 676 | 0,00 | 0 | |||||
| 2025-08-08 | 13F | Cetera Investment Advisers | 13.827 | -6,27 | 7 | -25,00 | ||||
| 2025-08-13 | 13F | Northern Trust Corp | 0 | -100,00 | 0 | |||||
| 2025-08-14 | 13F | Citadel Advisors Llc | Call | 25.300 | 583,78 | 13 | 500,00 | |||
| 2025-07-24 | 13F | Us Bancorp \de\ | 900 | 0,00 | 0 | |||||
| 2025-08-14 | 13F | Citadel Advisors Llc | 202.731 | 4,50 | 102 | -5,61 | ||||
| 2025-08-12 | 13F | MAI Capital Management | 2.320 | 0,00 | 1 | 0,00 | ||||
| 2025-08-14 | 13F | Susquehanna International Group, Llp | 36.800 | -18,83 | 18 | -28,00 | ||||
| 2025-08-14 | 13F | Raymond James Financial Inc | 1.420 | 1 | ||||||
| 2025-05-16 | 13F | Jones Financial Companies Lllp | 0 | -100,00 | 0 | |||||
| 2025-07-21 | 13F | Ameritas Advisory Services, LLC | 1.000 | 1 | ||||||
| 2025-08-19 | 13F | Cape Investment Advisory, Inc. | 16 | 0,00 | 0 | |||||
| 2025-08-14 | 13F | Sunbelt Securities, Inc. | 130 | 0,00 | 0 |