Grundlæggende statistik
| Institutionelle ejere | 61 total, 60 long only, 0 short only, 1 long/short - change of 1,67% MRQ |
| Gennemsnitlig porteføljeallokering | 0.0891 % - change of -70,33% MRQ |
| Institutionelle aktier (lange) | 567.427 (ex 13D/G) - change of -0,20MM shares -25,82% MRQ |
| Institutionel værdi (lang) | $ 53.277 USD ($1000) |
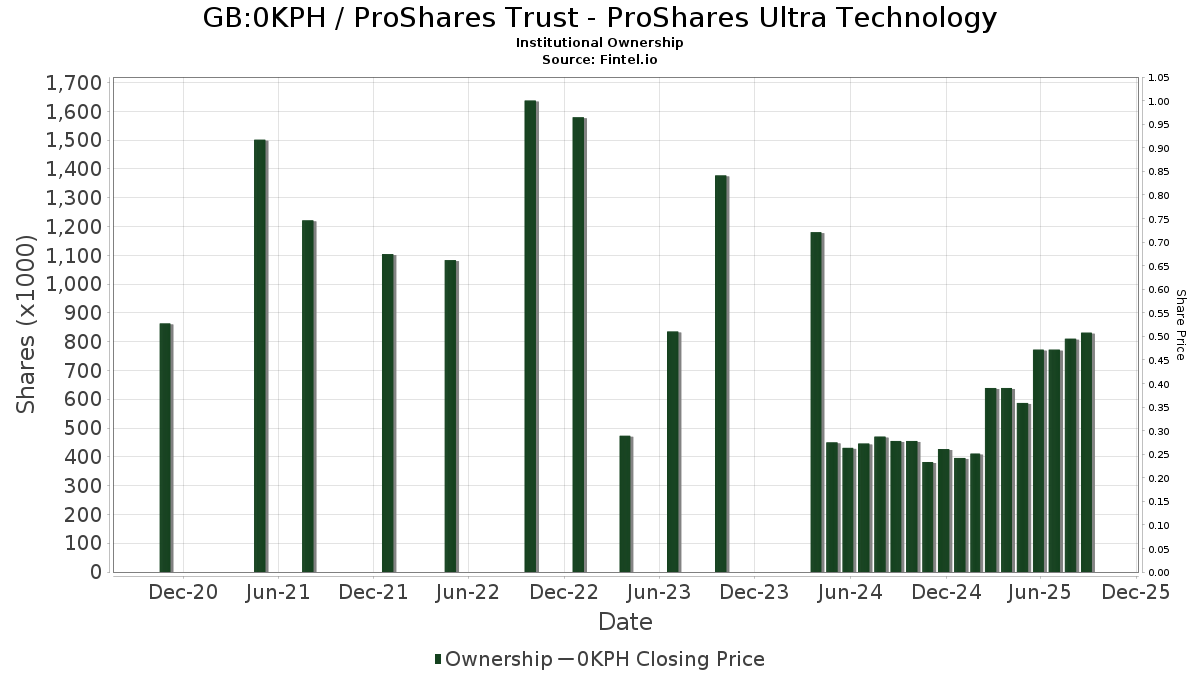
Institutionelt ejerskab og aktionærer
ProShares Trust - ProShares Ultra Technology (GB:0KPH) har 61 institutionelle ejere og aktionærer, der har indsendt 13D/G- eller 13F-formularer til Securities Exchange Commission (SEC). Disse institutioner har i alt 567,427 aktier. Største aktionærer omfatter Gotham Asset Management, LLC, Tyche Wealth Partners LLC, Envestnet Asset Management Inc, WealthCare Asset Management, LLC, Harbour Investments, Inc., Commonwealth Equity Services, Llc, Dale Q Rice Investment Management Ltd, Retirement Planning Co of New England, Inc., Advisor Group Holdings, Inc., and Mariner, LLC .
ProShares Trust - ProShares Ultra Technology (LSE:0KPH) institutionel ejerskabsstruktur viser aktuelle positioner i virksomheden efter institutioner og fonde, samt seneste ændringer i positionsstørrelse. Større aktionærer kan omfatte individuelle investorer, investeringsforeninger, hedgefonde eller institutioner. Skema 13D angiver, at investoren besidder (eller besidder) mere end 5 % af virksomheden og har til hensigt (eller har til hensigt at) aktivt at forfølge en ændring i forretningsstrategi. Skema 13G indikerer en passiv investering på over 5%.
Fondens stemningsscore
Fund Sentiment Score (fka Ownership Accumulation Score) finder de aktier, der bliver mest købt af fonde. Det er resultatet af en sofistikeret, multi-faktor kvantitativ model, der identificerer virksomheder med de højeste niveauer af institutionel akkumulering. Scoringsmodellen bruger en kombination af den samlede stigning i oplyste ejere, ændringerne i porteføljeallokeringer i disse ejere og andre målinger. Tallet går fra 0 til 100, hvor højere tal indikerer et højere niveau af akkumulering for sine jævnaldrende, og 50 er gennemsnittet.
Opdateringsfrekvens: Dagligt
Se Ownership Explorer, som giver en liste over højest rangerende virksomheder.
AI+ Ask Fintel’s AI assistant about ProShares Trust - ProShares Ultra Technology.
Select a question to share a public post with an AI-crafted answer.
Thinking of good questions…
13F og NPORT arkivering
Detaljer om 13F-arkivering er gratis. Detaljer om NP-ansøgninger kræver et premium-medlemskab. Grønne rækker angiver nye positioner. Røde rækker angiver lukkede positioner. Klik på linket ikon for at se den fulde transaktionshistorik.
Opgrader
for at låse premium-data op og eksportere til Excel ![]() .
.
| Fil dato | Kilde | Investor | Type | Gennemsnitlig pris (Øst) |
Aktier | Δ Aktier (%) |
Rapporteret Værdi ($1000) |
Δ Værdi (%) |
Port Alloc (%) |
|
|---|---|---|---|---|---|---|---|---|---|---|
| 2026-01-29 | 13F | UBS Group AG | 98 | 9 | ||||||
| 2026-01-21 | 13F | Runnymede Capital Advisors, Inc. | 0 | -100,00 | 0 | |||||
| 2026-02-12 | 13F | Great Valley Advisor Group, Inc. | 3.358 | -2,50 | 317 | -0,94 | ||||
| 2026-02-11 | 13F | Group One Trading, L.p. | 272 | 26 | ||||||
| 2026-01-29 | 13F | UMA Financial Services, Inc. | 400 | 0,00 | 38 | 0,00 | ||||
| 2026-02-09 | 13F | Harbour Investments, Inc. | 30.601 | 0,00 | 2.886 | 1,76 | ||||
| 2026-01-08 | 13F | Brave Asset Management Inc | 4.176 | 0,00 | 394 | 1,81 | ||||
| 2026-01-20 | 13F | Toth Financial Advisory Corp | 601 | -87,72 | 57 | -87,64 | ||||
| 2026-02-10 | 13F | Shepherd Financial Partners LLC | 4.844 | 0,00 | 457 | 1,79 | ||||
| 2025-12-02 | 13F | Allworth Financial LP | 0 | -100,00 | 0 | |||||
| 2026-02-05 | 13F | Tucker Asset Management Llc | 70 | 7 | ||||||
| 2026-01-26 | 13F | Whittier Trust Co | 165 | 0,00 | 16 | 6,67 | ||||
| 2026-02-11 | 13F | Cerity Partners LLC | 6.400 | 0,00 | 604 | 1,69 | ||||
| 2026-02-17 | 13F | Citadel Advisors Llc | Call | 0 | -100,00 | 0 | ||||
| 2026-02-12 | 13F | Hrt Financial Lp | 0 | -100,00 | 0 | |||||
| 2026-02-11 | 13F | Franklin Resources Inc | 100 | 0,00 | 9 | 0,00 | ||||
| 2026-02-17 | 13F | Creative Planning | 7.500 | -0,08 | 707 | 1,73 | ||||
| 2026-02-03 | 13F | Sequoia Financial Advisors, LLC | 6.400 | 604 | ||||||
| 2026-02-02 | 13F | Oppenheimer & Co Inc | 2.800 | 0,00 | 264 | 1,93 | ||||
| 2026-01-28 | 13F | Chicago Partners Investment Group LLC | 5.438 | 0,00 | 518 | -9,60 | ||||
| 2026-01-26 | 13F | Independent Wealth Network Inc. | 2.257 | 0,00 | 213 | 1,44 | ||||
| 2026-02-17 | 13F | Citadel Advisors Llc | Put | 3.500 | 330 | |||||
| 2026-02-06 | 13F | HighTower Advisors, LLC | 8.623 | 45,34 | 813 | 48,09 | ||||
| 2026-02-17 | 13F | Citadel Advisors Llc | 5.411 | 20,89 | 510 | 23,19 | ||||
| 2026-02-10 | 13F | Lido Advisors, LLC | 3.049 | 0,00 | 283 | 0,00 | ||||
| 2026-02-17 | 13F | Qube Research & Technologies Ltd | 89 | -32,06 | 8 | -33,33 | ||||
| 2026-02-17 | 13F | WealthCare Asset Management, LLC | 31.564 | 2.978 | ||||||
| 2026-02-17 | 13F | Tower Research Capital LLC (TRC) | 0 | -100,00 | 0 | |||||
| 2026-01-16 | 13F | Empirical Financial Services, LLC d.b.a. Empirical Wealth Management | 0 | -100,00 | 0 | |||||
| 2026-02-06 | 13F | Pnc Financial Services Group, Inc. | 1.000 | 0,00 | 94 | 2,17 | ||||
| 2026-02-17 | 13F | Royal Bank Of Canada | 711 | 132,35 | 67 | 139,29 | ||||
| 2026-02-13 | 13F | Kilter Group LLC | 16 | 0,00 | 2 | 0,00 | ||||
| 2026-01-26 | 13F | McGuire Investment Group, LLC | 4.600 | -3,69 | 434 | -2,04 | ||||
| 2026-02-12 | 13F | CIBC Private Wealth Group, LLC | 0 | -100,00 | 0 | |||||
| 2026-02-13 | 13F | River Wealth Advisors LLC | 5.851 | 552 | ||||||
| 2026-02-13 | 13F | Mariner, LLC | 9.420 | 0,00 | 888 | 1,83 | ||||
| 2026-02-05 | 13F | Cambridge Investment Research Advisors, Inc. | 2.213 | 0 | ||||||
| 2026-01-13 | 13F | CoreCap Advisors, LLC | 48 | -45,45 | 5 | -50,00 | ||||
| 2026-02-17 | 13F | Integrated Advisors Network LLC | 4.043 | 381 | ||||||
| 2026-01-28 | 13F | APS Management Group, Inc. | 2.195 | 207 | ||||||
| 2026-02-12 | 13F | Beacon Capital Management, Inc. | 61 | 0,00 | 6 | 0,00 | ||||
| 2026-02-13 | 13F | Kestra Advisory Services, LLC | 0 | -100,00 | 0 | |||||
| 2026-02-04 | 13F | Nwam Llc | 0 | -100,00 | 0 | -100,00 | ||||
| 2026-02-13 | 13F | Wells Fargo & Company/mn | 1 | 0,00 | 0 | |||||
| 2026-02-05 | 13F | Atria Investments Llc | 2.654 | 250 | ||||||
| 2025-12-02 | 13F | IFP Advisors, Inc | 0 | -100,00 | 0 | |||||
| 2026-01-21 | 13F | Sound Income Strategies, LLC | 73 | 7 | ||||||
| 2026-01-26 | 13F | Parcion Private Wealth LLC | 4.800 | 0,00 | 453 | 1,80 | ||||
| 2026-01-28 | 13F | Kanawha Capital Management Llc | 2.186 | 0,00 | 206 | 1,98 | ||||
| 2026-02-10 | 13F | Envestnet Asset Management Inc | 46.864 | 13,00 | 4.419 | 15,02 | ||||
| 2026-02-17 | 13F | Quantinno Capital Management LP | 5.960 | -56,04 | 562 | -55,25 | ||||
| 2026-01-07 | 13F | Aventura Private Wealth, LLC | 800 | 0,00 | 75 | 1,35 | ||||
| 2026-01-26 | 13F | Discipline Wealth Solutions, LLC | 4.320 | 0,00 | 407 | 1,75 | ||||
| 2026-02-13 | 13F | Morgan Stanley | 2 | 100,00 | 0 | |||||
| 2026-02-17 | 13F | Susquehanna International Group, Llp | Call | 0 | -100,00 | 0 | ||||
| 2026-02-11 | 13F | LPL Financial LLC | 5.187 | 34,94 | 489 | 37,36 | ||||
| 2026-02-10 | 13F | Rothschild Investment Llc | 150 | 0,00 | 14 | 7,69 | ||||
| 2026-02-11 | 13F | Simplex Trading, Llc | 0 | -100,00 | 0 | |||||
| 2026-02-11 | 13F | O'shaughnessy Asset Management, Llc | 0 | -100,00 | 0 | |||||
| 2026-01-20 | 13F | Signaturefd, Llc | 200 | 0,00 | 19 | 0,00 | ||||
| 2026-02-04 | 13F | LRI Investments, LLC | 401 | 0,00 | 38 | 0,00 | ||||
| 2026-02-17 | 13F | Susquehanna International Group, Llp | 5.914 | -28,53 | 558 | -27,28 | ||||
| 2026-02-10 | 13F/A | Northwestern Mutual Wealth Management Co | 4.580 | -19,58 | 432 | -18,22 | ||||
| 2026-02-13 | 13F | Truvestments Capital Llc | 616 | 0,00 | 58 | 1,75 | ||||
| 2026-02-10 | 13F | Marshall & Sterling Wealth Advisors Inc. | 1.793 | -7,91 | 169 | -6,11 | ||||
| 2026-01-28 | 13F | Clarity Financial LLC | 2.942 | -3,64 | 277 | -1,77 | ||||
| 2026-02-17 | 13F | Risk Paradigm Group, LLC | 0 | -100,00 | 0 | |||||
| 2026-02-17 | 13F | Advisor Group Holdings, Inc. | 10.837 | 48,05 | 1.022 | 50,81 | ||||
| 2026-02-17 | 13F | Bank Of America Corp /de/ | 6.600 | 0,00 | 622 | 1,80 | ||||
| 2026-02-12 | 13F | Commonwealth Equity Services, Llc | 20.131 | -3,28 | 1.898 | 189.700,00 | ||||
| 2026-01-28 | 13F | Retirement Planning Co of New England, Inc. | 13.695 | -2,55 | 1.291 | -0,84 | ||||
| 2026-02-17 | 13F | Wealth Watch Advisors, INC | 88 | 0,00 | 8 | 0,00 | ||||
| 2026-02-17 | 13F | Warren Averett Asset Management, LLC | 8.200 | 0,00 | 773 | 1,84 | ||||
| 2025-11-13 | 13F | Quadrature Capital Ltd | 0 | -100,00 | 0 | |||||
| 2026-01-30 | 13F | Dale Q Rice Investment Management Ltd | 14.500 | -1,42 | 1.367 | -5,07 | ||||
| 2026-01-23 | 13F | Tyche Wealth Partners LLC | 77.725 | -0,27 | 7.329 | 1,51 | ||||
| 2025-11-14 | 13F | Eqis Capital Management, Inc. | 0 | -100,00 | 0 | |||||
| 2026-02-17 | 13F | Gotham Asset Management, LLC | 171.834 | 0,00 | 16.204 | 1,77 |
Other Listings
| US:ROM | 84,19 $ |