Grundlæggende statistik
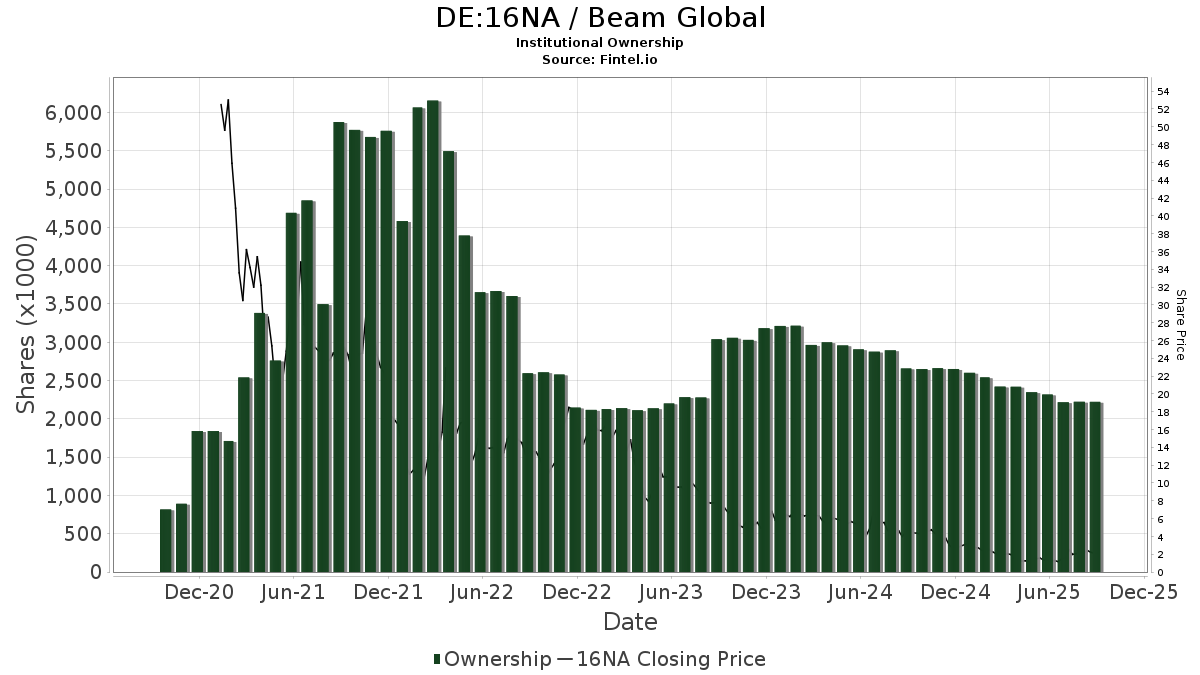
| Institutionelle aktier (lange) | 2.641.239 - 13,88% (ex 13D/G) - change of -0,18MM shares -6,53% MRQ |
| Institutionel værdi (lang) | $ 3.996 USD ($1000) |
Institutionelt ejerskab og aktionærer
Beam Global (DE:16NA) har 42 institutionelle ejere og aktionærer, der har indsendt 13D/G- eller 13F-formularer til Securities Exchange Commission (SEC). Disse institutioner har i alt 2,641,239 aktier. Største aktionærer omfatter Integrity Wealth Advisors, Inc., Vanguard Group Inc, Integrity Wealth Advisors, Inc., Geode Capital Management, Llc, BlackRock, Inc., Renaissance Technologies Llc, T3 Companies, LLC, Susquehanna International Group, Llp, State Street Corp, and Virtue Capital Management, LLC .
Beam Global (DB:16NA) institutionel ejerskabsstruktur viser aktuelle positioner i virksomheden efter institutioner og fonde, samt seneste ændringer i positionsstørrelse. Større aktionærer kan omfatte individuelle investorer, investeringsforeninger, hedgefonde eller institutioner. Skema 13D angiver, at investoren besidder (eller besidder) mere end 5 % af virksomheden og har til hensigt (eller har til hensigt at) aktivt at forfølge en ændring i forretningsstrategi. Skema 13G indikerer en passiv investering på over 5%.
The share price as of March 27, 2026 is 1,24 / share. Previously, on March 31, 2025, the share price was 1,79 / share. This represents a decline of 30,73% over that period.
Fondens stemningsscore
Fund Sentiment Score (fka Ownership Accumulation Score) finder de aktier, der bliver mest købt af fonde. Det er resultatet af en sofistikeret, multi-faktor kvantitativ model, der identificerer virksomheder med de højeste niveauer af institutionel akkumulering. Scoringsmodellen bruger en kombination af den samlede stigning i oplyste ejere, ændringerne i porteføljeallokeringer i disse ejere og andre målinger. Tallet går fra 0 til 100, hvor højere tal indikerer et højere niveau af akkumulering for sine jævnaldrende, og 50 er gennemsnittet.
Opdateringsfrekvens: Dagligt
Se Ownership Explorer, som giver en liste over højest rangerende virksomheder.
AI+ Ask Fintel’s AI assistant about Beam Global.
Select a question to share a public post with an AI-crafted answer.
Thinking of good questions…
13F og NPORT arkivering
Detaljer om 13F-arkivering er gratis. Detaljer om NP-ansøgninger kræver et premium-medlemskab. Grønne rækker angiver nye positioner. Røde rækker angiver lukkede positioner. Klik på linket ikon for at se den fulde transaktionshistorik.
Opgrader
for at låse premium-data op og eksportere til Excel ![]() .
.
| Fil dato | Kilde | Investor | Type | Gennemsnitlig pris (Øst) |
Aktier | Δ Aktier (%) |
Rapporteret Værdi ($1000) |
Δ Værdi (%) |
Port Alloc (%) |
|
|---|---|---|---|---|---|---|---|---|---|---|
| 2026-02-09 | 13F | Shufro Rose & Co Llc | 15.000 | 0,00 | 22 | -26,67 | ||||
| 2026-02-12 | 13F | Renaissance Technologies Llc | 124.000 | 267,95 | 186 | 91,75 | ||||
| 2026-02-18 | 13F | GWM Advisors LLC | 16 | 0,00 | 0 | |||||
| 2026-02-11 | 13F | Simplex Trading, Llc | Put | 100 | 0,00 | 0 | ||||
| 2026-02-11 | 13F | Simplex Trading, Llc | Call | 46.300 | 358,42 | 69 | ||||
| 2026-02-13 | 13F | Wells Fargo & Company/mn | 625 | 0,00 | 1 | -100,00 | ||||
| 2026-02-12 | 13F | Jane Street Group, Llc | 12.228 | -78,76 | 18 | -89,09 | ||||
| 2026-02-18 | 13F/A | Virtue Capital Management, LLC | 50.000 | 1.339,68 | 81 | -78,57 | ||||
| 2026-02-13 | 13F | State Street Corp | 58.228 | 17,57 | 87 | -38,73 | ||||
| 2026-02-10 | 13F | Lido Advisors, LLC | 29.345 | 0,00 | 85 | 0,00 | ||||
| 2026-03-26 | 13F | Leonteq Securities AG | 0 | -100,00 | 0 | |||||
| 2026-03-25 | 13F/A | Barclays Plc | 0 | -100,00 | 0 | |||||
| 2026-02-11 | 13F | Commonwealth Retirement Investments LLC | 1.872 | 3 | ||||||
| 2026-02-17 | 13F | Integrity Wealth Advisors, Inc. | 742.745 | -42,10 | 1.114 | -61,56 | ||||
| 2025-11-19 | 13F | Sunbelt Securities, Inc. | 0 | -100,00 | 0 | |||||
| 2026-02-17 | 13F | Integrity Wealth Advisors, Inc. | Call | 541.500 | 417,69 | 812 | 169,77 | |||
| 2026-02-13 | 13F | Smartleaf Asset Management LLC | 5.000 | 8 | ||||||
| 2026-01-07 | 13F | Green Alpha Advisors, LLC | 47.374 | 143,31 | 71 | 26,79 | ||||
| 2026-02-17 | 13F | SageView Advisory Group, LLC | 96 | 0 | ||||||
| 2026-02-12 | 13F | BlackRock, Inc. | 150.301 | 0,00 | 225 | -47,92 | ||||
| 2026-01-29 | 13F | UBS Group AG | 15.000 | 4.487,16 | 22 | |||||
| 2026-02-13 | 13F | Peak6 Llc | Call | 0 | -100,00 | 0 | ||||
| 2026-02-13 | 13F | MAI Capital Management | 39 | 0,00 | 0 | |||||
| 2026-02-17 | 13F | Jones Financial Companies Lllp | 2.616 | 0,00 | 4 | -50,00 | ||||
| 2026-02-17 | 13F | Fmr Llc | 0 | -100,00 | 0 | -100,00 | ||||
| 2025-11-06 | 13F | Baader Bank INC | 0 | -100,00 | 0 | -100,00 | ||||
| 2026-02-17 | 13F | Quadrature Capital Ltd | 40.514 | 61 | ||||||
| 2026-01-26 | 13F | Cwm, Llc | 0 | -100,00 | 0 | |||||
| 2025-11-14 | 13F | Raymond James Financial Inc | 0 | -100,00 | 0 | |||||
| 2026-01-21 | 13F | Newbridge Financial Services Group, Inc. | 2.000 | 0,00 | 3 | -40,00 | ||||
| 2026-02-17 | 13F | Susquehanna International Group, Llp | 109.322 | 11,52 | 164 | -42,20 | ||||
| 2025-11-14 | 13F | Wolverine Trading, Llc | 26.367 | 68 | ||||||
| 2026-02-17 | 13F | Engineers Gate Manager LP | 10.531 | 16 | ||||||
| 2025-11-14 | 13F | Wolverine Trading, Llc | Put | 15.500 | 40 | |||||
| 2026-02-17 | 13F | XTX Topco Ltd | 17.491 | 12,61 | 26 | -40,91 | ||||
| 2026-01-26 | 13F | PFG Investments, LLC | 21.448 | 9,55 | 32 | -42,86 | ||||
| 2026-02-13 | 13F | Morgan Stanley | 12.256 | -7,99 | 18 | -52,63 | ||||
| 2025-11-26 | 13F/A | Evelyn Partners Investment Management LLP | 0 | -100,00 | 0 | -100,00 | ||||
| 2026-02-03 | 13F | Bokf, Na | 0 | -100,00 | 0 | |||||
| 2026-02-17 | 13F | Price T Rowe Associates Inc /md/ | 16.988 | -11,92 | 0 | |||||
| 2026-02-11 | 13F | Simplex Trading, Llc | 0 | -100,00 | 0 | |||||
| 2026-02-05 | 13F | Allworth Financial LP | 0 | -100,00 | 0 | |||||
| 2026-02-05 | 13F | Center for Financial Planning, Inc. | 1.000 | 0,00 | 2 | -50,00 | ||||
| 2026-02-17 | 13F | Northern Trust Corp | 33.307 | 0,00 | 50 | -48,42 | ||||
| 2026-02-17 | 13F | Tower Research Capital LLC (TRC) | 2.221 | -28,95 | 3 | -66,67 | ||||
| 2026-02-24 | 13F | Bell Investment Advisors, Inc | 0 | -100,00 | 0 | |||||
| 2026-02-17 | 13F | Advisor Group Holdings, Inc. | 22.214 | 64,99 | 33 | -8,33 | ||||
| 2026-02-17 | 13F | Two Sigma Investments, Lp | 30.342 | -14,43 | 46 | -55,88 | ||||
| 2026-02-11 | 13F | Group One Trading, L.p. | Call | 400 | -95,65 | 1 | -100,00 | |||
| 2026-02-11 | 13F | Group One Trading, L.p. | Put | 1.200 | -14,29 | 2 | -75,00 | |||
| 2026-02-11 | 13F | Group One Trading, L.p. | 9.323 | 725,78 | 14 | 333,33 | ||||
| 2026-02-09 | 13F | Geode Capital Management, Llc | 168.700 | 1,67 | 253 | -46,96 | ||||
| 2026-02-12 | 13F | Steward Partners Investment Advisory, Llc | 0 | -100,00 | 0 | |||||
| 2026-01-29 | 13F | Vanguard Group Inc | 704.856 | 6,70 | 1.057 | -44,43 | ||||
| 2026-02-17 | 13F | Royal Bank Of Canada | 56 | -98,23 | 0 | -100,00 | ||||
| 2026-01-26 | 13F | JNBA Financial Advisors | 0 | -100,00 | 0 | |||||
| 2026-02-17 | 13F | Citadel Advisors Llc | 40.026 | 60 | ||||||
| 2026-02-10 | 13F | Bnp Paribas Arbitrage, Sa | 15 | 0,00 | 0 | |||||
| 2026-02-11 | 13F | T3 Companies, LLC | 110.000 | 165 | ||||||
| 2026-02-11 | 13F | Jpmorgan Chase & Co | 753 | 0,00 | 1 | -50,00 | ||||
| 2026-02-03 | 13F | SBI Securities Co., Ltd. | 35 | -68,75 | 0 | |||||
| 2026-02-12 | 13F | Principal Securities, Inc. | 0 | -100,00 | 0 | |||||
| 2026-02-17 | 13F | Bank Of America Corp /de/ | 6.989 | -0,01 | 10 | -50,00 | ||||
| 2026-02-17 | 13F | Citadel Advisors Llc | Put | 0 | -100,00 | 0 | ||||
| 2026-02-17 | 13F | Susquehanna International Group, Llp | Call | 0 | -100,00 | 0 | ||||
| 2026-01-07 | 13F | Aventura Private Wealth, LLC | 0 | -100,00 | 0 |
Other Listings
| US:BEEM | 1,37 $ |