Grundlæggende statistik
| Institutionelle aktier (lange) | 1.817.048 - 10,45% (ex 13D/G) - change of -0,53MM shares -22,74% MRQ |
| Institutionel værdi (lang) | $ 3.054 USD ($1000) |
Institutionelt ejerskab og aktionærer
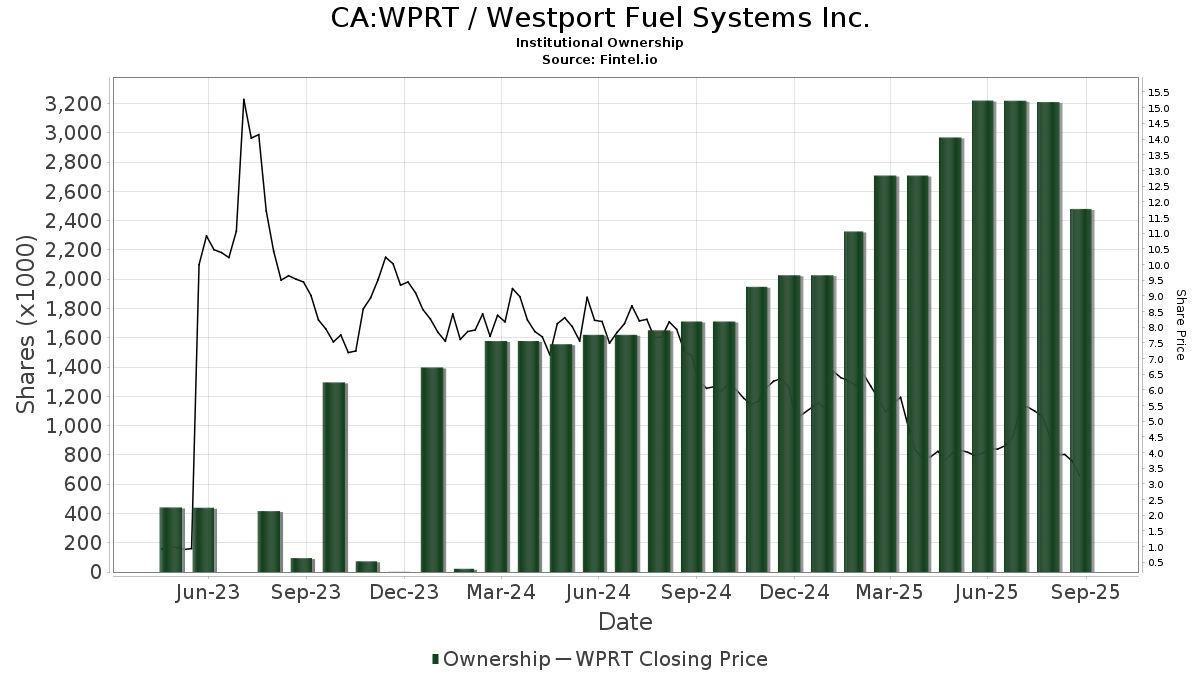
Westport Fuel Systems Inc. (CA:WPRT) har 46 institutionelle ejere og aktionærer, der har indsendt 13D/G- eller 13F-formularer til Securities Exchange Commission (SEC). Disse institutioner har i alt 1,817,048 aktier. Største aktionærer omfatter Grace & White Inc /ny, Royce & Associates Lp, Baird Financial Group, Inc., Us Bancorp \de\, Citadel Advisors Llc, Goldman Sachs Group Inc, Jane Street Group, Llc, Citadel Advisors Llc, XTX Topco Ltd, and TD Waterhouse Canada Inc. .
Westport Fuel Systems Inc. (TSX:WPRT) institutionel ejerskabsstruktur viser aktuelle positioner i virksomheden efter institutioner og fonde, samt seneste ændringer i positionsstørrelse. Større aktionærer kan omfatte individuelle investorer, investeringsforeninger, hedgefonde eller institutioner. Skema 13D angiver, at investoren besidder (eller besidder) mere end 5 % af virksomheden og har til hensigt (eller har til hensigt at) aktivt at forfølge en ændring i forretningsstrategi. Skema 13G indikerer en passiv investering på over 5%.
The share price as of April 30, 2026 is 2,76 / share. Previously, on May 1, 2025, the share price was 3,95 / share. This represents a decline of 30,13% over that period.
Fondens stemningsscore
Fund Sentiment Score (fka Ownership Accumulation Score) finder de aktier, der bliver mest købt af fonde. Det er resultatet af en sofistikeret, multi-faktor kvantitativ model, der identificerer virksomheder med de højeste niveauer af institutionel akkumulering. Scoringsmodellen bruger en kombination af den samlede stigning i oplyste ejere, ændringerne i porteføljeallokeringer i disse ejere og andre målinger. Tallet går fra 0 til 100, hvor højere tal indikerer et højere niveau af akkumulering for sine jævnaldrende, og 50 er gennemsnittet.
Opdateringsfrekvens: Dagligt
Se Ownership Explorer, som giver en liste over højest rangerende virksomheder.
AI+ Ask Fintel’s AI assistant about Westport Fuel Systems Inc..
Select a question to share a public post with an AI-crafted answer.
Thinking of good questions…
13F og NPORT arkivering
Detaljer om 13F-arkivering er gratis. Detaljer om NP-ansøgninger kræver et premium-medlemskab. Grønne rækker angiver nye positioner. Røde rækker angiver lukkede positioner. Klik på linket ikon for at se den fulde transaktionshistorik.
Opgrader
for at låse premium-data op og eksportere til Excel ![]() .
.
| Fil dato | Kilde | Investor | Type | Gennemsnitlig pris (Øst) |
Aktier | Δ Aktier (%) |
Rapporteret Værdi ($1000) |
Δ Værdi (%) |
Port Alloc (%) |
|
|---|---|---|---|---|---|---|---|---|---|---|
| 2026-01-14 | 13F | ORG Partners LLC | 400 | 0,00 | 1 | |||||
| 2026-02-09 | 13F | Royce & Associates Lp | 227.504 | 357 | ||||||
| 2026-02-17 | 13F | Bank Of America Corp /de/ | 1.558 | 0,00 | 2 | -33,33 | ||||
| 2026-02-17 | 13F | Advisor Group Holdings, Inc. | 352 | -1,68 | 1 | |||||
| 2026-02-13 | 13F | Barclays Plc | 0 | -100,00 | 0 | |||||
| 2026-02-17 | 13F | XTX Topco Ltd | 19.468 | 31 | ||||||
| 2026-02-11 | 13F | Deutsche Bank Ag\ | 184 | 0,00 | 0 | |||||
| 2026-02-17 | 13F | Royal Bank Of Canada | 12.813 | -92,88 | 20 | -95,10 | ||||
| 2026-01-26 | 13F | Cwm, Llc | 11 | -84,51 | 0 | |||||
| 2026-04-28 | 13F | ORG Wealth Partners, LLC | 400 | 1 | ||||||
| 2026-02-10 | 13F | Goldman Sachs Group Inc | 38.753 | 23,61 | 61 | -15,49 | ||||
| 2026-02-13 | 13F | Baird Financial Group, Inc. | 177.282 | -67,71 | 278 | -77,69 | ||||
| 2026-02-17 | 13F | Citadel Advisors Llc | Put | 15.700 | -9,25 | 25 | -38,46 | |||
| 2026-01-29 | 13F | UBS Group AG | 16.515 | 7,81 | 26 | -26,47 | ||||
| 2026-02-11 | 13F | Group One Trading, L.p. | 0 | -100,00 | 0 | |||||
| 2026-02-17 | 13F | Citadel Advisors Llc | Call | 106.300 | 167 | |||||
| 2026-01-30 | 13F | Us Bancorp \de\ | 166.829 | 0,00 | 262 | -30,95 | ||||
| 2026-02-09 | 13F | Avalon Trust Co | 13 | 0,00 | 0 | |||||
| 2026-02-17 | 13F | Citadel Advisors Llc | 28.186 | -44,55 | 44 | -61,74 | ||||
| 2026-02-09 | 13F | CBIZ Investment Advisory Services, LLC | 45 | 80,00 | 0 | |||||
| 2026-04-27 | 13F | Tsfg, Llc | 1 | 0,00 | 0 | |||||
| 2025-11-13 | 13F | Parallel Advisors, LLC | 0 | -100,00 | 0 | |||||
| 2026-01-27 | 13F | TD Waterhouse Canada Inc. | 18.092 | 0,00 | 29 | -30,00 | ||||
| 2026-02-13 | 13F | Arkadios Wealth Advisors | 10.000 | 16 | ||||||
| 2025-11-14 | 13F | Raymond James Financial Inc | 0 | -100,00 | 0 | -100,00 | ||||
| 2026-02-09 | 13F | Delta Asset Management Llc/tn | 15 | 0,00 | 0 | |||||
| 2026-02-12 | 13F | SWAN Capital LLC | 1.000 | 0,00 | 2 | -50,00 | ||||
| 2026-02-06 | 13F | VSM Wealth Advisory, LLC | 0 | -100,00 | 0 | |||||
| 2025-11-07 | 13F | Pnc Financial Services Group, Inc. | 0 | -100,00 | 0 | -100,00 | ||||
| 2026-02-14 | 13F | Rockefeller Capital Management L.P. | 30 | 0,00 | 0 | |||||
| 2026-02-17 | 13F | Tower Research Capital LLC (TRC) | 3.585 | 202,53 | 6 | 150,00 | ||||
| 2026-02-13 | 13F | MAI Capital Management | 33 | 0,00 | 0 | |||||
| 2026-04-21 | 13F | Grace & White Inc /ny | 1.006.708 | -13,22 | 1.832 | 0,60 | ||||
| 2026-02-17 | 13F | Susquehanna International Group, Llp | 0 | -100,00 | 0 | -100,00 | ||||
| 2025-11-14 | 13F | National Bank Of Canada /fi/ | 0 | -100,00 | 0 | -100,00 | ||||
| 2026-02-02 | 13F | Fifth Third Bancorp | 170 | 0 | ||||||
| 2026-02-13 | 13F | Morgan Stanley | 2.123 | -51,41 | 3 | -66,67 | ||||
| 2026-02-13 | 13F | Gen-Wealth Partners Inc | 86 | 0,00 | 0 | |||||
| 2026-02-12 | 13F | Hrt Financial Lp | 10.113 | 0 | ||||||
| 2026-02-13 | 13F | Wells Fargo & Company/mn | 1.459 | 0,00 | 2 | -33,33 | ||||
| 2026-02-12 | 13F | Planning Project LLC | 150 | 0 | ||||||
| 2026-04-28 | 13F | Golden State Wealth Management, LLC | 30 | 0,00 | 0 | |||||
| 2026-04-30 | 13F | Cambridge Investment Research Advisors, Inc. | 11.781 | -2,89 | 0 | |||||
| 2026-04-23 | 13F | North Star Investment Management Corp. | 0 | -100,00 | 0 | |||||
| 2026-02-12 | 13F | Federation des caisses Desjardins du Quebec | 1.673 | -22,22 | 3 | -50,00 | ||||
| 2026-04-08 | 13F | Thompson Investment Management, Inc. | 125 | 0,00 | 0 | |||||
| 2026-02-11 | 13F | Simplex Trading, Llc | 6.705 | 635,20 | 11 | |||||
| 2026-02-11 | 13F | LPL Financial LLC | 10.073 | 16 | ||||||
| 2026-01-12 | 13F | AllSquare Wealth Management LLC | 6 | 0 | ||||||
| 2026-04-10 | 13F | Country Trust Bank | 220 | 0,00 | 0 | |||||
| 2026-04-28 | 13F | SBI Securities Co., Ltd. | 35 | 0,00 | 0 | |||||
| 2026-02-12 | 13F | Jane Street Group, Llc | Put | 10.000 | 16 | |||||
| 2026-02-12 | 13F | Jane Street Group, Llc | 28.543 | 45 | ||||||
| 2026-02-05 | 13F | HighMark Wealth Management LLC | 350 | 0,00 | 1 | |||||
| 2026-02-05 | 13F | Allworth Financial LP | 1.025 | 0,00 | 2 | -50,00 | ||||
| 2025-11-21 | 13F | Bell Investment Advisors, Inc | 0 | -100,00 | 0 | |||||
| 2026-02-12 | 13F | Renaissance Technologies Llc | 10.023 | 16 | ||||||
| 2025-11-12 | 13F | BlackRock, Inc. | 0 | -100,00 | 0 | -100,00 | ||||
| 2026-02-13 | 13F | Citigroup Inc | 2.554 | 217,66 | 4 | 300,00 | ||||
| 2026-02-09 | 13F | Harbour Investments, Inc. | 27 | 0,00 | 0 | |||||
| 2026-04-28 | 13F | Disciplined Equity Management, Inc. | 0 | -100,00 | 0 |