Grundlæggende statistik
| Institutionelle aktier (lange) | 12.724.970 - 4,41% (ex 13D/G) - change of 5,70MM shares 81,06% MRQ |
| Institutionel værdi (lang) | $ 11.635 USD ($1000) |
Institutionelt ejerskab og aktionærer
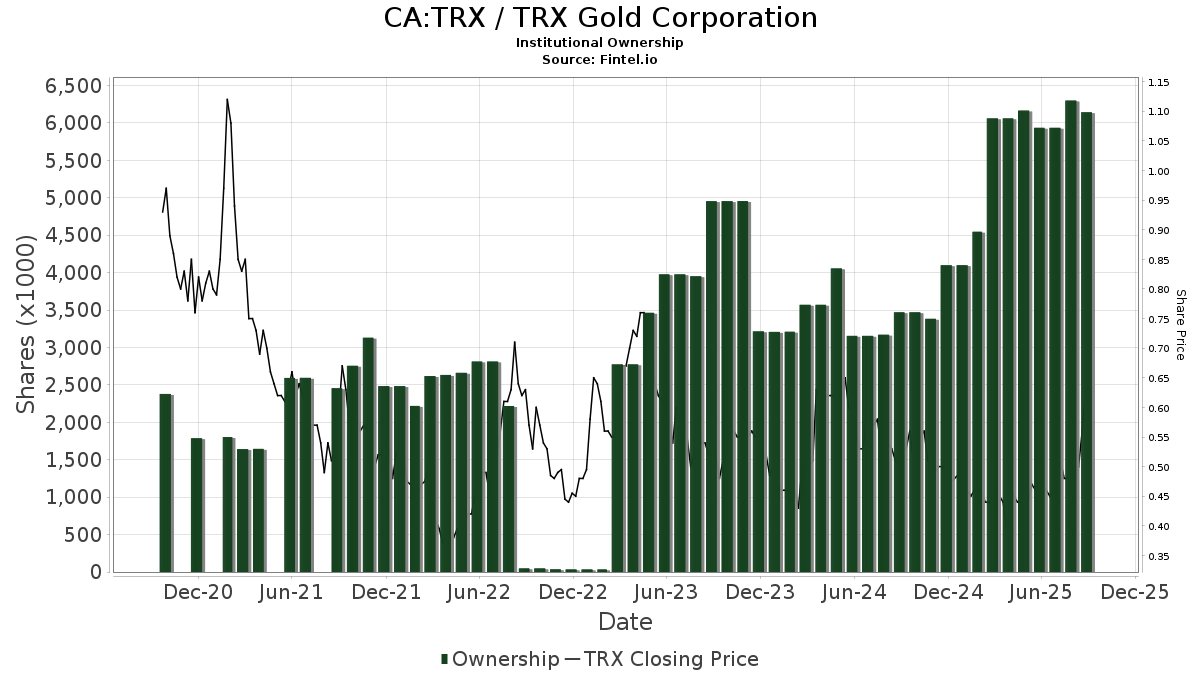
TRX Gold Corporation (CA:TRX) har 54 institutionelle ejere og aktionærer, der har indsendt 13D/G- eller 13F-formularer til Securities Exchange Commission (SEC). Disse institutioner har i alt 12,724,970 aktier. Største aktionærer omfatter Hillsdale Investment Management Inc., Marshall Wace, Llp, Morgan Stanley, Arrowstreet Capital, Limited Partnership, Rossby Financial, LCC, Connor, Clark & Lunn Investment Management Ltd., Jane Street Group, Llc, Citadel Advisors Llc, Bnp Paribas Arbitrage, Sa, and Strategic Planning, Inc. .
TRX Gold Corporation (TSX:TRX) institutionel ejerskabsstruktur viser aktuelle positioner i virksomheden efter institutioner og fonde, samt seneste ændringer i positionsstørrelse. Større aktionærer kan omfatte individuelle investorer, investeringsforeninger, hedgefonde eller institutioner. Skema 13D angiver, at investoren besidder (eller besidder) mere end 5 % af virksomheden og har til hensigt (eller har til hensigt at) aktivt at forfølge en ændring i forretningsstrategi. Skema 13G indikerer en passiv investering på over 5%.
The share price as of February 26, 2026 is 2,51 / share. Previously, on February 28, 2025, the share price was 0,43 / share. This represents an increase of 483,72% over that period.
Fondens stemningsscore
Fund Sentiment Score (fka Ownership Accumulation Score) finder de aktier, der bliver mest købt af fonde. Det er resultatet af en sofistikeret, multi-faktor kvantitativ model, der identificerer virksomheder med de højeste niveauer af institutionel akkumulering. Scoringsmodellen bruger en kombination af den samlede stigning i oplyste ejere, ændringerne i porteføljeallokeringer i disse ejere og andre målinger. Tallet går fra 0 til 100, hvor højere tal indikerer et højere niveau af akkumulering for sine jævnaldrende, og 50 er gennemsnittet.
Opdateringsfrekvens: Dagligt
Se Ownership Explorer, som giver en liste over højest rangerende virksomheder.
AI+ Ask Fintel’s AI assistant about TRX Gold Corporation.
Select a question to share a public post with an AI-crafted answer.
Thinking of good questions…
13F og NPORT arkivering
Detaljer om 13F-arkivering er gratis. Detaljer om NP-ansøgninger kræver et premium-medlemskab. Grønne rækker angiver nye positioner. Røde rækker angiver lukkede positioner. Klik på linket ikon for at se den fulde transaktionshistorik.
Opgrader
for at låse premium-data op og eksportere til Excel ![]() .
.
| Fil dato | Kilde | Investor | Type | Gennemsnitlig pris (Øst) |
Aktier | Δ Aktier (%) |
Rapporteret Værdi ($1000) |
Δ Værdi (%) |
Port Alloc (%) |
|
|---|---|---|---|---|---|---|---|---|---|---|
| 2026-02-13 | 13F | Marshall Wace, Llp | 1.801.708 | 1.658 | ||||||
| 2025-11-14 | 13F | Wiley Bros.-aintree Capital, Llc | 0 | -100,00 | 0 | -100,00 | ||||
| 2026-02-17 | 13F | Captrust Financial Advisors | 30.486 | 0,00 | 28 | 47,37 | ||||
| 2026-02-18 | 13F | Strategic Planning, Inc. | 329.133 | 0,00 | 303 | 47,80 | ||||
| 2026-02-23 | 13F | Virtu Financial LLC | 111.427 | 0 | ||||||
| 2026-02-18 | 13F | GWM Advisors LLC | 0 | -100,00 | 0 | |||||
| 2026-01-27 | 13F | Evergreen Capital Management Llc | 0 | -100,00 | 0 | -100,00 | ||||
| 2026-01-21 | 13F | Stone House Investment Management, LLC | 6.240 | 6 | ||||||
| 2026-02-13 | 13F | MAI Capital Management | 106.878 | 125,01 | 98 | 237,93 | ||||
| 2026-02-12 | 13F | Leigh Baldwin & Co., Llc | 18.750 | 0,00 | 17 | 54,55 | ||||
| 2026-02-13 | 13F | Integrated Wealth Concepts LLC | 21.787 | 20 | ||||||
| 2026-02-17 | 13F | XTX Topco Ltd | 0 | -100,00 | 0 | |||||
| 2026-02-12 | 13F | Scotia Capital Inc. | 17.049 | 0,00 | 16 | 50,00 | ||||
| 2026-02-12 | 13F | Bank Of Montreal /can/ | 160.200 | -27,25 | 148 | 6,47 | ||||
| 2026-01-23 | 13F | Farther Finance Advisors, LLC | 66.900 | 0,00 | 62 | 48,78 | ||||
| 2026-02-11 | 13F | Cerity Partners LLC | 117.371 | 0,00 | 108 | 47,95 | ||||
| 2026-02-05 | 13F | Allworth Financial LP | 200 | 0,00 | 0 | |||||
| 2026-02-12 | 13F | Jane Street Group, Llc | 729.779 | 4.455,71 | 672 | 7.366,67 | ||||
| 2026-01-26 | 13F | Virginia Wealth Management Group, Inc. | 100.000 | 0,00 | 92 | 48,39 | ||||
| 2026-01-27 | 13F | Waterfront Wealth Inc. | 75.166 | 0,00 | 92 | 80,39 | ||||
| 2026-02-17 | 13F | Raymond James Financial Inc | 0 | -100,00 | 0 | |||||
| 2025-11-05 | 13F | Envestnet Asset Management Inc | 0 | -100,00 | 0 | |||||
| 2026-02-17 | 13F | Citadel Advisors Llc | Call | 18.700 | 17 | |||||
| 2026-01-15 | 13F | PFG Private Wealth Management, LLC | 0 | -100,00 | 0 | |||||
| 2026-02-17 | 13F | Citadel Advisors Llc | 635.775 | 43,56 | 585 | 111,96 | ||||
| 2026-02-04 | 13F | Meridian Wealth Management, LLC | 55.377 | 10,75 | 51 | 61,29 | ||||
| 2026-01-14 | 13F | ORG Partners LLC | 0 | -100,00 | 0 | |||||
| 2026-02-06 | 13F/A | Rathbone Brothers plc | 14.000 | 0,00 | 13 | 50,00 | ||||
| 2026-02-11 | 13F | Tradition Wealth Management, LLC | 10.000 | 9 | ||||||
| 2026-02-17 | 13F | Bank Of America Corp /de/ | 5.125 | 5 | ||||||
| 2026-01-21 | 13F | Blue Zone Wealth Advisors, LLC | 15.972 | 0,00 | 15 | 55,56 | ||||
| 2026-01-12 | 13F | Thompson Davis & Co., Inc. | 14.222 | 13 | ||||||
| 2026-02-11 | 13F | LPL Financial LLC | 0 | -100,00 | 0 | |||||
| 2026-01-23 | 13F | Asset Advisors Investment Management, LLC | 30.000 | 0,00 | 28 | 50,00 | ||||
| 2026-01-08 | 13F | Wealth Enhancement Advisory Services, Llc | 25.450 | 0,00 | 22 | 46,67 | ||||
| 2026-01-29 | 13F | Kestra Private Wealth Services, Llc | 20.000 | 0,00 | 18 | 50,00 | ||||
| 2026-02-10 | 13F | Goldman Sachs Group Inc | 17.091 | 16 | ||||||
| 2026-02-13 | 13F | Arrowstreet Capital, Limited Partnership | 1.189.397 | 1.101 | ||||||
| 2026-02-17 | 13F | Advisor Group Holdings, Inc. | 31.814 | 0,00 | 29 | 163,64 | ||||
| 2026-02-17 | 13F | Royal Bank Of Canada | 4.544 | 202,93 | 4 | 300,00 | ||||
| 2026-02-13 | 13F | Citigroup Inc | 148 | 0 | ||||||
| 2026-01-14 | 13F | Aventus Investment Advisors, Inc. | 6.750 | 0,00 | 6 | 50,00 | ||||
| 2026-02-03 | 13F | SBI Securities Co., Ltd. | 1.168 | 231,82 | 1 | |||||
| 2025-11-14 | 13F | Two Sigma Securities, Llc | 0 | -100,00 | 0 | -100,00 | ||||
| 2026-02-13 | 13F | National Bank Of Canada /fi/ | 887 | -58,08 | 1 | -100,00 | ||||
| 2026-02-13 | 13F | Morgan Stanley | 1.577.203 | 15,48 | 1.452 | 70,42 | ||||
| 2026-02-12 | 13F | Hrt Financial Lp | 0 | -100,00 | 0 | |||||
| 2026-02-11 | 13F | Simplex Trading, Llc | 0 | -100,00 | 0 | |||||
| 2026-02-12 | 13F | Rossby Financial, LCC | 960.000 | -2,04 | 884 | 44,44 | ||||
| 2026-02-17 | 13F | Cetera Investment Advisers | 28.373 | 54,43 | 26 | 136,36 | ||||
| 2026-02-17 | 13F | Susquehanna International Group, Llp | 98.272 | 90 | ||||||
| 2026-02-17 | 13F | Warren Averett Asset Management, LLC | 26.150 | 0,00 | 24 | 50,00 | ||||
| 2026-02-10 | 13F | Connor, Clark & Lunn Investment Management Ltd. | 958.959 | 783,83 | 887 | 1.204,41 | ||||
| 2026-02-13 | 13F | Kestra Advisory Services, LLC | 0 | -100,00 | 0 | |||||
| 2026-02-17 | 13F | Toronto Dominion Bank | 25.006 | 0,01 | 23 | 53,33 | ||||
| 2026-02-17 | 13F | Susquehanna International Group, Llp | Put | 15.600 | 14 | |||||
| 2026-01-21 | 13F | Guild Investment Management, Inc. | 66.900 | 0,00 | 62 | 48,78 | ||||
| 2026-02-06 | 13F | HighTower Advisors, LLC | 295.216 | 0,34 | 272 | 48,09 | ||||
| 2026-02-10 | 13F | Hillsdale Investment Management Inc. | 1.817.781 | 144,13 | 1.685 | 258,30 | ||||
| 2026-02-02 | 13F | Integrity Wealth Solutions LLC | 289.975 | -0,35 | 267 | 47,51 | ||||
| 2026-01-26 | 13F | PFG Investments, LLC | 23.020 | -54,88 | 21 | -32,26 | ||||
| 2026-02-12 | 13F | Sprott Inc. | 95.721 | 34,87 | 88 | 100,00 | ||||
| 2026-02-12 | 13F | Commonwealth Equity Services, Llc | 14.000 | 0,00 | 13 | |||||
| 2026-02-13 | 13F | Financial Sense Advisors, Inc. | 32.991 | -83,38 | 30 | -75,61 | ||||
| 2026-02-17 | 13F | SPWM Advisors LLC | 55.000 | 51 | ||||||
| 2026-02-11 | 13F | Jpmorgan Chase & Co | 1.000 | -33,33 | 1 | |||||
| 2026-02-10 | 13F | Bnp Paribas Arbitrage, Sa | 529.835 | 9,80 | 488 | 61,79 | ||||
| 2026-02-11 | 13F | Group One Trading, L.p. | 9.034 | -25,34 | 8 | 14,29 | ||||
| 2026-01-29 | 13F | UBS Group AG | 49.740 | 24,10 | 46 | 80,00 |