Grundlæggende statistik
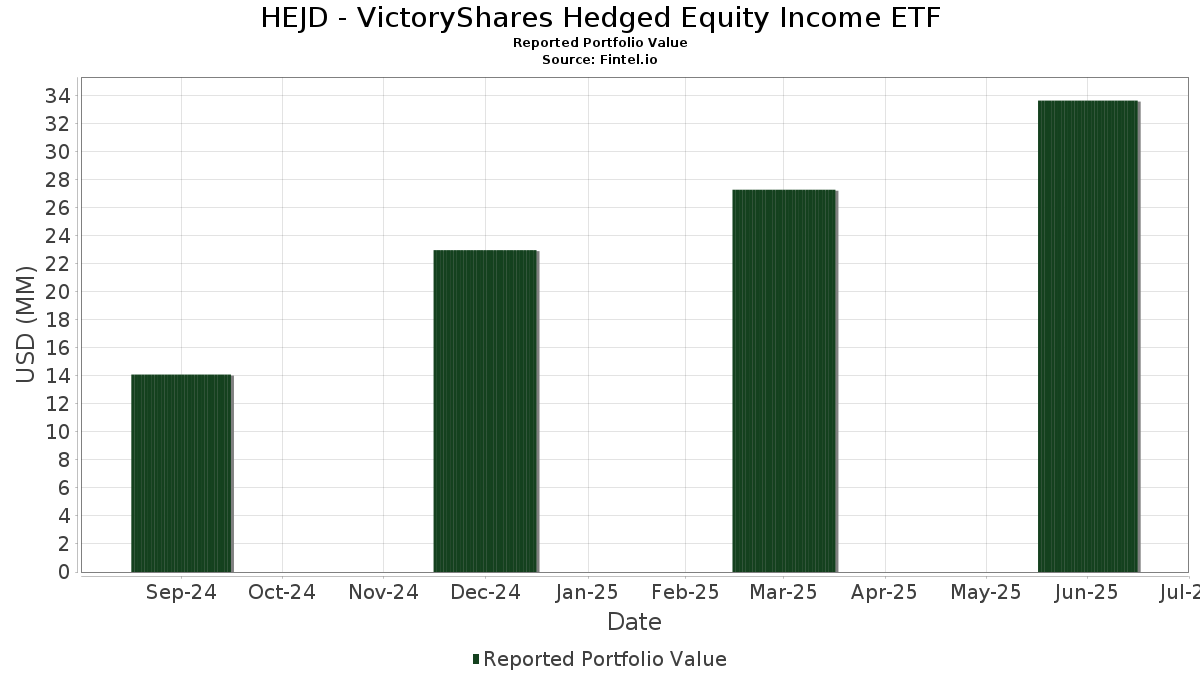
| Porteføljeværdi | $ 33.636.328 |
| Nuværende stillinger | 221 |
Seneste beholdninger, ydeevne, AUM (fra 13F, 13D)
HEJD - VictoryShares Hedged Equity Income ETF har afsløret 221 samlede besiddelser i deres seneste SEC-arkivering. Den seneste porteføljeværdi er beregnet til at være $ 33.636.328 USD. Faktiske aktiver under forvaltning (AUM) er denne værdi plus kontanter (som ikke er oplyst). HEJD - VictoryShares Hedged Equity Income ETFs største beholdninger er Flowers Foods, Inc. (US:FLO) , Verizon Communications Inc. (US:VZ) , General Mills, Inc. (US:GIS) , PepsiCo, Inc. (US:PEP) , and Altria Group, Inc. (US:MO) . HEJD - VictoryShares Hedged Equity Income ETFs nye stillinger omfatter Merck & Co., Inc. (US:MRK) , Target Corporation (US:TGT) , American Financial Group, Inc. (US:AFG) , The Scotts Miracle-Gro Company (US:SMG) , and Brunswick Corporation (US:BC) .
Top øger dette kvartal
Vi bruger ændringen i porteføljeallokeringen, fordi dette er den mest meningsfulde metrik. Ændringer kan skyldes handler eller ændringer i aktiekurser.
| Sikkerhed | Aktier (MM) |
Værdi (MM$) |
Portefølje % | ΔPortefølje % |
|---|---|---|---|---|
| 1,98 | 5,4443 | 5,4443 | ||
| MRK / Merck & Co., Inc. | 0,01 | 0,51 | 1,4057 | 1,4057 |
| FLO / Flowers Foods, Inc. | 0,04 | 0,70 | 1,9292 | 1,0995 |
| PEP / PepsiCo, Inc. | 0,00 | 0,57 | 1,5736 | 1,0954 |
| CPB / The Campbell's Company | 0,02 | 0,50 | 1,3605 | 1,0414 |
| TGT / Target Corporation | 0,00 | 0,28 | 0,7730 | 0,7730 |
| AFG / American Financial Group, Inc. | 0,00 | 0,25 | 0,6938 | 0,6938 |
| AMCR / Amcor plc | 0,06 | 0,54 | 1,4772 | 0,6862 |
| VTS / Vitesse Energy, Inc. | 0,02 | 0,35 | 0,9727 | 0,6761 |
| SMG / The Scotts Miracle-Gro Company | 0,00 | 0,22 | 0,6090 | 0,6090 |
Top falder i dette kvartal
Vi bruger ændringen i porteføljeallokeringen, fordi dette er den mest meningsfulde metrik. Ændringer kan skyldes handler eller ændringer i aktiekurser.
| Sikkerhed | Aktier (MM) |
Værdi (MM$) |
Portefølje % | ΔPortefølje % |
|---|---|---|---|---|
| -1,47 | -4,0298 | -4,0298 | ||
| -0,51 | -1,3888 | -1,3888 | ||
| OKE / ONEOK, Inc. | 0,00 | 0,01 | 0,0334 | -1,1953 |
| WU / The Western Union Company | 0,00 | 0,00 | -0,7674 | |
| GILD / Gilead Sciences, Inc. | 0,00 | 0,13 | 0,3679 | -0,7500 |
| DRI / Darden Restaurants, Inc. | 0,00 | 0,17 | 0,4625 | -0,6618 |
| LYB / LyondellBasell Industries N.V. | 0,00 | 0,05 | 0,1309 | -0,6500 |
| BMY / Bristol-Myers Squibb Company | 0,00 | 0,08 | 0,2100 | -0,6370 |
| XOM / Exxon Mobil Corporation | 0,00 | 0,00 | -0,5378 | |
| PM / Philip Morris International Inc. | 0,00 | 0,39 | 1,0583 | -0,5301 |
13F og Fondsarkivering
Denne formular blev indsendt den 2025-08-28 for rapporteringsperioden 2025-06-30. Klik på linkikonet for at se den fulde transaktionshistorik.
Opgrader for at låse op for premium-data og eksportere til Excel ![]() .
.
| Sikkerhed | Type | Gennemsnitlig aktiekurs | Aktier (MM) |
Δ Aktier (%) |
Værdi ($MM) |
Δ Aktier (%) |
Portefølje (%) |
ΔPortefølje (%) |
|
|---|---|---|---|---|---|---|---|---|---|
| NASDAQ 100 E MINI FUTURE SEP25 / DE (N/A) | 1,98 | 5,4443 | 5,4443 | ||||||
| FLO / Flowers Foods, Inc. | 0,04 | 238,29 | 0,70 | 184,21 | 1,9292 | 1,0995 | |||
| VZ / Verizon Communications Inc. | 0,01 | 99,84 | 0,59 | 90,88 | 1,6108 | 0,5773 | |||
| GIS / General Mills, Inc. | 0,01 | 97,52 | 0,57 | 71,34 | 1,5774 | 0,4503 | |||
| PEP / PepsiCo, Inc. | 0,00 | 357,05 | 0,57 | 303,52 | 1,5736 | 1,0954 | |||
| MO / Altria Group, Inc. | 0,01 | 41,22 | 0,54 | 37,91 | 1,4880 | 0,1687 | |||
| AMCR / Amcor plc | 0,06 | 141,08 | 0,54 | 128,94 | 1,4772 | 0,6862 | |||
| T / AT&T Inc. | 0,02 | 24,14 | 0,53 | 27,03 | 1,4583 | 0,0543 | |||
| MRK / Merck & Co., Inc. | 0,01 | 0,51 | 1,4057 | 1,4057 | |||||
| CPB / The Campbell's Company | 0,02 | 579,21 | 0,50 | 421,05 | 1,3605 | 1,0414 | |||
| KMI / Kinder Morgan, Inc. | 0,02 | 2,96 | 0,49 | 6,01 | 1,3586 | -0,2075 | |||
| AM / Antero Midstream Corporation | 0,02 | 21,33 | 0,47 | 27,79 | 1,2891 | 0,0548 | |||
| EVRG / Evergy, Inc. | 0,01 | 23,26 | 0,47 | 23,22 | 1,2835 | 0,0095 | |||
| OMF / OneMain Holdings, Inc. | 0,01 | 84,38 | 0,45 | 115,46 | 1,2262 | 0,5287 | |||
| OGE / OGE Energy Corp. | 0,01 | 13,27 | 0,41 | 9,28 | 1,1321 | -0,1338 | |||
| D / Dominion Energy, Inc. | 0,01 | 68,87 | 0,41 | 70,29 | 1,1183 | 0,3148 | |||
| REYN / Reynolds Consumer Products Inc. | 0,02 | 176,52 | 0,41 | 149,08 | 1,1152 | 0,5657 | |||
| PM / Philip Morris International Inc. | 0,00 | -28,98 | 0,39 | -18,60 | 1,0583 | -0,5301 | |||
| D2MN / Duke Energy Corporation | 0,00 | 5,45 | 0,38 | 2,13 | 1,0526 | -0,2093 | |||
| ES / Eversource Energy | 0,01 | 252,84 | 0,38 | 229,31 | 1,0505 | 0,3023 | |||
| PNW / Pinnacle West Capital Corporation | 0,00 | 23,64 | 0,37 | 16,04 | 1,0147 | -0,0539 | |||
| TROW / T. Rowe Price Group, Inc. | 0,00 | 66,84 | 0,36 | 75,73 | 0,9956 | 0,3008 | |||
| VTS / Vitesse Energy, Inc. | 0,02 | 346,51 | 0,35 | 302,27 | 0,9727 | 0,6761 | |||
| SON / Sonoco Products Company | 0,01 | 45,62 | 0,35 | 34,10 | 0,9624 | 0,0858 | |||
| PINC / Premier, Inc. | 0,02 | 21,17 | 0,33 | 38,08 | 0,9074 | 0,1022 | |||
| EMN / Eastman Chemical Company | 0,00 | 226,65 | 0,33 | 176,47 | 0,9043 | 0,5047 | |||
| TFC / Truist Financial Corporation | 0,01 | 46,45 | 0,33 | 52,80 | 0,8992 | 0,1804 | |||
| CLX / The Clorox Company | 0,00 | 157,79 | 0,32 | 109,80 | 0,8835 | 0,3695 | |||
| UGI / UGI Corporation | 0,01 | 22,02 | 0,32 | 34,31 | 0,8820 | 0,0792 | |||
| HBAN / Huntington Bancshares Incorporated | 0,02 | 23,62 | 0,32 | 38,36 | 0,8817 | 0,1005 | |||
| ADM / Archer-Daniels-Midland Company | 0,01 | 58,25 | 0,32 | 74,18 | 0,8709 | 0,2587 | |||
| NTRS / Northern Trust Corporation | 0,00 | 19,30 | 0,31 | 53,47 | 0,8519 | 0,1724 | |||
| FHB / First Hawaiian, Inc. | 0,01 | 23,60 | 0,30 | 26,07 | 0,8120 | 0,0252 | |||
| AEP / American Electric Power Company, Inc. | 0,00 | 9,23 | 0,29 | 3,52 | 0,8091 | -0,1450 | |||
| CWEN / Clearway Energy, Inc. | 0,01 | 39,83 | 0,29 | 47,72 | 0,8002 | 0,1381 | |||
| MSM / MSC Industrial Direct Co., Inc. | 0,00 | 23,72 | 0,29 | 35,71 | 0,7838 | 0,0759 | |||
| TGT / Target Corporation | 0,00 | 0,28 | 0,7730 | 0,7730 | |||||
| FHN / First Horizon Corporation | 0,01 | 17,75 | 0,27 | 28,91 | 0,7478 | 0,0363 | |||
| KMB / Kimberly-Clark Corporation | 0,00 | 22,82 | 0,26 | 11,54 | 0,7179 | -0,0707 | |||
| TNL / Travel + Leisure Co. | 0,01 | 23,56 | 0,26 | 37,97 | 0,7101 | 0,0797 | |||
| CVS / CVS Health Corporation | 0,00 | 25,24 | 0,26 | 27,86 | 0,7064 | 0,0289 | |||
| AFG / American Financial Group, Inc. | 0,00 | 0,25 | 0,6938 | 0,6938 | |||||
| NAT / Nordic American Tankers Limited | 0,10 | 314,26 | 0,25 | 342,11 | 0,6938 | 0,5022 | |||
| CFG / Citizens Financial Group, Inc. | 0,01 | 24,02 | 0,25 | 35,48 | 0,6925 | 0,0673 | |||
| APA / APA Corporation | 0,01 | 315,58 | 0,25 | 263,77 | 0,6912 | 0,4574 | |||
| EXC / Exelon Corporation | 0,01 | 21,43 | 0,25 | 14,29 | 0,6822 | -0,0470 | |||
| MDT / Medtronic plc | 0,00 | 11,63 | 0,23 | 8,41 | 0,6386 | -0,0827 | |||
| NXST / Nexstar Media Group, Inc. | 0,00 | 124,75 | 0,23 | 116,82 | 0,6380 | 0,2782 | |||
| SJM / The J. M. Smucker Company | 0,00 | 43,12 | 0,23 | 18,85 | 0,6253 | -0,0190 | |||
| SMG / The Scotts Miracle-Gro Company | 0,00 | 0,22 | 0,6090 | 0,6090 | |||||
| NE / Noble Corporation plc | 0,01 | 523,75 | 0,22 | 612,90 | 0,6068 | 0,5006 | |||
| BC / Brunswick Corporation | 0,00 | 0,22 | 0,6056 | 0,6056 | |||||
| DTE / DTE Energy Company | 0,00 | 3,87 | 0,22 | -0,46 | 0,5951 | -0,1364 | |||
| LNT / Alliant Energy Corporation | 0,00 | -11,79 | 0,21 | -17,05 | 0,5885 | -0,2799 | |||
| TSN / Tyson Foods, Inc. | 0,00 | 76,83 | 0,21 | 55,15 | 0,5813 | 0,1227 | |||
| CMA / Comerica Incorporated | 0,00 | 0,21 | 0,5786 | 0,5786 | |||||
| JHG / Janus Henderson Group plc | 0,01 | -24,80 | 0,21 | -19,38 | 0,5725 | -0,2941 | |||
| CALM / Cal-Maine Foods, Inc. | 0,00 | 243,26 | 0,21 | 276,36 | 0,5707 | 0,3852 | |||
| RF / Regions Financial Corporation | 0,01 | -8,54 | 0,20 | -0,97 | 0,5613 | -0,1322 | |||
| CH1300646267 / Bunge Global SA | 0,00 | 0,20 | 0,5544 | 0,5544 | |||||
| AMGN / Amgen Inc. | 0,00 | 264,95 | 0,20 | 228,33 | 0,5426 | 0,3397 | |||
| HPQ / HP Inc. | 0,01 | 208,48 | 0,20 | 173,61 | 0,5420 | 0,2987 | |||
| NWBI / Northwest Bancshares, Inc. | 0,02 | 100,61 | 0,19 | 113,19 | 0,5342 | 0,2279 | |||
| ETD / Ethan Allen Interiors Inc. | 0,01 | 167,61 | 0,19 | 170,42 | 0,5274 | 0,2876 | |||
| OZK / Bank OZK | 0,00 | 0,19 | 0,5136 | 0,5136 | |||||
| CSCO / Cisco Systems, Inc. | 0,00 | -21,09 | 0,19 | -11,43 | 0,5117 | -0,1937 | |||
| AVA / Avista Corporation | 0,00 | 56,44 | 0,18 | 41,41 | 0,4994 | 0,0687 | |||
| PNC / The PNC Financial Services Group, Inc. | 0,00 | -7,14 | 0,18 | -1,63 | 0,4989 | -0,1207 | |||
| HAS / Hasbro, Inc. | 0,00 | 0,18 | 0,4867 | 0,4867 | |||||
| XRAY / DENTSPLY SIRONA Inc. | 0,01 | 0,18 | 0,4830 | 0,4830 | |||||
| SR / Spire Inc. | 0,00 | 8,96 | 0,17 | 1,82 | 0,4630 | -0,0942 | |||
| DRI / Darden Restaurants, Inc. | 0,00 | -52,05 | 0,17 | -49,70 | 0,4625 | -0,6618 | |||
| CMCSA / Comcast Corporation | 0,00 | 0,16 | 0,4507 | 0,4507 | |||||
| FITB / Fifth Third Bancorp | 0,00 | 24,32 | 0,16 | 31,20 | 0,4507 | 0,0281 | |||
| APAM / Artisan Partners Asset Management Inc. | 0,00 | 71,56 | 0,16 | 95,18 | 0,4463 | 0,1657 | |||
| TROX / Tronox Holdings plc | 0,03 | 0,16 | 0,4434 | 0,4434 | |||||
| ENR / Energizer Holdings, Inc. | 0,01 | 116,67 | 0,16 | 45,45 | 0,4417 | 0,0717 | |||
| COG / Cabot Oil & Gas Corp. | 0,01 | 17,59 | 0,16 | 3,29 | 0,4336 | -0,0800 | |||
| HP / Helmerich & Payne, Inc. | 0,01 | 836,21 | 0,16 | 441,38 | 0,4336 | 0,3360 | |||
| NWE / NorthWestern Energy Group, Inc. | 0,00 | 23,80 | 0,16 | 9,79 | 0,4335 | -0,0496 | |||
| NTB / The Bank of N.T. Butterfield & Son Limited | 0,00 | 23,21 | 0,16 | 40,54 | 0,4284 | 0,0546 | |||
| FMC / FMC Corporation | 0,00 | 419,50 | 0,16 | 416,67 | 0,4274 | 0,3257 | |||
| PSX / Phillips 66 | 0,00 | 0,16 | 0,4267 | 0,4267 | |||||
| ABBV / AbbVie Inc. | 0,00 | -5,45 | 0,15 | -16,30 | 0,4244 | -0,1953 | |||
| BLX / Banco Latinoamericano de Comercio Exterior, S. A. | 0,00 | 21,72 | 0,15 | 33,63 | 0,4166 | 0,0364 | |||
| PFG / Principal Financial Group, Inc. | 0,00 | 0,15 | 0,4160 | 0,4160 | |||||
| TAP / Molson Coors Beverage Company | 0,00 | 23,02 | 0,15 | -2,65 | 0,4042 | -0,1044 | |||
| UPBD / Upbound Group, Inc. | 0,01 | 144,02 | 0,15 | 156,14 | 0,4021 | 0,2097 | |||
| BKH / Black Hills Corporation | 0,00 | 22,38 | 0,14 | 13,39 | 0,3957 | -0,0318 | |||
| BKE / The Buckle, Inc. | 0,00 | 148,62 | 0,14 | 197,92 | 0,3933 | 0,2298 | |||
| SNV / Synovus Financial Corp. | 0,00 | 24,02 | 0,14 | 37,62 | 0,3828 | 0,0418 | |||
| NJR / New Jersey Resources Corporation | 0,00 | 23,35 | 0,14 | 12,30 | 0,3782 | -0,0323 | |||
| PFE / Pfizer Inc. | 0,01 | -27,38 | 0,14 | -30,46 | 0,3774 | -0,2870 | |||
| SWKS / Skyworks Solutions, Inc. | 0,00 | 0,14 | 0,3727 | 0,3727 | |||||
| IP / International Paper Company | 0,00 | 0,14 | 0,3722 | 0,3722 | |||||
| GILD / Gilead Sciences, Inc. | 0,00 | -59,32 | 0,13 | -59,76 | 0,3679 | -0,7500 | |||
| PRGO / Perrigo Company plc | 0,00 | -16,62 | 0,13 | -20,96 | 0,3645 | -0,1966 | |||
| SAFT / Safety Insurance Group, Inc. | 0,00 | 23,02 | 0,13 | 23,58 | 0,3621 | 0,0044 | |||
| CPF / Central Pacific Financial Corp. | 0,00 | 23,88 | 0,13 | 28,71 | 0,3588 | 0,0171 | |||
| AMBP / Ardagh Metal Packaging S.A. | 0,03 | 38,16 | 0,13 | 95,45 | 0,3565 | 0,1338 | |||
| GNK / Genco Shipping & Trading Limited | 0,01 | 93,90 | 0,13 | 89,55 | 0,3490 | 0,1240 | |||
| DHT / DHT Holdings, Inc. | 0,01 | 46,14 | 0,13 | 50,60 | 0,3450 | 0,0645 | |||
| F / Ford Motor Company | 0,01 | -16,75 | 0,13 | -10,07 | 0,3446 | -0,1234 | |||
| NWN / Northwest Natural Holding Company | 0,00 | 23,46 | 0,12 | 14,29 | 0,3316 | -0,0217 | |||
| HAFC / Hanmi Financial Corporation | 0,00 | 23,05 | 0,12 | 33,71 | 0,3284 | 0,0287 | |||
| 10D / Navient Corporation | 0,01 | 0,12 | 0,3231 | 0,3231 | |||||
| HAL / Halliburton Company | 0,01 | 0,12 | 0,3218 | 0,3218 | |||||
| JNJ / Johnson & Johnson | 0,00 | -33,01 | 0,12 | -38,10 | 0,3216 | -0,3159 | |||
| FDP / Fresh Del Monte Produce Inc. | 0,00 | 17,86 | 0,11 | 23,91 | 0,3154 | 0,0041 | |||
| INSW / International Seaways, Inc. | 0,00 | 0,11 | 0,3105 | 0,3105 | |||||
| VNOM / Viper Energy, Inc. | 0,00 | 0,11 | 0,3066 | 0,3066 | |||||
| FNF / Fidelity National Financial, Inc. | 0,00 | -38,52 | 0,11 | -47,09 | 0,2999 | -0,3927 | |||
| BRSL / Brightstar Lottery PLC | 0,01 | 199,69 | 0,11 | 191,89 | 0,2975 | 0,1727 | |||
| OGS / ONE Gas, Inc. | 0,00 | -0,79 | 0,11 | -6,14 | 0,2958 | -0,0878 | |||
| UBSI / United Bankshares, Inc. | 0,00 | 23,31 | 0,10 | 29,11 | 0,2814 | 0,0158 | |||
| HFWA / Heritage Financial Corporation | 0,00 | 17,47 | 0,10 | 16,28 | 0,2746 | -0,0172 | |||
| KGS / Kodiak Gas Services, Inc. | 0,00 | -7,50 | 0,10 | -14,78 | 0,2690 | -0,1181 | |||
| SWX / Southwest Gas Holdings, Inc. | 0,00 | 23,66 | 0,10 | 27,63 | 0,2679 | 0,0122 | |||
| AUB / Atlantic Union Bankshares Corporation | 0,00 | 0,10 | 0,2675 | 0,2675 | |||||
| STNG / Scorpio Tankers Inc. | 0,00 | 357,46 | 0,10 | 385,00 | 0,2668 | 0,1983 | |||
| AEO / American Eagle Outfitters, Inc. | 0,01 | 0,09 | 0,2568 | 0,2568 | |||||
| PLOW / Douglas Dynamics, Inc. | 0,00 | 24,05 | 0,09 | 57,89 | 0,2495 | 0,0556 | |||
| OGN / Organon & Co. | 0,01 | 2,52 | 0,09 | -33,83 | 0,2434 | -0,2033 | |||
| CVBF / CVB Financial Corp. | 0,00 | -3,48 | 0,09 | 3,61 | 0,2366 | -0,0430 | |||
| SFNC / Simmons First National Corporation | 0,00 | 23,28 | 0,09 | 14,67 | 0,2362 | -0,0175 | |||
| ZION / Zions Bancorporation, National Association | 0,00 | 1,05 | 0,09 | 6,25 | 0,2335 | -0,0378 | |||
| SMP / Standard Motor Products, Inc. | 0,00 | 28,32 | 0,08 | 58,49 | 0,2331 | 0,0528 | |||
| DAN / Dana Incorporated | 0,00 | 23,71 | 0,08 | 58,49 | 0,2323 | 0,0538 | |||
| VRTS / Virtus Investment Partners, Inc. | 0,00 | 0,08 | 0,2320 | 0,2320 | |||||
| MLKN / MillerKnoll, Inc. | 0,00 | 269,26 | 0,08 | 277,27 | 0,2305 | 0,1552 | |||
| KALU / Kaiser Aluminum Corporation | 0,00 | 25,30 | 0,08 | 66,00 | 0,2281 | 0,0592 | |||
| KVUE / Kenvue Inc. | 0,00 | -55,98 | 0,08 | -61,79 | 0,2246 | -0,4903 | |||
| GEF / Greif, Inc. | 0,00 | 23,21 | 0,08 | 46,30 | 0,2178 | 0,0349 | |||
| SCL / Stepan Company | 0,00 | 0,08 | 0,2172 | 0,2172 | |||||
| KFRC / Kforce Inc. | 0,00 | 0,08 | 0,2162 | 0,2162 | |||||
| ASH / Ashland Inc. | 0,00 | 0,08 | 0,2161 | 0,2161 | |||||
| SJM / Steven Madden, Ltd. | 0,00 | 0,08 | 0,2142 | 0,2142 | |||||
| SXC / SunCoke Energy, Inc. | 0,01 | 36,11 | 0,08 | 26,23 | 0,2137 | 0,0080 | |||
| MTN / Vail Resorts, Inc. | 0,00 | -57,54 | 0,08 | -58,38 | 0,2126 | -0,4110 | |||
| BMY / Bristol-Myers Squibb Company | 0,00 | -60,04 | 0,08 | -69,84 | 0,2100 | -0,6370 | |||
| CAKE / The Cheesecake Factory Incorporated | 0,00 | 21,88 | 0,08 | 56,25 | 0,2079 | 0,0459 | |||
| WGO / Winnebago Industries, Inc. | 0,00 | 0,08 | 0,2060 | 0,2060 | |||||
| COP / ConocoPhillips | 0,00 | 0,07 | 0,1993 | 0,1993 | |||||
| PP1 / Papa John's International, Inc. | 0,00 | 0,07 | 0,1980 | 0,1980 | |||||
| ALTM / Arcadium Lithium plc | 0,00 | -26,55 | 0,07 | -37,39 | 0,1977 | -0,1904 | |||
| LAZ / Lazard, Inc. | 0,00 | -61,88 | 0,07 | -58,02 | 0,1887 | -0,3577 | |||
| HI / Hillenbrand, Inc. | 0,00 | 0,07 | 0,1872 | 0,1872 | |||||
| TRN / Trinity Industries, Inc. | 0,00 | 62,04 | 0,07 | 55,81 | 0,1851 | 0,0400 | |||
| EMBC / Embecta Corp. | 0,01 | 162,14 | 0,07 | 100,00 | 0,1834 | 0,0708 | |||
| IVZ / Invesco Ltd. | 0,00 | -61,85 | 0,06 | -60,49 | 0,1767 | -0,3683 | |||
| BAX / Baxter International Inc. | 0,00 | -34,77 | 0,06 | -42,73 | 0,1755 | -0,1965 | |||
| CSGS / CSG Systems International, Inc. | 0,00 | 20,94 | 0,06 | 31,25 | 0,1750 | 0,0111 | |||
| PR / Permian Resources Corporation | 0,00 | 0,06 | 0,1734 | 0,1734 | |||||
| AROC / Archrock, Inc. | 0,00 | 11,83 | 0,06 | 5,08 | 0,1720 | -0,0268 | |||
| CRGY / Crescent Energy Company | 0,01 | 23,75 | 0,06 | -4,62 | 0,1706 | -0,0498 | |||
| UPS / United Parcel Service, Inc. | 0,00 | -61,73 | 0,06 | -64,74 | 0,1676 | -0,4161 | |||
| VTRS / Viatris Inc. | 0,01 | -61,99 | 0,06 | -61,44 | 0,1647 | -0,3520 | |||
| UVV / Universal Corporation | 0,00 | 109,09 | 0,06 | 114,81 | 0,1618 | 0,0707 | |||
| 0LVK / Westlake Corporation | 0,00 | 0,06 | 0,1515 | 0,1515 | |||||
| LEA / Lear Corporation | 0,00 | 0,05 | 0,1496 | 0,1496 | |||||
| VSH / Vishay Intertechnology, Inc. | 0,00 | 0,05 | 0,1440 | 0,1440 | |||||
| TGNA / TEGNA Inc. | 0,00 | -7,30 | 0,05 | -14,75 | 0,1432 | -0,0622 | |||
| MC / Moelis & Company | 0,00 | -20,08 | 0,05 | -15,00 | 0,1409 | -0,0610 | |||
| DCOM / Dime Community Bancshares, Inc. | 0,00 | -25,63 | 0,05 | -27,94 | 0,1354 | -0,0950 | |||
| JW.A / John Wiley & Sons Inc. - Class A | 0,00 | 23,33 | 0,05 | 23,08 | 0,1334 | 0,0013 | |||
| SCS / Steelcase Inc. | 0,00 | 71,38 | 0,05 | 65,52 | 0,1332 | 0,0333 | |||
| FIBK / First Interstate BancSystem, Inc. | 0,00 | -35,70 | 0,05 | -35,62 | 0,1312 | -0,1169 | |||
| LYB / LyondellBasell Industries N.V. | 0,00 | -75,06 | 0,05 | -79,74 | 0,1309 | -0,6500 | |||
| SM / SM Energy Company | 0,00 | 0,05 | 0,1276 | 0,1276 | |||||
| RYI / Ryerson Holding Corporation | 0,00 | 23,73 | 0,05 | 18,42 | 0,1244 | -0,0065 | |||
| WWW / Wolverine World Wide, Inc. | 0,00 | 9,52 | 0,04 | 46,67 | 0,1210 | 0,0170 | |||
| MUR / Murphy Oil Corporation | 0,00 | 37,57 | 0,04 | 7,89 | 0,1138 | -0,0139 | |||
| GDEN / Golden Entertainment, Inc. | 0,00 | 0,04 | 0,1103 | 0,1103 | |||||
| KMT / Kennametal Inc. | 0,00 | -17,91 | 0,04 | -11,36 | 0,1092 | -0,0417 | |||
| PBI / Pitney Bowes Inc. | 0,00 | -6,35 | 0,04 | 11,76 | 0,1065 | -0,0089 | |||
| ASIX / AdvanSix Inc. | 0,00 | 0,04 | 0,1016 | 0,1016 | |||||
| BBY / Best Buy Co., Inc. | 0,00 | -74,63 | 0,04 | -77,22 | 0,1008 | -0,4320 | |||
| HOG / Harley-Davidson, Inc. | 0,00 | 0,04 | 0,1005 | 0,1005 | |||||
| VLO / Valero Energy Corporation | 0,00 | 0,04 | 0,0992 | 0,0992 | |||||
| GBX / The Greenbrier Companies, Inc. | 0,00 | 0,04 | 0,0987 | 0,0987 | |||||
| IPAR / Interparfums, Inc. | 0,00 | 0,04 | 0,0973 | 0,0973 | |||||
| BTU / Peabody Energy Corporation | 0,00 | 0,04 | 0,0961 | 0,0961 | |||||
| USB / U.S. Bancorp | 0,00 | 0,03 | 0,0945 | 0,0945 | |||||
| HTO / H2O America | 0,00 | 22,91 | 0,03 | 17,24 | 0,0941 | -0,0044 | |||
| APOG / Apogee Enterprises, Inc. | 0,00 | 0,03 | 0,0938 | 0,0938 | |||||
| KLG / WK Kellogg Co | 0,00 | 33,50 | 0,03 | 6,25 | 0,0938 | -0,0136 | |||
| NSP / Insperity, Inc. | 0,00 | 0,03 | 0,0937 | 0,0937 | |||||
| PAX / Patria Investments Limited | 0,00 | 0,03 | 0,0937 | 0,0937 | |||||
| KBH / KB Home | 0,00 | 0,03 | 0,0932 | 0,0932 | |||||
| SPB / Spectrum Brands Holdings, Inc. | 0,00 | 0,03 | 0,0931 | 0,0931 | |||||
| OTTR / Otter Tail Corporation | 0,00 | 22,56 | 0,03 | 17,86 | 0,0931 | -0,0038 | |||
| MTH / Meritage Homes Corporation | 0,00 | 0,03 | 0,0926 | 0,0926 | |||||
| UTL / Unitil Corporation | 0,00 | 0,03 | 0,0922 | 0,0922 | |||||
| SBSI / Southside Bancshares, Inc. | 0,00 | -54,81 | 0,03 | -54,17 | 0,0919 | -0,1529 | |||
| CRC / California Resources Corporation | 0,00 | 0,03 | 0,0918 | 0,0918 | |||||
| PEBO / Peoples Bancorp Inc. | 0,00 | -65,56 | 0,03 | -64,89 | 0,0917 | -0,2246 | |||
| VLY / Valley National Bancorp | 0,00 | 0,03 | 0,0913 | 0,0913 | |||||
| EPC / Edgewell Personal Care Company | 0,00 | 0,03 | 0,0910 | 0,0910 | |||||
| LBRT / Liberty Energy Inc. | 0,00 | 0,03 | 0,0909 | 0,0909 | |||||
| SLVM / Sylvamo Corporation | 0,00 | 0,03 | 0,0909 | 0,0909 | |||||
| PFS / Provident Financial Services, Inc. | 0,00 | 0,03 | 0,0899 | 0,0899 | |||||
| AVNT / Avient Corporation | 0,00 | 0,03 | 0,0897 | 0,0897 | |||||
| BLMN / Bloomin' Brands, Inc. | 0,00 | -3,80 | 0,03 | 14,29 | 0,0896 | -0,0053 | |||
| CWH / Camping World Holdings, Inc. | 0,00 | 0,03 | 0,0881 | 0,0881 | |||||
| CNA / CNA Financial Corporation | 0,00 | 0,03 | 0,0856 | 0,0856 | |||||
| US40428X1072 / HSBC U.S. Government Money Market Fund | 0,03 | 175,76 | 0,03 | 170,00 | 0,0767 | 0,0427 | |||
| US38141W2733 / Goldman Sachs Financial Square Funds - Government Fund | 0,03 | 175,76 | 0,03 | 170,00 | 0,0767 | 0,0427 | |||
| US61747C7074 / Morgan Stanley Institutional Liquidity Funds Government Portfolio, Institutional Class | 0,03 | 175,76 | 0,03 | 170,00 | 0,0767 | 0,0427 | |||
| US8252528851 / Invesco Government & Agency Portfolio, Institutional Class | 0,03 | 175,76 | 0,03 | 170,00 | 0,0767 | 0,0427 | |||
| SLB / SLB N.V. | 0,00 | 0,03 | 0,0763 | 0,0763 | |||||
| SFL / SFL Corporation Ltd. | 0,00 | -74,76 | 0,02 | -74,60 | 0,0445 | -0,1677 | |||
| NOG / Northern Oil and Gas, Inc. | 0,00 | -71,61 | 0,02 | -73,33 | 0,0440 | -0,1583 | |||
| LCII / LCI Industries | 0,00 | -64,71 | 0,02 | -63,41 | 0,0420 | -0,0977 | |||
| DLX / Deluxe Corporation | 0,00 | -74,77 | 0,01 | -75,86 | 0,0407 | -0,1554 | |||
| KTB / Kontoor Brands, Inc. | 0,00 | -64,33 | 0,01 | -64,86 | 0,0378 | -0,0883 | |||
| OKE / ONEOK, Inc. | 0,00 | -95,96 | 0,01 | -96,72 | 0,0334 | -1,1953 | |||
| MSEX / Middlesex Water Company | 0,00 | -73,77 | 0,01 | -80,00 | 0,0183 | -0,0826 | |||
| M / Macy's, Inc. | 0,00 | -93,17 | 0,01 | -93,67 | 0,0138 | -0,2523 | |||
| JBSS / John B. Sanfilippo & Son, Inc. | 0,00 | -86,96 | 0,00 | -90,91 | 0,0073 | -0,0693 | |||
| GOGL / Golden Ocean Group Limited | 0,00 | -100,00 | 0,00 | -100,00 | -0,1631 | ||||
| XOM / Exxon Mobil Corporation | 0,00 | -100,00 | 0,00 | -100,00 | -0,5378 | ||||
| WU / The Western Union Company | 0,00 | -100,00 | 0,00 | -100,00 | -0,7674 | ||||
| OMC / Omnicom Group Inc. | 0,00 | -100,00 | 0,00 | -100,00 | -0,3980 | ||||
| HUN / Huntsman Corporation | 0,00 | -100,00 | 0,00 | -100,00 | -0,1452 | ||||
| RUSSELL 2000 MINI INDEX FUTURE SEP25 / DE (N/A) | -0,51 | -1,3888 | -1,3888 | ||||||
| S P 500 EMINI FUTURE SEP25 / DE (N/A) | -1,47 | -4,0298 | -4,0298 |