Grundlæggende statistik
| Porteføljeværdi | $ 43.726.000 |
| Nuværende stillinger | 62 |
Seneste beholdninger, ydeevne, AUM (fra 13F, 13D)
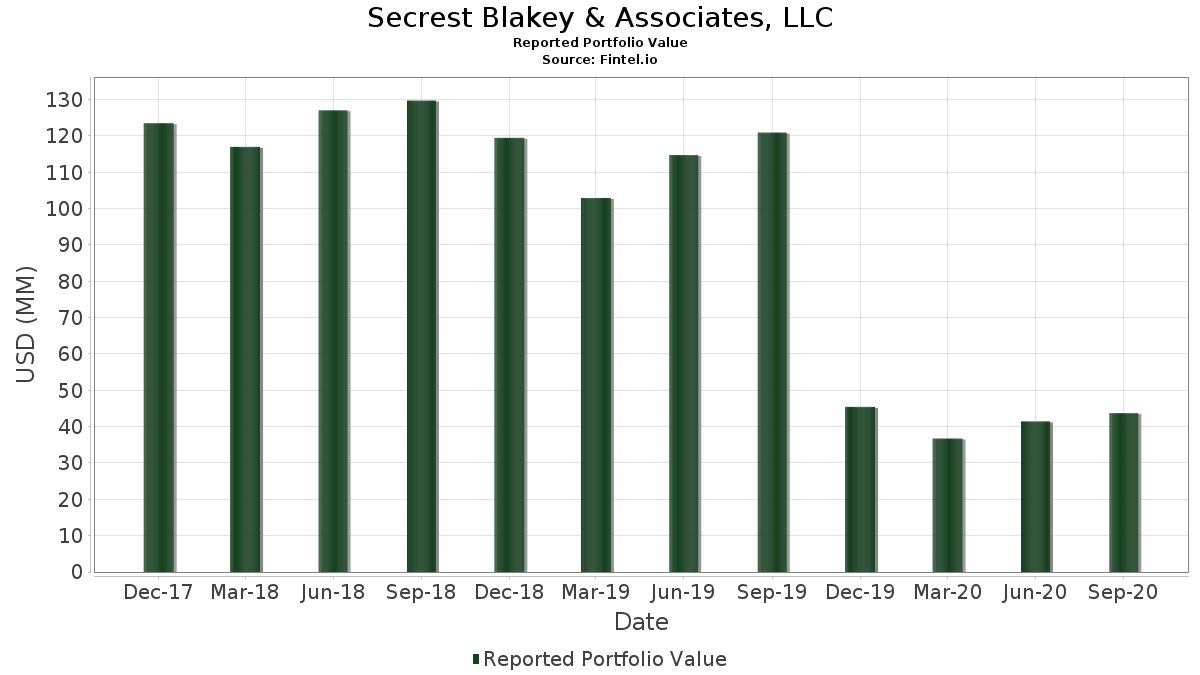
Secrest Blakey & Associates, LLC har afsløret 62 samlede besiddelser i deres seneste SEC-arkivering. Den seneste porteføljeværdi er beregnet til at være $ 43.726.000 USD. Faktiske aktiver under forvaltning (AUM) er denne værdi plus kontanter (som ikke er oplyst). Secrest Blakey & Associates, LLCs største beholdninger er PIMCO Dynamic Income Fund (US:XPDIX) , PGIM ETF Trust - PGIM Corporate Bond 5-10 Year ETF (US:PCI) , iShares Trust - iShares MSCI USA Min Vol Factor ETF (US:USMV) , Apple Inc. (US:AAPL) , and Enbridge Inc. (US:ENB) . Secrest Blakey & Associates, LLCs nye stillinger omfatter The Williams Companies, Inc. (US:WMB) , Amplify ETF Trust - Amplify BlackSwan Growth & Treasury Core ETF (US:SWAN) , Amplify ETF Trust - Amplify Online Retail ETF (US:IBUY) , .
Top øger dette kvartal
Vi bruger ændringen i porteføljeallokeringen, fordi dette er den mest meningsfulde metrik. Ændringer kan skyldes handler eller ændringer i aktiekurser.
| Sikkerhed | Aktier (MM) |
Værdi (MM$) |
Portefølje % | ΔPortefølje % |
|---|---|---|---|---|
| 0,02 | 1,89 | 4,3155 | 1,8983 | |
| 0,04 | 0,75 | 1,7152 | 1,7152 | |
| 0,04 | 1,24 | 2,8450 | 1,2335 | |
| 0,01 | 1,42 | 3,2429 | 0,9029 | |
| 0,01 | 0,27 | 0,6106 | 0,6106 | |
| 0,01 | 0,22 | 0,5031 | 0,5031 | |
| 0,00 | 0,21 | 0,4711 | 0,4711 | |
| 0,03 | 0,95 | 2,1841 | 0,3434 | |
| 0,02 | 1,42 | 3,2521 | 0,2679 | |
| 0,01 | 0,53 | 1,2029 | 0,1584 |
Top falder i dette kvartal
Vi bruger ændringen i porteføljeallokeringen, fordi dette er den mest meningsfulde metrik. Ændringer kan skyldes handler eller ændringer i aktiekurser.
| Sikkerhed | Aktier (MM) |
Værdi (MM$) |
Portefølje % | ΔPortefølje % |
|---|---|---|---|---|
| 0,14 | 3,50 | 7,9998 | -6.918.837,8942 | |
| 0,01 | 0,55 | 1,2647 | -1,7315 | |
| 0,01 | 0,32 | 0,7273 | -1,1544 | |
| 0,00 | 0,00 | -1,1025 | ||
| 0,00 | 0,00 | -1,0156 | ||
| 0,00 | 0,83 | 1,9050 | -0,9923 | |
| 0,01 | 0,23 | 0,5283 | -0,9095 | |
| 0,00 | 0,00 | -0,7382 | ||
| 0,01 | 0,96 | 2,2001 | -0,3740 | |
| 0,02 | 0,52 | 1,1801 | -0,3036 |
13F og Fondsarkivering
Denne formular blev indsendt den 2020-11-13 for rapporteringsperioden 2020-09-30. Klik på linkikonet for at se den fulde transaktionshistorik.
Opgrader for at låse op for premium-data og eksportere til Excel ![]() .
.
| Sikkerhed | Type | Gennemsnitlig aktiekurs | Aktier (MM) |
Δ Aktier (%) |
Værdi ($MM) |
Δ Aktier (%) |
Portefølje (%) |
ΔPortefølje (%) |
|
|---|---|---|---|---|---|---|---|---|---|
| XPDIX / PIMCO Dynamic Income Fund | 0,14 | 18,88 | 3,50 | 21,97 | 7,9998 | -6.918.837,8942 | |||
| PCI / PGIM ETF Trust - PGIM Corporate Bond 5-10 Year ETF | 0,15 | -2,87 | 3,07 | 5,83 | 7,0164 | 0,0228 | |||
| USMV / iShares Trust - iShares MSCI USA Min Vol Factor ETF | 0,05 | -0,04 | 2,87 | 5,05 | 6,5705 | -0,0275 | |||
| AAPL / Apple Inc. | 0,02 | 493,30 | 1,89 | 88,32 | 4,3155 | 1,8983 | |||
| ENB / Enbridge Inc. | 0,05 | 10,16 | 1,56 | 5,76 | 3,5677 | 0,0093 | |||
| VZ / Verizon Communications Inc. | 0,03 | -3,54 | 1,50 | 4,08 | 3,4419 | -0,0465 | |||
| MRK / Merck & Co., Inc. | 0,02 | 0,02 | 1,45 | 7,27 | 3,3070 | 0,0550 | |||
| SCHD / Schwab Strategic Trust - Schwab U.S. Dividend Equity ETF | 0,03 | 3,01 | 1,43 | 10,10 | 3,2658 | 0,1369 | |||
| DUK / Duke Energy Corporation | 0,02 | 3,73 | 1,42 | 14,96 | 3,2521 | 0,2679 | |||
| UPS / United Parcel Service, Inc. | 0,01 | -2,39 | 1,42 | 46,19 | 3,2429 | 0,9029 | |||
| T / AT&T Inc. | 0,04 | 97,44 | 1,24 | 86,23 | 2,8450 | 1,2335 | |||
| OSI ETF TR / OSHARES US QUALT (67110P407) | 0,03 | 1,10 | 0,0000 | ||||||
| LLY / Eli Lilly and Company | 0,01 | 0,00 | 0,96 | -9,84 | 2,2001 | -0,3740 | |||
| PFE / Pfizer Inc. | 0,03 | 11,55 | 0,95 | 25,16 | 2,1841 | 0,3434 | |||
| SO / The Southern Company | 0,02 | -5,63 | 0,94 | -1,37 | 2,1429 | -0,1489 | |||
| C.WSA / Citigroup, Inc. | 0,00 | 0,25 | 0,90 | 3,79 | 2,0651 | -0,0337 | |||
| PG / The Procter & Gamble Company | 0,01 | -4,03 | 0,89 | 11,63 | 2,0423 | 0,1123 | |||
| NEE / NextEra Energy, Inc. | 0,00 | -40,00 | 0,83 | -30,64 | 1,9050 | -0,9923 | |||
| GIS / General Mills, Inc. | 0,01 | 0,12 | 0,77 | 0,26 | 1,7610 | -0,0918 | |||
| JNJ / Johnson & Johnson | 0,01 | -0,98 | 0,77 | 4,90 | 1,7610 | -0,0098 | |||
| PM / Philip Morris International Inc. | 0,01 | 1,75 | 0,76 | 9,01 | 1,7427 | 0,0564 | |||
| WMB / The Williams Companies, Inc. | 0,04 | 0,75 | 1,7152 | 1,7152 | |||||
| AMGN / Amgen Inc. | 0,00 | -0,11 | 0,69 | 7,63 | 1,5803 | 0,0315 | |||
| AEP / American Electric Power Company, Inc. | 0,01 | -6,52 | 0,66 | -4,08 | 1,5071 | -0,1502 | |||
| LOW / Lowe's Companies, Inc. | 0,00 | -8,89 | 0,63 | 11,92 | 1,4385 | 0,0827 | |||
| INTC / Intel Corporation | 0,01 | 11,25 | 0,58 | -3,63 | 1,3356 | -0,1263 | |||
| D / Dominion Energy, Inc. | 0,01 | -54,25 | 0,55 | -55,48 | 1,2647 | -1,7315 | |||
| KO / The Coca-Cola Company | 0,01 | 6,29 | 0,55 | 17,56 | 1,2555 | 0,1289 | |||
| EFAV / iShares Trust - iShares MSCI EAFE Min Vol Factor ETF | 0,01 | 0,00 | 0,54 | 3,26 | 1,2327 | -0,0266 | |||
| MO / Altria Group, Inc. | 0,01 | 23,40 | 0,53 | 21,48 | 1,2029 | 0,1584 | |||
| XOM / Exxon Mobil Corporation | 0,02 | 9,45 | 0,52 | -16,10 | 1,1801 | -0,3036 | |||
| PII / Polaris Inc. | 0,00 | 0,00 | 0,42 | 2,16 | 0,9720 | -0,0316 | |||
| CVS / CVS Health Corporation | 0,01 | 0,01 | 0,41 | -10,09 | 0,9377 | -0,1624 | |||
| RY / Royal Bank of Canada | 0,01 | 0,00 | 0,38 | 3,56 | 0,8645 | -0,0161 | |||
| CMP / Compass Minerals International, Inc. | 0,01 | -14,25 | 0,36 | 4,32 | 0,8279 | -0,0092 | |||
| TFC / Truist Financial Corporation | 0,01 | 10,21 | 0,36 | 11,80 | 0,8233 | 0,0465 | |||
| CVX / Chevron Corporation | 0,00 | -1,33 | 0,34 | -20,52 | 0,7707 | -0,2522 | |||
| MMM / 3M Company | 0,00 | 0,89 | 0,33 | 3,80 | 0,7501 | -0,0122 | |||
| JPM / JPMorgan Chase & Co. | 0,00 | 13,87 | 0,33 | 16,85 | 0,7456 | 0,0725 | |||
| MSFT / Microsoft Corporation | 0,00 | -1,54 | 0,32 | 1,58 | 0,7364 | -0,0283 | |||
| WELL / Welltower Inc. | 0,01 | -61,66 | 0,32 | -59,23 | 0,7273 | -1,1544 | |||
| SYY / Sysco Corporation | 0,01 | -7,50 | 0,32 | 5,33 | 0,7227 | -0,0010 | |||
| AMZN / Amazon.com, Inc. | 0,00 | 0,00 | 0,32 | 14,13 | 0,7204 | 0,0546 | |||
| IBM / International Business Machines Corporation | 0,00 | 0,00 | 0,30 | 0,66 | 0,6975 | -0,0334 | |||
| PPG / PPG Industries, Inc. | 0,00 | 0,00 | 0,29 | 14,90 | 0,6701 | 0,0549 | |||
| GPC / Genuine Parts Company | 0,00 | -0,14 | 0,27 | 9,27 | 0,6198 | 0,0215 | |||
| ADP / Automatic Data Processing, Inc. | 0,00 | 0,00 | 0,27 | -6,25 | 0,6175 | -0,0773 | |||
| SWAN / Amplify ETF Trust - Amplify BlackSwan Growth & Treasury Core ETF | 0,01 | 0,27 | 0,6106 | 0,6106 | |||||
| GLW / Corning Incorporated | 0,01 | 0,00 | 0,26 | 24,88 | 0,5855 | 0,0909 | |||
| PEP / PepsiCo, Inc. | 0,00 | 0,00 | 0,25 | 5,02 | 0,5740 | -0,0025 | |||
| EMR / Emerson Electric Co. | 0,00 | 0,19 | 0,24 | 5,80 | 0,5420 | 0,0016 | |||
| HIW / Highwoods Properties, Inc. | 0,01 | 0,06 | 0,24 | -9,92 | 0,5397 | -0,0923 | |||
| VTR / Ventas, Inc. | 0,01 | -66,15 | 0,23 | -61,24 | 0,5283 | -0,9095 | |||
| SCHW / The Charles Schwab Corporation | 0,01 | 0,22 | 0,5031 | 0,5031 | |||||
| MCD / McDonald's Corporation | 0,00 | 0,21 | 0,4711 | 0,4711 | |||||
| GE / General Electric Company | 0,02 | 0,01 | 0,10 | -9,17 | 0,2264 | -0,0365 | |||
| TEF / Telefónica, S.A. - Depositary Receipt (Common Stock) | 0,02 | 4,16 | 0,06 | -25,33 | 0,1281 | -0,0529 | |||
| IBUY / Amplify ETF Trust - Amplify Online Retail ETF | 0,00 | 0,05 | 0,1189 | 0,1189 | |||||
| LYG / Lloyds Banking Group plc - Depositary Receipt (Common Stock) | 0,01 | -24,02 | 0,01 | -33,33 | 0,0320 | -0,0186 | |||
| SCHF / Schwab Strategic Trust - Schwab International Equity ETF | 0,00 | 0,00 | 0,01 | 7,69 | 0,0320 | 0,0007 | |||
| AAPL / Apple Inc. | Call | 0,00 | 0,01 | 0,0274 | 0,0274 | ||||
| SENS / Senseonics Holdings, Inc. | 0,01 | 0,00 | 0,01 | 0,00 | 0,0114 | -0,0006 | |||
| O / Realty Income Corporation | 0,00 | -100,00 | 0,00 | -100,00 | -0,7382 | ||||
| TSLA / Tesla, Inc. | Put | 0,00 | -100,00 | 0,00 | 0,0000 | 0,0000 | |||
| PPL / PPL Corporation | 0,00 | -100,00 | 0,00 | -100,00 | -1,1025 | ||||
| WFC / Wells Fargo & Company | 0,00 | -100,00 | 0,00 | -100,00 | -1,0156 |