Grundlæggende statistik
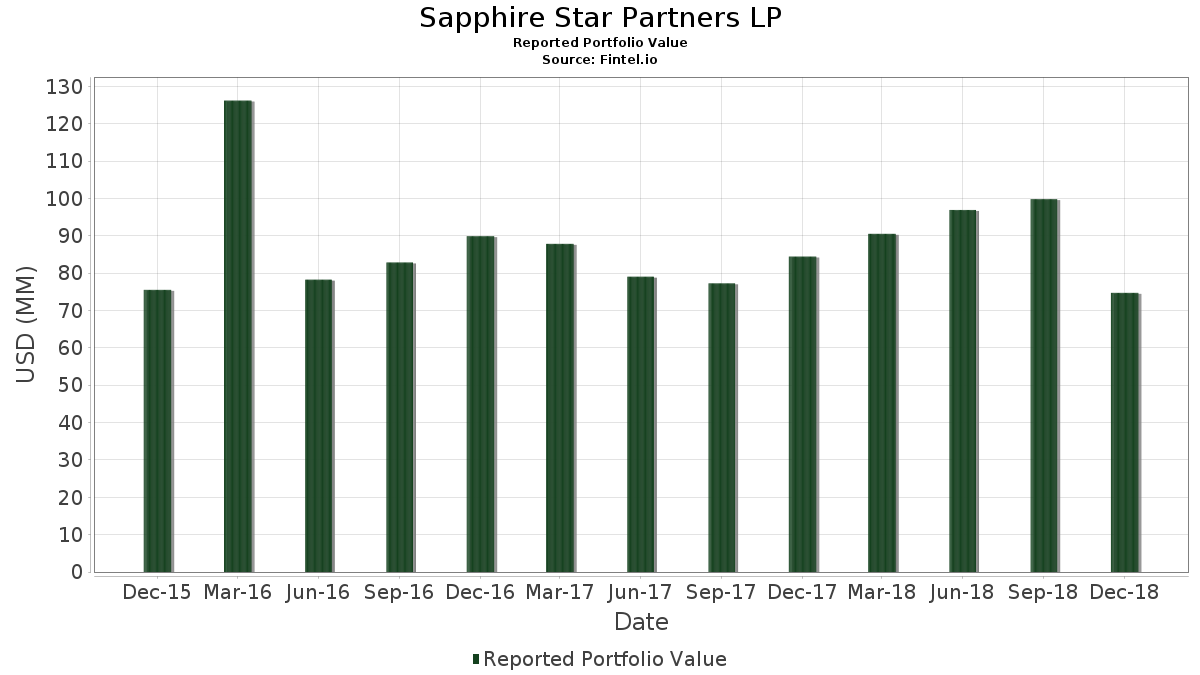
| Porteføljeværdi | $ 74.713.000 |
| Nuværende stillinger | 99 |
Seneste beholdninger, ydeevne, AUM (fra 13F, 13D)
Sapphire Star Partners LP har afsløret 99 samlede besiddelser i deres seneste SEC-arkivering. Den seneste porteføljeværdi er beregnet til at være $ 74.713.000 USD. Faktiske aktiver under forvaltning (AUM) er denne værdi plus kontanter (som ikke er oplyst). Sapphire Star Partners LPs største beholdninger er Microsoft Corporation (US:MSFT) , Amgen Inc. (US:AMGN) , SPDR S&P 500 ETF (US:SPY) , Union Pacific Corporation (US:UNP) , and Paycom Software, Inc. (US:PAYC) . Sapphire Star Partners LPs nye stillinger omfatter World Wrestling Entertainment, Inc. - Class A (US:WWE) , Universal Insurance Holdings, Inc. (US:UVE) , SPDR Series Trust - State Street SPDR Portfolio S&P 500 High Dividend ETF (US:SPYD) , Duluth Holdings Inc. (US:DLTH) , and NeoGenomics, Inc. (US:NEO) .
Top øger dette kvartal
Vi bruger ændringen i porteføljeallokeringen, fordi dette er den mest meningsfulde metrik. Ændringer kan skyldes handler eller ændringer i aktiekurser.
| Sikkerhed | Aktier (MM) |
Værdi (MM$) |
Portefølje % | ΔPortefølje % |
|---|---|---|---|---|
| 0,03 | 1,37 | 1,8337 | 1,8337 | |
| 0,01 | 1,34 | 1,7962 | 1,7962 | |
| 0,01 | 1,30 | 1,7373 | 1,7373 | |
| 0,03 | 1,30 | 1,7346 | 1,7346 | |
| 0,01 | 1,20 | 1,6075 | 1,6075 | |
| 0,02 | 1,09 | 1,4589 | 1,4589 | |
| 0,02 | 1,08 | 1,4482 | 1,4482 | |
| 0,02 | 1,05 | 1,4081 | 1,4081 | |
| 0,02 | 1,05 | 1,4000 | 1,4000 | |
| 0,06 | 1,03 | 1,3759 | 1,3759 |
Top falder i dette kvartal
Vi bruger ændringen i porteføljeallokeringen, fordi dette er den mest meningsfulde metrik. Ændringer kan skyldes handler eller ændringer i aktiekurser.
| Sikkerhed | Aktier (MM) |
Værdi (MM$) |
Portefølje % | ΔPortefølje % |
|---|---|---|---|---|
| 0,00 | 0,00 | -1,9710 | ||
| 0,00 | 0,30 | 0,3962 | -1,5367 | |
| 0,00 | 0,00 | -1,2295 | ||
| 0,00 | 0,00 | -1,1623 | ||
| 0,00 | 0,00 | -0,9269 | ||
| 0,00 | 0,00 | -0,5812 | ||
| 0,00 | 0,00 | -0,3367 | ||
| 0,00 | 0,00 | -0,3046 | ||
| 0,00 | 0,00 | -0,2645 | ||
| 0,00 | 0,00 | -0,2615 |
13F og Fondsarkivering
Denne formular blev indsendt den 2019-02-12 for rapporteringsperioden 2018-12-31. Klik på linkikonet for at se den fulde transaktionshistorik.
Opgrader for at låse op for premium-data og eksportere til Excel ![]() .
.
| Sikkerhed | Type | Gennemsnitlig aktiekurs | Aktier (MM) |
Δ Aktier (%) |
Værdi ($MM) |
Δ Aktier (%) |
Portefølje (%) |
ΔPortefølje (%) |
|
|---|---|---|---|---|---|---|---|---|---|
| MSFT / Microsoft Corporation | 0,04 | -2,70 | 4,20 | -13,60 | 5,6215 | 0,7507 | |||
| AMGN / Amgen Inc. | 0,02 | -3,18 | 3,47 | -9,08 | 4,6485 | 0,8208 | |||
| SPY / SPDR S&P 500 ETF | 0,01 | -3,81 | 2,52 | -17,30 | 3,3783 | 0,3201 | |||
| UNP / Union Pacific Corporation | 0,02 | 11,53 | 2,41 | -5,35 | 3,2217 | 0,6735 | |||
| PAYC / Paycom Software, Inc. | 0,02 | 0,96 | 2,38 | -20,41 | 3,1828 | 0,1888 | |||
| MCD / McDonald's Corporation | 0,01 | -3,74 | 2,27 | 2,16 | 3,0423 | 0,8128 | |||
| INTC / Intel Corporation | 0,05 | 0,45 | 2,13 | -0,33 | 2,8456 | 0,7083 | |||
| MRK / Merck & Co., Inc. | 0,03 | 18,94 | 1,97 | 28,11 | 2,6354 | 1,0953 | |||
| FAF / First American Financial Corporation | 0,03 | 1,86 | 1,37 | -11,90 | 1,8337 | 1,8337 | |||
| CBRL / Cracker Barrel Old Country Store, Inc. | 0,01 | 2,10 | 1,34 | 10,91 | 1,7962 | 1,7962 | |||
| IVV / iShares Trust - iShares Core S&P 500 ETF | 0,01 | -48,27 | 1,30 | -55,52 | 1,7373 | 1,7373 | |||
| FN / Fabrinet | 0,03 | 2,63 | 1,30 | 13,78 | 1,7346 | 1,7346 | |||
| MLAB / Mesa Laboratories, Inc. | 0,01 | 2,63 | 1,20 | 15,15 | 1,6075 | 1,6075 | |||
| NVEE / NV5 Global, Inc. | 0,02 | 1,28 | 1,09 | -29,22 | 1,4589 | 1,4589 | |||
| LPLA / LPL Financial Holdings Inc. | 0,02 | 2,16 | 1,08 | -3,31 | 1,4482 | 1,4482 | |||
| NOVT / Novanta Inc. | 0,02 | 2,21 | 1,05 | -5,90 | 1,4081 | 1,4081 | |||
| WING / Wingstop Inc. | 0,02 | 2,60 | 1,05 | -3,51 | 1,4000 | 1,4000 | |||
| HCKT / The Hackett Group, Inc. | 0,06 | 2,76 | 1,03 | -18,35 | 1,3759 | 1,3759 | |||
| DIS / The Walt Disney Company | 0,01 | -13,24 | 1,03 | -18,61 | 1,3759 | 0,1104 | |||
| CHH / Choice Hotels International, Inc. | 0,01 | 2,59 | 1,01 | -11,90 | 1,3572 | 1,3572 | |||
| HTGC / Hercules Capital, Inc. | 0,09 | 0,00 | 0,95 | -16,05 | 1,2675 | 1,2675 | |||
| INGN / Inogen, Inc. | 0,01 | 1,86 | 0,92 | -48,18 | 1,2367 | 1,2367 | |||
| CPK / Chesapeake Utilities Corporation | 0,01 | 2,61 | 0,92 | -0,43 | 1,2274 | 1,2274 | |||
| WWE / World Wrestling Entertainment, Inc. - Class A | 0,01 | 0,91 | 1,2220 | 1,2220 | |||||
| MORN / Morningstar, Inc. | 0,01 | 2,59 | 0,89 | -10,43 | 1,1952 | 1,1952 | |||
| AXP / American Express Company | 0,01 | -9,69 | 0,83 | -19,16 | 1,1123 | 0,0822 | |||
| VNQ / Vanguard Specialized Funds - Vanguard Real Estate ETF | 0,01 | 0,04 | 0,80 | -7,45 | 1,0641 | 1,0641 | |||
| JPM / JPMorgan Chase & Co. | 0,01 | -6,21 | 0,79 | -18,97 | 1,0574 | 0,0804 | |||
| OLLI / Ollie's Bargain Outlet Holdings, Inc. | 0,01 | 2,06 | 0,78 | -29,42 | 1,0467 | 1,0467 | |||
| NJR / New Jersey Resources Corporation | 0,02 | 2,68 | 0,77 | 1,71 | 1,0360 | 1,0360 | |||
| MED / Medifast, Inc. | 0,01 | 70,05 | 0,77 | -4,23 | 1,0306 | 1,0306 | |||
| MLI / Mueller Industries, Inc. | 0,03 | -12,63 | 0,76 | -29,57 | 1,0199 | 1,0199 | |||
| SVA / Sinovac Biotech, Ltd. | 0,10 | 3,27 | 0,72 | -6,48 | 0,9664 | 0,1928 | |||
| JNJ / Johnson & Johnson | 0,01 | -6,78 | 0,71 | -13,01 | 0,9490 | 0,9490 | |||
| CSX / CSX Corporation | 0,01 | -7,77 | 0,71 | -22,67 | 0,9449 | 0,9449 | |||
| CNC / Centene Corporation | 0,01 | -2,28 | 0,70 | -22,22 | 0,9369 | 0,0351 | |||
| SGH / SMART Global Holdings, Inc. | 0,02 | 2,65 | 0,69 | 5,97 | 0,9262 | 0,9262 | |||
| / Cantel Medical Corp. | 0,01 | 2,63 | 0,69 | -17,05 | 0,9249 | 0,9249 | |||
| PLCE / The Children's Place, Inc. | 0,01 | 2,63 | 0,68 | -27,75 | 0,9061 | 0,9061 | |||
| LLY / Eli Lilly and Company | 0,01 | -6,89 | 0,67 | 0,45 | 0,8941 | 0,2277 | |||
| PEP / PepsiCo, Inc. | 0,01 | -6,56 | 0,66 | -7,61 | 0,8780 | 0,1666 | |||
| UVE / Universal Insurance Holdings, Inc. | 0,02 | 0,65 | 0,8740 | 0,8740 | |||||
| GVA / Granite Construction Incorporated | 0,02 | -1,30 | 0,65 | -13,14 | 0,8673 | 0,8673 | |||
| CONN / Conn's, Inc. | 0,03 | 2,60 | 0,64 | -45,27 | 0,8513 | 0,8513 | |||
| WCG / Wellcare Health Plans, Inc. | 0,00 | -0,45 | 0,62 | -26,73 | 0,8365 | 0,8365 | |||
| PLOW / Douglas Dynamics, Inc. | 0,02 | 2,16 | 0,62 | -16,60 | 0,8339 | 0,8339 | |||
| GTY / Getty Realty Corp. | 0,02 | 2,80 | 0,60 | 5,96 | 0,8084 | 0,8084 | |||
| CRM / Salesforce, Inc. | 0,00 | 0,00 | 0,60 | -13,86 | 0,8071 | 0,1057 | |||
| ENTA / Enanta Pharmaceuticals, Inc. | 0,01 | 2,47 | 0,59 | -15,19 | 0,7924 | 0,7924 | |||
| WMT / Walmart Inc. | 0,01 | -7,46 | 0,58 | -8,11 | 0,7736 | 0,1434 | |||
| AAPL / Apple Inc. | 0,00 | -5,75 | 0,58 | -34,06 | 0,7723 | -0,1045 | |||
| LMRK / Landmark Infrastructure Partners LP - Unit | 0,05 | 0,06 | 0,57 | -16,74 | 0,7589 | 0,7589 | |||
| ECHO / Echo Global Logistics Inc | 0,03 | 124,28 | 0,57 | 47,01 | 0,7576 | 0,7576 | |||
| TTGT / TechTarget, Inc. | 0,05 | 138,45 | 0,56 | 50,00 | 0,7469 | 0,7469 | |||
| TSS / Total System Services, Inc. | 0,01 | -0,03 | 0,55 | -17,64 | 0,7375 | 0,0671 | |||
| MAIN / Main Street Capital Corporation | 0,02 | 2,68 | 0,54 | -9,93 | 0,7281 | 0,7281 | |||
| CSFL / Centerstate Banks, Inc. | 0,03 | 2,57 | 0,53 | -23,05 | 0,7147 | 0,7147 | |||
| KR / The Kroger Co. | 0,02 | -7,25 | 0,53 | -12,44 | 0,7067 | 0,1025 | |||
| GLW / Corning Incorporated | 0,02 | -6,99 | 0,52 | -20,43 | 0,6987 | 0,0414 | |||
| PG / The Procter & Gamble Company | 0,01 | -6,78 | 0,51 | 3,05 | 0,6773 | 0,1853 | |||
| SPYD / SPDR Series Trust - State Street SPDR Portfolio S&P 500 High Dividend ETF | 0,01 | 0,50 | 0,6732 | 0,6732 | |||||
| CSCO / Cisco Systems, Inc. | 0,01 | 32,93 | 0,47 | 18,30 | 0,6318 | 0,2319 | |||
| TTMI / TTM Technologies, Inc. | 0,05 | 2,58 | 0,46 | -37,23 | 0,6184 | 0,6184 | |||
| US28470R1023 / Eldorado Resorts, Inc. | 0,01 | 2,73 | 0,46 | -23,49 | 0,6103 | 0,6103 | |||
| IBTX / Independent Bank Group, Inc. | 0,01 | 2,65 | 0,45 | -29,23 | 0,5996 | 0,5996 | |||
| USRT / iShares Trust - iShares Core U.S. REIT ETF | 0,01 | 1,91 | 0,44 | -5,53 | 0,5943 | 0,5943 | |||
| MSCI / MSCI Inc. | 0,00 | -0,07 | 0,44 | -17,17 | 0,5876 | 0,0565 | |||
| IDXX / IDEXX Laboratories, Inc. | 0,00 | -0,04 | 0,43 | -25,57 | 0,5729 | 0,5729 | |||
| ICHR / Ichor Holdings, Ltd. | 0,03 | 2,85 | 0,42 | -18,06 | 0,5648 | 0,5648 | |||
| SHAK / Shake Shack Inc. | 0,01 | 2,82 | 0,42 | -25,84 | 0,5608 | 0,5608 | |||
| TTWO / Take-Two Interactive Software, Inc. | 0,00 | -0,05 | 0,41 | -25,55 | 0,5461 | -0,0030 | |||
| NFLX / Netflix, Inc. | 0,00 | 0,00 | 0,40 | -28,52 | 0,5367 | -0,0254 | |||
| SWM / Schweitzer-Mauduit International, Inc. | 0,02 | 2,73 | 0,39 | -32,70 | 0,5180 | 0,5180 | |||
| FCN / FTI Consulting, Inc. | 0,01 | 2,15 | 0,39 | -6,99 | 0,5166 | 0,5166 | |||
| AMT / American Tower Corporation | 0,00 | -0,51 | 0,37 | 8,12 | 0,4992 | 0,4992 | |||
| ILMN / Illumina, Inc. | 0,00 | 0,36 | 0,4818 | 0,4818 | |||||
| DLTH / Duluth Holdings Inc. | 0,01 | 0,35 | 0,4698 | 0,4698 | |||||
| TNET / TriNet Group, Inc. | 0,01 | 2,65 | 0,34 | -23,50 | 0,4618 | 0,4618 | |||
| DBI / Designer Brands Inc. | 0,01 | 46,38 | 0,33 | 6,73 | 0,4457 | 0,4457 | |||
| LMT / Lockheed Martin Corporation | 0,00 | -0,50 | 0,32 | -24,64 | 0,4216 | 0,0028 | |||
| MKC / McCormick & Company, Incorporated | 0,00 | -0,09 | 0,31 | 5,48 | 0,4122 | 0,1197 | |||
| C / Citigroup Inc. | 0,01 | 0,00 | 0,30 | -27,38 | 0,3975 | -0,0123 | |||
| ABMD / Abiomed Inc. | 0,00 | -78,78 | 0,30 | -84,66 | 0,3962 | -1,5367 | |||
| BAC / Bank of America Corporation | 0,01 | -13,18 | 0,29 | -27,34 | 0,3948 | -0,0120 | |||
| NKE / NIKE, Inc. | 0,00 | -0,91 | 0,29 | -13,35 | 0,3908 | 0,3908 | |||
| MA / Mastercard Incorporated | 0,00 | 0,00 | 0,28 | -15,27 | 0,3788 | 0,0441 | |||
| CPRT / Copart, Inc. | 0,01 | -0,09 | 0,28 | -7,00 | 0,3734 | 0,3734 | |||
| NVDA / NVIDIA Corporation | 0,00 | 0,00 | 0,27 | -52,49 | 0,3574 | 0,3574 | |||
| IJH / iShares Trust - iShares Core S&P Mid-Cap ETF | 0,00 | -4,12 | 0,26 | -20,78 | 0,3520 | 0,3520 | |||
| ANET / Arista Networks Inc | 0,00 | -0,08 | 0,26 | -20,92 | 0,3440 | 0,3440 | |||
| ULTA / Ulta Beauty, Inc. | 0,00 | 0,00 | 0,24 | -13,12 | 0,3279 | 0,3279 | |||
| NEO / NeoGenomics, Inc. | 0,02 | 0,22 | 0,2958 | 0,2958 | |||||
| DOW / Dow Inc. | 0,00 | 0,00 | 0,21 | -16,73 | 0,2864 | 0,0289 | |||
| BRK.B / Berkshire Hathaway Inc. | 0,00 | 0,00 | 0,20 | -4,67 | 0,2730 | 0,0586 | |||
| VRSN / VeriSign, Inc. | 0,00 | -0,07 | 0,20 | -7,73 | 0,2717 | 0,0513 | |||
| DGX / Quest Diagnostics Incorporated | 0,00 | 0,07 | 0,0937 | 0,0937 | |||||
| LITE / Lumentum Holdings Inc. | 0,00 | 0,03 | 0,0375 | 0,0375 | |||||
| ENSV / Enservco Corporation | 0,01 | 0,00 | 0,01 | -54,55 | 0,0067 | 0,0067 | |||
| LPL FINL HLDGS INC / (50213H100) | 0,00 | 0,00 | 0,0000 | ||||||
| GDEN / Golden Entertainment, Inc. | 0,00 | -100,00 | 0,00 | -100,00 | 0,0000 | ||||
| CGNX / Cognex Corporation | 0,00 | -100,00 | 0,00 | -100,00 | 0,0000 | ||||
| CAT / Caterpillar Inc. | 0,00 | -100,00 | 0,00 | -100,00 | -1,9710 | ||||
| HP / Helmerich & Payne, Inc. | 0,00 | -100,00 | 0,00 | -100,00 | 0,0000 | ||||
| SCHW / The Charles Schwab Corporation | 0,00 | -100,00 | 0,00 | -100,00 | -0,1232 | ||||
| NSC / Norfolk Southern Corporation | 0,00 | -100,00 | 0,00 | -100,00 | -0,0060 | ||||
| TMUS / T-Mobile US, Inc. | 0,00 | -100,00 | 0,00 | -100,00 | 0,0000 | ||||
| PDCO / Patterson Companies, Inc. | 0,00 | -100,00 | 0,00 | -100,00 | -0,1713 | ||||
| US98884U1088 / ZAGG Inc | 0,00 | -100,00 | 0,00 | -100,00 | 0,0000 | ||||
| NUAN / Nuance Communications Inc | 0,00 | -100,00 | 0,00 | -100,00 | -0,1563 | ||||
| OEC / Orion S.A. | 0,00 | -100,00 | 0,00 | -100,00 | 0,0000 | ||||
| OCLR / Oclaro, Inc | 0,00 | -100,00 | 0,00 | -100,00 | 0,0000 | ||||
| TOL / Toll Brothers, Inc. | 0,00 | -100,00 | 0,00 | -100,00 | 0,0000 | ||||
| WLL / Whiting Petroleum Corp (New) | 0,00 | -100,00 | 0,00 | -100,00 | 0,0000 | ||||
| QRVO / Qorvo, Inc. | 0,00 | -100,00 | 0,00 | -100,00 | -0,3046 | ||||
| KEY / KeyCorp | 0,00 | -100,00 | 0,00 | -100,00 | 0,0000 | ||||
| PKI / Revvity Inc. | 0,00 | -100,00 | 0,00 | -100,00 | -0,2214 | ||||
| GRUB / Just Eat Takeaway.com N.V. - ADR (New) | 0,00 | -100,00 | 0,00 | -100,00 | 0,0000 | ||||
| ESIO / Electro Scientific Industries, Inc. | 0,00 | -100,00 | 0,00 | -100,00 | 0,0000 | ||||
| META / Meta Platforms, Inc. | 0,00 | -100,00 | 0,00 | -100,00 | -0,3367 | ||||
| ALGN / Align Technology, Inc. | 0,00 | -100,00 | 0,00 | -100,00 | -0,2615 | ||||
| NDSN / Nordson Corporation | 0,00 | -100,00 | 0,00 | -100,00 | 0,0000 | ||||
| PSX / Phillips 66 | 0,00 | -100,00 | 0,00 | -100,00 | -0,9269 | ||||
| PYPL / PayPal Holdings, Inc. | 0,00 | -100,00 | 0,00 | -100,00 | -0,2645 | ||||
| FSLR / First Solar, Inc. | 0,00 | -100,00 | 0,00 | -100,00 | -0,0591 | ||||
| NEM / Newmont Corporation | 0,00 | -100,00 | 0,00 | -100,00 | -0,0311 | ||||
| T / AT&T Inc. | 0,00 | -100,00 | 0,00 | -100,00 | -1,1623 | ||||
| STI / Solidion Technology, Inc. | 0,00 | -100,00 | 0,00 | -100,00 | -0,1673 | ||||
| PH / Parker-Hannifin Corporation | 0,00 | -100,00 | 0,00 | -100,00 | -0,0571 | ||||
| V / Visa Inc. | 0,00 | -100,00 | 0,00 | -100,00 | -0,0651 | ||||
| XOM / Exxon Mobil Corporation | 0,00 | -100,00 | 0,00 | -100,00 | -1,2295 | ||||
| EXPE / Expedia Group, Inc. | 0,00 | -100,00 | 0,00 | -100,00 | -0,0832 | ||||
| HD / The Home Depot, Inc. | 0,00 | -100,00 | 0,00 | -100,00 | -0,5812 | ||||
| NI / NiSource Inc. | 0,00 | -100,00 | 0,00 | -100,00 | -0,0020 | ||||
| WP / Worldpay, Inc. | 0,00 | -100,00 | 0,00 | -100,00 | 0,0000 | ||||
| RACE / Ferrari N.V. | 0,00 | -100,00 | 0,00 | -100,00 | 0,0000 | ||||
| HRL / Hormel Foods Corporation | 0,00 | -100,00 | 0,00 | -100,00 | -0,1022 | ||||
| SGYPQ / SYNERGY PHARMACEUTICALS INC DEL | 0,00 | -100,00 | 0,00 | -100,00 | 0,0000 |