Grundlæggende statistik
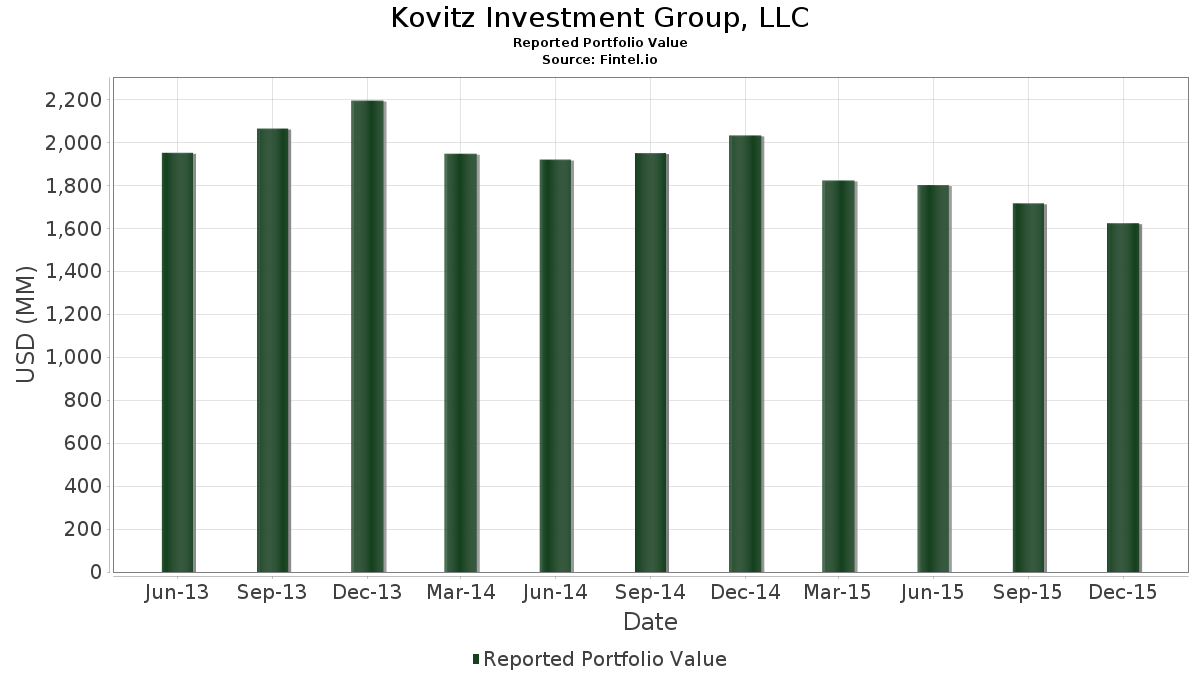
| Porteføljeværdi | $ 1.623.456.000 |
| Nuværende stillinger | 124 |
Seneste beholdninger, ydeevne, AUM (fra 13F, 13D)
Kovitz Investment Group, LLC har afsløret 124 samlede besiddelser i deres seneste SEC-arkivering. Den seneste porteføljeværdi er beregnet til at være $ 1.623.456.000 USD. Faktiske aktiver under forvaltning (AUM) er denne værdi plus kontanter (som ikke er oplyst). Kovitz Investment Group, LLCs største beholdninger er Berkshire Hathaway Inc. (US:BRK.B) , Jacobs Solutions Inc. (US:J) , The Boeing Company (US:BA) , Quanta Services, Inc. (US:PWR) , and Apple Inc. (US:AAPL) . Kovitz Investment Group, LLCs nye stillinger omfatter PGIM Global High Yield Fund, Inc (US:GHY) , Macy's, Inc. (US:M) , Ares Dynamic Credit Allocation Fund, Inc. (US:ARDC) , Allspring Multi-Sector Income Fund (US:ERC) , and Barings Global Short Duration High Yield Fund (US:BGH) .
Top øger dette kvartal
Vi bruger ændringen i porteføljeallokeringen, fordi dette er den mest meningsfulde metrik. Ændringer kan skyldes handler eller ændringer i aktiekurser.
| Sikkerhed | Aktier (MM) |
Værdi (MM$) |
Portefølje % | ΔPortefølje % |
|---|---|---|---|---|
| J / Jacobs Solutions Inc. | 2,24 | 93,89 | 5,7832 | 0,8420 |
| BA / The Boeing Company | 0,60 | 86,17 | 5,3079 | 0,6270 |
| GM / General Motors Company | 1,77 | 60,31 | 3,7147 | 0,5352 |
| JEF / Jefferies Financial Group Inc. | 2,13 | 37,10 | 2,2850 | 0,5106 |
| 19041P105 / CBS Corp. | 0,92 | 43,53 | 2,6813 | 0,4911 |
| GOOG / Alphabet Inc. | 0,05 | 35,35 | 2,1777 | 0,4875 |
| JPM / JPMorgan Chase & Co. | 1,04 | 68,67 | 4,2296 | 0,4270 |
| BRK.B / Berkshire Hathaway Inc. | 0,73 | 96,19 | 5,9253 | 0,3968 |
| BAC / Bank of America Corporation | 3,57 | 60,15 | 3,7051 | 0,3855 |
| VMI / Valmont Industries, Inc. | 0,34 | 36,26 | 2,2333 | 0,2890 |
Top falder i dette kvartal
Vi bruger ændringen i porteføljeallokeringen, fordi dette er den mest meningsfulde metrik. Ændringer kan skyldes handler eller ændringer i aktiekurser.
| Sikkerhed | Aktier (MM) |
Værdi (MM$) |
Portefølje % | ΔPortefølje % |
|---|---|---|---|---|
| ACN / Accenture plc | 0,29 | 30,58 | 1,8834 | -3,2813 |
| AIG / American International Group, Inc. | 0,49 | 30,42 | 1,8740 | -1,7332 |
| EXPD / Expeditors International of Washington, Inc. | 0,00 | 0,00 | -1,5348 | |
| VIAB / Viacom, Inc. | 0,00 | 0,00 | -1,0107 | |
| SPY / State Street SPDR S&P 500 ETF Trust (Put) | 0,02 | 3,88 | 0,2391 | -0,9369 |
| DIS / The Walt Disney Company | 0,30 | 31,31 | 1,9284 | -0,5971 |
| BBBY / Bed Bath & Beyond, Inc. | 0,83 | 40,09 | 2,4694 | -0,4205 |
| HOG / Harley-Davidson, Inc. | 0,43 | 19,38 | 1,1939 | -0,1804 |
| BHI / Baker Hughes Inc. | 0,41 | 18,91 | 1,1647 | -0,0951 |
| AXP / American Express Company | 0,42 | 28,97 | 1,7844 | -0,0573 |
13F og Fondsarkivering
Denne formular blev indsendt den 2016-02-16 for rapporteringsperioden 2015-12-31. Klik på linkikonet for at se den fulde transaktionshistorik.
Opgrader for at låse op for premium-data og eksportere til Excel ![]() .
.
| Sikkerhed | Type | Gennemsnitlig aktiekurs | Aktier (MM) |
Δ Aktier (%) |
Værdi ($MM) |
Δ Aktier (%) |
Portefølje (%) |
ΔPortefølje (%) |
|
|---|---|---|---|---|---|---|---|---|---|
| BRK.B / Berkshire Hathaway Inc. | 0,73 | 0,14 | 96,19 | 1,40 | 5,9253 | 0,3968 | |||
| J / Jacobs Solutions Inc. | 2,24 | -1,20 | 93,89 | 10,73 | 5,7832 | 0,8420 | |||
| BA / The Boeing Company | 0,60 | -2,84 | 86,17 | 7,28 | 5,3079 | 0,6270 | |||
| PWR / Quanta Services, Inc. | 4,23 | 18,26 | 85,60 | -1,08 | 5,2729 | 0,2297 | |||
| AAPL / Apple Inc. | 0,76 | 2,79 | 79,72 | -1,89 | 4,9108 | 0,1752 | |||
| JPM / JPMorgan Chase & Co. | 1,04 | -2,83 | 68,67 | 5,23 | 4,2296 | 0,4270 | |||
| GM / General Motors Company | 1,77 | -2,44 | 60,31 | 10,53 | 3,7147 | 0,5352 | |||
| BAC / Bank of America Corporation | 3,57 | -2,25 | 60,15 | 5,59 | 3,7051 | 0,3855 | |||
| BK / The Bank of New York Mellon Corporation | 1,20 | -0,79 | 49,53 | 4,46 | 3,0509 | 0,2877 | |||
| KSS / Kohl's Corporation | 0,95 | 2,43 | 45,17 | 5,35 | 2,7823 | 0,2836 | |||
| WFC / Wells Fargo & Company | 0,82 | -0,60 | 44,80 | 5,23 | 2,7597 | 0,2786 | |||
| 19041P105 / CBS Corp. | 0,92 | -1,95 | 43,53 | 15,82 | 2,6813 | 0,4911 | |||
| BBBY / Bed Bath & Beyond, Inc. | 0,83 | -4,47 | 40,09 | -19,16 | 2,4694 | -0,4205 | |||
| HAL / Halliburton Company | 1,11 | -1,65 | 37,64 | -5,30 | 2,3186 | 0,0023 | |||
| JEF / Jefferies Financial Group Inc. | 2,13 | 41,94 | 37,10 | 21,83 | 2,2850 | 0,5106 | |||
| VMI / Valmont Industries, Inc. | 0,34 | -2,74 | 36,26 | 8,67 | 2,2333 | 0,2890 | |||
| GOOG / Alphabet Inc. | 0,05 | -2,27 | 35,35 | 21,90 | 2,1777 | 0,4875 | |||
| AON / Aon plc | 0,36 | -0,00 | 33,62 | 4,06 | 2,0706 | 0,1881 | |||
| CVS / CVS Health Corporation | 0,34 | -2,73 | 33,45 | -1,43 | 2,0605 | 0,0827 | |||
| UPS / United Parcel Service, Inc. | 0,34 | 0,11 | 33,11 | -2,38 | 2,0394 | 0,0629 | |||
| WMT / Walmart Inc. | 0,53 | 0,44 | 32,45 | -5,04 | 1,9987 | 0,0074 | |||
| DIS / The Walt Disney Company | 0,30 | -29,74 | 31,31 | -27,76 | 1,9284 | -0,5971 | |||
| ACN / Accenture plc | 0,29 | -23,79 | 30,58 | -65,50 | 1,8834 | -3,2813 | |||
| AIG / American International Group, Inc. | 0,49 | -54,93 | 30,42 | -50,85 | 1,8740 | -1,7332 | |||
| AXP / American Express Company | 0,42 | -2,30 | 28,97 | -8,34 | 1,7844 | -0,0573 | |||
| PCP / Precision Castparts Corporation | 0,12 | -8,40 | 27,26 | -7,48 | 1,6793 | -0,0379 | |||
| C / Citigroup Inc. | 0,52 | -2,91 | 27,07 | 1,27 | 1,6672 | 0,1097 | |||
| GLW / Corning Incorporated | 1,47 | -0,79 | 26,86 | 5,93 | 1,6544 | 0,1768 | |||
| KMX / CarMax, Inc. | 0,41 | 6,91 | 22,36 | -2,74 | 1,3776 | 0,0376 | |||
| KO / The Coca-Cola Company | 0,49 | -2,27 | 21,25 | 4,65 | 1,3091 | 0,1257 | |||
| GOOGL / Alphabet Inc. | 0,03 | -6,24 | 21,05 | 14,28 | 1,2966 | 0,2232 | |||
| AAL / American Airlines Group Inc. | 0,46 | -2,20 | 19,64 | 6,67 | 1,2096 | 0,1368 | |||
| HOG / Harley-Davidson, Inc. | 0,43 | -0,59 | 19,38 | -17,81 | 1,1939 | -0,1804 | |||
| BHI / Baker Hughes Inc. | 0,41 | -1,37 | 18,91 | -12,53 | 1,1647 | -0,0951 | |||
| WBA / Walgreens Boots Alliance, Inc. | 0,19 | -0,91 | 16,45 | 1,54 | 1,0133 | 0,0692 | |||
| FTI / TechnipFMC plc | 0,46 | 4,06 | 13,34 | -2,62 | 0,8216 | 0,0234 | |||
| SLB / SLB N.V. | 0,17 | -1,17 | 11,81 | -0,06 | 0,7275 | 0,0388 | |||
| 00B65Z9D7 / Noble Corporation plc | 0,74 | -10,42 | 7,76 | -13,38 | 0,4781 | -0,0441 | |||
| QCOM / QUALCOMM Incorporated | 0,10 | 17,73 | 5,12 | 9,53 | 0,3157 | 0,0430 | |||
| NKE / NIKE, Inc. | 0,08 | 93,89 | 4,99 | -1,46 | 0,3072 | 0,0123 | |||
| SPY / State Street SPDR S&P 500 ETF Trust | 0,02 | 154,49 | 4,35 | 170,73 | 0,2678 | 0,1742 | |||
| JNJ / Johnson & Johnson | 0,04 | -0,48 | 4,00 | 9,53 | 0,2463 | 0,0336 | |||
| UNP / Union Pacific Corporation | 0,05 | 1.427,62 | 3,94 | 1.250,68 | 0,2429 | 0,2259 | |||
| SPY / State Street SPDR S&P 500 ETF Trust | Put | 0,02 | -13,90 | 3,88 | -80,76 | 0,2391 | -0,9369 | ||
| MCD / McDonald's Corporation | 0,03 | -2,27 | 3,71 | 17,18 | 0,2286 | 0,0440 | |||
| ESV / Ensco plc | 0,23 | -7,26 | 3,50 | 1,36 | 0,2155 | 0,0144 | |||
| GE / General Electric Company | 0,11 | -0,43 | 3,38 | 22,98 | 0,2080 | 0,0480 | |||
| NEE / NextEra Energy, Inc. | 0,03 | -1,24 | 3,31 | 5,18 | 0,2038 | 0,0205 | |||
| BRK.A / Berkshire Hathaway Inc. | 0,00 | -20,00 | 3,17 | -18,93 | 0,1950 | -0,0326 | |||
| XOM / Exxon Mobil Corporation | 0,04 | -1,41 | 2,95 | 3,37 | 0,1815 | 0,0154 | |||
| GHY / PGIM Global High Yield Fund, Inc | 0,20 | 2,88 | 0,1774 | 0,1774 | |||||
| HD / The Home Depot, Inc. | 0,02 | -0,41 | 2,70 | 14,01 | 0,1664 | 0,0283 | |||
| PG / The Procter & Gamble Company | 0,03 | -1,17 | 2,68 | 9,08 | 0,1650 | 0,0219 | |||
| ABBV / AbbVie Inc. | 0,04 | -0,37 | 2,40 | 8,50 | 0,1478 | 0,0189 | |||
| ALL / The Allstate Corporation | 0,04 | -0,97 | 2,23 | 5,60 | 0,1372 | 0,0143 | |||
| ABT / Abbott Laboratories | 0,04 | -0,49 | 1,98 | 11,09 | 0,1222 | 0,0181 | |||
| PEP / PepsiCo, Inc. | 0,02 | 0,27 | 1,95 | 6,26 | 0,1202 | 0,0132 | |||
| ED / Consolidated Edison, Inc. | 0,03 | -0,66 | 1,92 | -4,53 | 0,1183 | 0,0011 | |||
| M / Macy's, Inc. | 0,05 | 1,89 | 0,1163 | 0,1163 | |||||
| VEU / Vanguard International Equity Index Funds - Vanguard FTSE All-World ex-US ETF | 0,04 | 9,70 | 1,68 | 11,72 | 0,1034 | 0,0158 | |||
| IBM / International Business Machines Corporation | 0,01 | -0,87 | 1,57 | -5,91 | 0,0970 | -0,0005 | |||
| ARDC / Ares Dynamic Credit Allocation Fund, Inc. | 0,12 | 1,56 | 0,0963 | 0,0963 | |||||
| ERC / Allspring Multi-Sector Income Fund | 0,13 | 1,50 | 0,0923 | 0,0923 | |||||
| BGH / Barings Global Short Duration High Yield Fund | 0,09 | 1,49 | 0,0920 | 0,0920 | |||||
| MIN / MFS Intermediate Income Trust | 0,31 | 1,41 | 0,0871 | 0,0871 | |||||
| DSU / BlackRock Debt Strategies Fund, Inc. | 0,42 | 1,41 | 0,0865 | 0,0865 | |||||
| VTI / Vanguard Index Funds - Vanguard Total Stock Market ETF | 0,01 | -35,67 | 1,40 | -32,02 | 0,0862 | -0,0338 | |||
| RTX / RTX Corporation | 0,01 | -1,39 | 1,39 | 6,44 | 0,0855 | 0,0095 | |||
| MCR / MFS Charter Income Trust | 0,18 | 1,38 | 0,0851 | 0,0851 | |||||
| FRA / BlackRock Floating Rate Income Strategies Fund, Inc. | 0,10 | 1,34 | 0,0827 | 0,0827 | |||||
| MMT / MFS Multimarket Income Trust | 0,22 | 1,19 | 0,0735 | 0,0735 | |||||
| VWO / Vanguard International Equity Index Funds - Vanguard FTSE Emerging Markets ETF | 0,04 | -11,79 | 1,18 | -12,83 | 0,0728 | -0,0062 | |||
| HIO / Western Asset High Income Opportunity Fund Inc. | 0,24 | 1,14 | 0,0704 | 0,0704 | |||||
| HTR / Brookfield Total Return Fund Inc. | 0,05 | 1,14 | 0,0703 | 0,0703 | |||||
| LLY / Eli Lilly and Company | 0,01 | 0,00 | 1,12 | 0,72 | 0,0693 | 0,0042 | |||
| LOV / Spark Networks SE - ADR | 0,28 | -16,08 | 1,09 | 12,19 | 0,0674 | 0,0106 | |||
| US9576671088 / Western Asset Variable Rate Strategic Fund Inc. | 0,06 | 1,02 | 0,0631 | 0,0631 | |||||
| TSI / TCW Strategic Income Fund, Inc. | 0,19 | 1,02 | 0,0631 | 0,0631 | |||||
| IVV / iShares Trust - iShares Core S&P 500 ETF | 0,00 | -3,40 | 1,02 | 2,72 | 0,0628 | 0,0050 | |||
| DFS / Discover Financial Services | 0,02 | 0,00 | 1,01 | 3,15 | 0,0625 | 0,0052 | |||
| EVG / Eaton Vance Short Duration Diversified Income Fund | 0,07 | 0,99 | 0,0607 | 0,0607 | |||||
| CSCO / Cisco Systems, Inc. | 0,04 | 0,42 | 0,97 | 3,86 | 0,0596 | 0,0053 | |||
| CVX / Chevron Corporation | 0,01 | -3,59 | 0,97 | 10,01 | 0,0596 | 0,0083 | |||
| EFA / iShares Trust - iShares MSCI EAFE ETF | 0,01 | 0,00 | 0,88 | 2,44 | 0,0543 | 0,0042 | |||
| MMM / 3M Company | 0,01 | -0,88 | 0,85 | 5,32 | 0,0524 | 0,0053 | |||
| OIH / VanEck ETF Trust - VanEck Oil Services ETF | 0,03 | 0,84 | 0,0518 | 0,0518 | |||||
| VNQ / Vanguard Specialized Funds - Vanguard Real Estate ETF | 0,01 | 0,00 | 0,81 | 5,48 | 0,0498 | 0,0051 | |||
| MHY / Man ETF Series Trust - Man Active High Yield ETF | 0,17 | 0,76 | 0,0471 | 0,0471 | |||||
| XHNWX / Pioneer Diversified High Income | 0,05 | 0,76 | 0,0465 | 0,0465 | |||||
| VCR / Vanguard World Fund - Vanguard Consumer Discretionary ETF | 0,01 | 0,72 | 0,0446 | 0,0446 | |||||
| PFE / Pfizer Inc. | 0,02 | -0,25 | 0,72 | 2,55 | 0,0445 | 0,0035 | |||
| WEC / WEC Energy Group, Inc. | 0,01 | 0,71 | 0,0437 | 0,0437 | |||||
| MAN / ManpowerGroup Inc. | 0,01 | 0,00 | 0,67 | 2,94 | 0,0410 | 0,0033 | |||
| ROST / Ross Stores, Inc. | 0,01 | -9,16 | 0,64 | 0,79 | 0,0394 | 0,0024 | |||
| MSFT / Microsoft Corporation | 0,01 | 1,07 | 0,61 | 26,78 | 0,0373 | 0,0095 | |||
| INTC / Intel Corporation | 0,02 | -1,18 | 0,58 | 12,89 | 0,0356 | 0,0058 | |||
| NOV / NOV Inc. | 0,02 | 0,55 | 0,0339 | 0,0339 | |||||
| RDS.A / Shell Plc - ADR (Representing Ordinary Shares - Class A) | 0,01 | -0,88 | 0,52 | -4,26 | 0,0318 | 0,0004 | |||
| AMGN / Amgen Inc. | 0,00 | 1,11 | 0,52 | 18,62 | 0,0318 | 0,0064 | |||
| COP / ConocoPhillips | 0,01 | -15,16 | 0,49 | -17,51 | 0,0302 | -0,0044 | |||
| DE / Deere & Company | 0,01 | 132,15 | 0,49 | 139,02 | 0,0302 | 0,0182 | |||
| BP / BP p.l.c. - Depositary Receipt (Common Stock) | 0,01 | -3,96 | 0,44 | -1,56 | 0,0273 | 0,0011 | |||
| FDX / FedEx Corporation | 0,00 | 0,00 | 0,43 | 3,64 | 0,0263 | 0,0023 | |||
| CAT / Caterpillar Inc. | 0,01 | -9,29 | 0,42 | -5,61 | 0,0259 | -0,0001 | |||
| VZ / Verizon Communications Inc. | 0,01 | -54,79 | 0,42 | -52,01 | 0,0257 | -0,0250 | |||
| TJX / The TJX Companies, Inc. | 0,01 | 0,00 | 0,41 | -0,72 | 0,0254 | 0,0012 | |||
| / Diamond Offshore Drilling Inc | 0,02 | -16,34 | 0,40 | 2,06 | 0,0245 | 0,0018 | |||
| DOW / Dow Inc. | 0,01 | 0,45 | 0,37 | 21,93 | 0,0226 | 0,0226 | |||
| VB / Vanguard Index Funds - Vanguard Small-Cap ETF | 0,00 | 5,38 | 0,36 | 8,06 | 0,0223 | 0,0028 | |||
| EMR / Emerson Electric Co. | 0,01 | -6,36 | 0,35 | 1,44 | 0,0217 | 0,0015 | |||
| IWD / iShares Trust - iShares Russell 1000 Value ETF | 0,00 | -2,58 | 0,33 | 2,46 | 0,0205 | 0,0016 | |||
| MRK / Merck & Co., Inc. | 0,01 | 3,13 | 0,33 | 10,51 | 0,0201 | 0,0029 | |||
| XRT / SPDR Series Trust - State Street SPDR S&P Retail ETF | 0,01 | 0,33 | 0,0200 | 0,0200 | |||||
| KMB / Kimberly-Clark Corporation | 0,00 | -2,52 | 0,30 | 13,85 | 0,0182 | 0,0031 | |||
| T / AT&T Inc. | 0,01 | -7,29 | 0,28 | -1,78 | 0,0170 | 0,0006 | |||
| AEE / Ameren Corporation | 0,01 | -1,64 | 0,26 | 0,39 | 0,0160 | 0,0009 | |||
| PSX / Phillips 66 | 0,00 | -3,12 | 0,25 | 3,25 | 0,0156 | 0,0013 | |||
| TGT / Target Corporation | 0,00 | -15,56 | 0,23 | -21,93 | 0,0145 | -0,0031 | |||
| NTRS / Northern Trust Corporation | 0,00 | -1,09 | 0,23 | 4,59 | 0,0140 | 0,0013 | |||
| GWW / W.W. Grainger, Inc. | 0,00 | 9,45 | 0,22 | 3,24 | 0,0137 | 0,0011 | |||
| CMCSA / Comcast Corporation | 0,00 | 0,22 | 0,0136 | 0,0136 | |||||
| MDT / Medtronic plc | 0,00 | 0,22 | 0,0134 | 0,0134 | |||||
| XISDX / Prudential Short Duration High | 0,01 | 0,20 | 0,0122 | 0,0122 | |||||
| BGT / BlackRock Floating Rate Income Trust | 0,02 | 0,20 | 0,0120 | 0,0120 | |||||
| EXPD / Expeditors International of Washington, Inc. | 0,00 | -100,00 | 0,00 | -100,00 | -1,5348 | ||||
| VIAB / Viacom, Inc. | 0,00 | -100,00 | 0,00 | -100,00 | -1,0107 | ||||
| OCN / Ocwen Financial Corporation | 0,00 | -100,00 | 0,00 | -100,00 | -0,0557 |