Grundlæggende statistik
| Porteføljeværdi | $ 4.192.554.030 |
| Nuværende stillinger | 147 |
Seneste beholdninger, ydeevne, AUM (fra 13F, 13D)
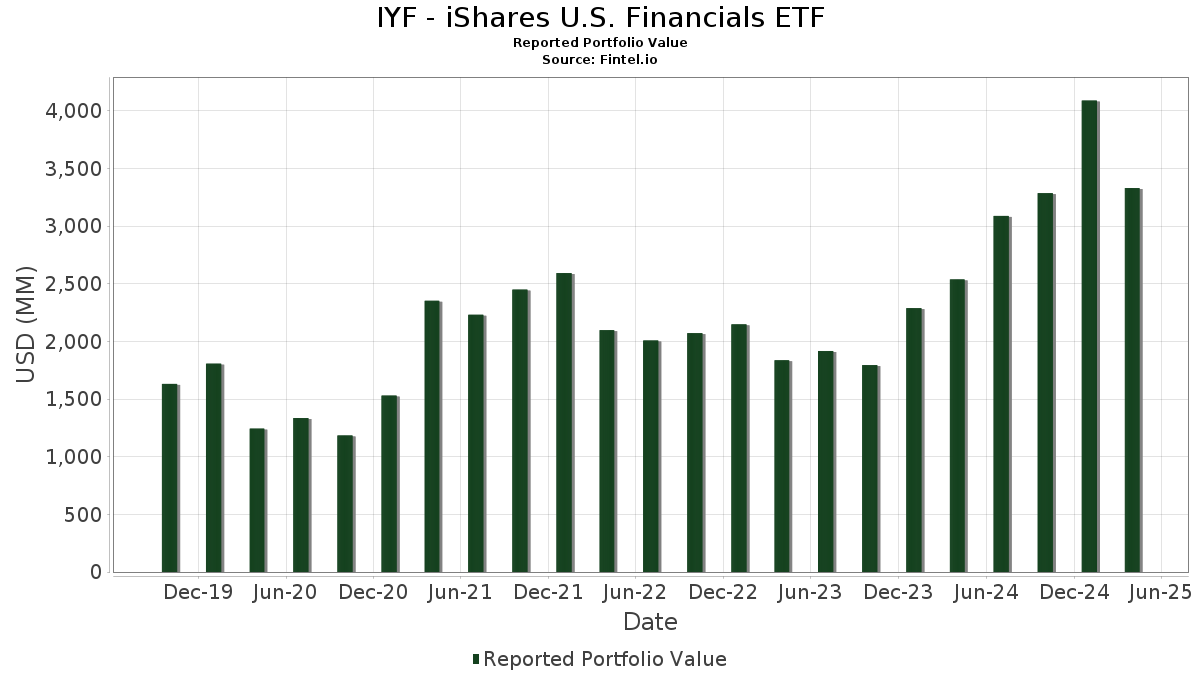
IYF - iShares U.S. Financials ETF har afsløret 147 samlede besiddelser i deres seneste SEC-arkivering. Den seneste porteføljeværdi er beregnet til at være $ 4.192.554.030 USD. Faktiske aktiver under forvaltning (AUM) er denne værdi plus kontanter (som ikke er oplyst). IYF - iShares U.S. Financials ETFs største beholdninger er Berkshire Hathaway Inc. (US:BRK.B) , JPMorgan Chase & Co. (US:JPM) , Bank of America Corporation (US:BAC) , Wells Fargo & Company (US:WFC) , and The Goldman Sachs Group, Inc. (US:GS) . IYF - iShares U.S. Financials ETFs nye stillinger omfatter Brookfield Asset Management Ltd. (US:BAM) , Mr. Cooper Group Inc. (US:COOP) , SouthState Bank Corporation (US:SSB) , Liberty Broadband Corporation (US:LBRD.K) , and Hamilton Lane Incorporated (US:HLNE) .
Top øger dette kvartal
Vi bruger ændringen i porteføljeallokeringen, fordi dette er den mest meningsfulde metrik. Ændringer kan skyldes handler eller ændringer i aktiekurser.
| Sikkerhed | Aktier (MM) |
Værdi (MM$) |
Portefølje % | ΔPortefølje % |
|---|---|---|---|---|
| JPM / JPMorgan Chase & Co. | 1,50 | 445,12 | 10,6275 | 1,3490 |
| HOOD / Robinhood Markets, Inc. | 0,50 | 51,56 | 1,2310 | 0,6403 |
| GS / The Goldman Sachs Group, Inc. | 0,21 | 148,71 | 3,5505 | 0,5925 |
| COIN / Coinbase Global, Inc. | 0,14 | 52,68 | 1,2578 | 0,5220 |
| C / Citigroup Inc. | 1,25 | 117,16 | 2,7972 | 0,4795 |
| BAM / Brookfield Asset Management Ltd. | 0,26 | 15,93 | 0,3804 | 0,3804 |
| BX / Blackstone Inc. | 0,49 | 85,45 | 2,0400 | 0,3378 |
| BLK / BlackRock, Inc. | 0,10 | 113,89 | 2,7191 | 0,3017 |
| MS / Morgan Stanley | 0,78 | 110,74 | 2,6440 | 0,2734 |
| SCHW / The Charles Schwab Corporation | 1,15 | 112,58 | 2,6878 | 0,2725 |
Top falder i dette kvartal
Vi bruger ændringen i porteføljeallokeringen, fordi dette er den mest meningsfulde metrik. Ændringer kan skyldes handler eller ændringer i aktiekurser.
| Sikkerhed | Aktier (MM) |
Værdi (MM$) |
Portefølje % | ΔPortefølje % |
|---|---|---|---|---|
| BRK.B / Berkshire Hathaway Inc. | 0,98 | 463,92 | 11,0763 | -1,5167 |
| PGR / The Progressive Corporation | 0,40 | 95,73 | 2,2857 | -0,6637 |
| CB / Chubb Limited | 0,25 | 66,83 | 1,5955 | -0,4775 |
| MMC / Marsh & McLennan Companies, Inc. | 0,33 | 66,49 | 1,5875 | -0,4034 |
| APO / Apollo Global Management, Inc. | 0,28 | 40,67 | 0,9711 | -0,3040 |
| AFL / Aflac Incorporated | 0,33 | 32,70 | 0,7808 | -0,2935 |
| BAC / Bank of America Corporation | 3,94 | 186,44 | 4,4513 | -0,2828 |
| AJG / Arthur J. Gallagher & Co. | 0,17 | 49,27 | 1,1764 | -0,2352 |
| AIG / American International Group, Inc. | 0,39 | 30,58 | 0,7301 | -0,1801 |
| CME / CME Group Inc. | 0,24 | 67,69 | 1,6161 | -0,1675 |
13F og Fondsarkivering
Denne formular blev indsendt den 2025-09-24 for rapporteringsperioden 2025-07-31. Klik på linkikonet for at se den fulde transaktionshistorik.
Opgrader for at låse op for premium-data og eksportere til Excel ![]() .
.
| Sikkerhed | Type | Gennemsnitlig aktiekurs | Aktier (MM) |
Δ Aktier (%) |
Værdi ($MM) |
Δ Aktier (%) |
Portefølje (%) |
ΔPortefølje (%) |
|
|---|---|---|---|---|---|---|---|---|---|
| BRK.B / Berkshire Hathaway Inc. | 0,98 | 25,29 | 463,92 | 10,87 | 11,0763 | -1,5167 | |||
| JPM / JPMorgan Chase & Co. | 1,50 | 19,22 | 445,12 | 44,38 | 10,6275 | 1,3490 | |||
| BAC / Bank of America Corporation | 3,94 | -0,01 | 186,44 | 18,52 | 4,4513 | -0,2828 | |||
| WFC / Wells Fargo & Company | 2,10 | 7,10 | 169,00 | 21,60 | 4,0350 | -0,1476 | |||
| GS / The Goldman Sachs Group, Inc. | 0,21 | 14,49 | 148,71 | 51,30 | 3,5505 | 0,5925 | |||
| C / Citigroup Inc. | 1,25 | 11,02 | 117,16 | 52,13 | 2,7972 | 0,4795 | |||
| SPGI / S&P Global Inc. | 0,21 | 11,28 | 114,21 | 22,64 | 2,7269 | -0,0759 | |||
| BLK / BlackRock, Inc. | 0,10 | 17,20 | 113,89 | 41,78 | 2,7191 | 0,3017 | |||
| SCHW / The Charles Schwab Corporation | 1,15 | 16,84 | 112,58 | 40,28 | 2,6878 | 0,2725 | |||
| MS / Morgan Stanley | 0,78 | 13,91 | 110,74 | 40,59 | 2,6440 | 0,2734 | |||
| PGR / The Progressive Corporation | 0,40 | 13,71 | 95,73 | -2,31 | 2,2857 | -0,6637 | |||
| BX / Blackstone Inc. | 0,49 | 15,04 | 85,45 | 51,07 | 2,0400 | 0,3378 | |||
| ICE / Intercontinental Exchange, Inc. | 0,39 | 14,15 | 71,32 | 25,61 | 1,7029 | -0,0061 | |||
| CME / CME Group Inc. | 0,24 | 13,72 | 67,69 | 14,22 | 1,6161 | -0,1675 | |||
| KKR / KKR & Co. Inc. | 0,46 | 14,44 | 67,21 | 46,79 | 1,6048 | 0,2267 | |||
| CB / Chubb Limited | 0,25 | 4,33 | 66,83 | -2,98 | 1,5955 | -0,4775 | |||
| MMC / Marsh & McLennan Companies, Inc. | 0,33 | 13,77 | 66,49 | 0,51 | 1,5875 | -0,4034 | |||
| MCO / Moody's Corporation | 0,11 | 11,68 | 54,17 | 27,12 | 1,2933 | 0,0108 | |||
| COIN / Coinbase Global, Inc. | 0,14 | 15,74 | 52,68 | 115,50 | 1,2578 | 0,5220 | |||
| HOOD / Robinhood Markets, Inc. | 0,50 | 25,20 | 51,56 | 162,71 | 1,2310 | 0,6403 | |||
| PNC / The PNC Financial Services Group, Inc. | 0,27 | 13,14 | 50,86 | 33,96 | 1,2143 | 0,0717 | |||
| AON / Aon plc | 0,14 | 21,57 | 50,52 | 21,89 | 1,2062 | -0,0412 | |||
| AJG / Arthur J. Gallagher & Co. | 0,17 | 17,28 | 49,27 | 5,05 | 1,1764 | -0,2352 | |||
| BK / The Bank of New York Mellon Corporation | 0,48 | 13,00 | 49,01 | 42,57 | 1,1703 | 0,1356 | |||
| USB / U.S. Bancorp | 1,05 | 13,64 | 47,40 | 26,65 | 1,1316 | 0,0054 | |||
| APO / Apollo Global Management, Inc. | 0,28 | -9,84 | 40,67 | -4,00 | 0,9711 | -0,3040 | |||
| TRV / The Travelers Companies, Inc. | 0,15 | 13,86 | 39,85 | 12,18 | 0,9515 | -0,1177 | |||
| TFC / Truist Financial Corporation | 0,89 | 11,55 | 38,72 | 27,17 | 0,9244 | 0,0081 | |||
| ALL / The Allstate Corporation | 0,18 | 14,01 | 36,21 | 16,80 | 0,8645 | -0,0685 | |||
| AMP / Ameriprise Financial, Inc. | 0,06 | 11,67 | 33,12 | 22,86 | 0,7908 | -0,0206 | |||
| AFL / Aflac Incorporated | 0,33 | 0,21 | 32,70 | -8,38 | 0,7808 | -0,2935 | |||
| AIG / American International Group, Inc. | 0,39 | 6,18 | 30,58 | 1,11 | 0,7301 | -0,1801 | |||
| MET / MetLife, Inc. | 0,38 | 10,70 | 28,95 | 11,56 | 0,6913 | -0,0898 | |||
| MSCI / MSCI Inc. | 0,05 | 12,17 | 28,49 | 15,52 | 0,6802 | -0,0621 | |||
| NDAQ / Nasdaq, Inc. | 0,28 | 13,70 | 26,80 | 43,56 | 0,6399 | 0,0780 | |||
| NU / Nu Holdings Ltd. | 2,16 | 11,80 | 26,37 | 9,92 | 0,6296 | -0,0924 | |||
| PRU / Prudential Financial, Inc. | 0,24 | 11,95 | 24,79 | 12,90 | 0,5919 | -0,0689 | |||
| HIG / The Hartford Insurance Group, Inc. | 0,19 | 11,26 | 23,83 | 12,83 | 0,5689 | -0,0667 | |||
| ARES / Ares Management Corporation | 0,13 | 15,80 | 23,65 | 40,86 | 0,5645 | 0,0593 | |||
| STT / State Street Corporation | 0,20 | 12,94 | 21,98 | 43,26 | 0,5247 | 0,0630 | |||
| LPLA / LPL Financial Holdings Inc. | 0,05 | 14,76 | 21,38 | 42,01 | 0,5104 | 0,0574 | |||
| ACGL / Arch Capital Group Ltd. | 0,25 | 15,09 | 21,25 | 9,23 | 0,5074 | -0,0782 | |||
| WTY / Willis Towers Watson Public Limited Company | 0,07 | 12,35 | 21,25 | 15,27 | 0,5073 | -0,0474 | |||
| RJF / Raymond James Financial, Inc. | 0,12 | 3,38 | 20,82 | 26,08 | 0,4971 | 0,0001 | |||
| MTB / M&T Bank Corporation | 0,11 | 10,93 | 20,70 | 23,31 | 0,4941 | -0,0110 | |||
| BR / Broadridge Financial Solutions, Inc. | 0,08 | 13,19 | 19,51 | 15,57 | 0,4658 | -0,0422 | |||
| IBKR / Interactive Brokers Group, Inc. | 0,29 | 356,61 | 18,80 | 74,19 | 0,4488 | 0,1240 | |||
| FITB / Fifth Third Bancorp | 0,45 | 12,39 | 18,77 | 30,00 | 0,4482 | 0,0136 | |||
| NTRS / Northern Trust Corporation | 0,13 | 14,81 | 17,20 | 58,82 | 0,4106 | 0,0847 | |||
| CBOE / Cboe Global Markets, Inc. | 0,07 | 12,69 | 17,05 | 22,46 | 0,4070 | -0,0119 | |||
| BRO / Brown & Brown, Inc. | 0,19 | 30,75 | 16,97 | 8,02 | 0,4052 | -0,0677 | |||
| MKL / Markel Group Inc. | 0,01 | 12,44 | 16,97 | 24,18 | 0,4052 | -0,0061 | |||
| SOFI / SoFi Technologies, Inc. | 0,72 | 11,66 | 16,29 | 101,56 | 0,3889 | 0,1457 | |||
| HBAN / Huntington Bancshares Incorporated | 0,99 | 14,90 | 16,21 | 29,93 | 0,3870 | 0,0115 | |||
| BAM / Brookfield Asset Management Ltd. | 0,26 | 15,93 | 0,3804 | 0,3804 | |||||
| CINF / Cincinnati Financial Corporation | 0,10 | 14,96 | 15,44 | 21,81 | 0,3687 | -0,0128 | |||
| RF / Regions Financial Corporation | 0,61 | 12,20 | 15,36 | 39,25 | 0,3667 | 0,0348 | |||
| TROW / T. Rowe Price Group, Inc. | 0,15 | 7,30 | 14,87 | 22,94 | 0,3550 | -0,0090 | |||
| CFG / Citizens Financial Group, Inc. | 0,30 | 12,24 | 14,17 | 45,20 | 0,3383 | 0,0446 | |||
| WRB / W. R. Berkley Corporation | 0,20 | 16,99 | 14,07 | 12,28 | 0,3359 | -0,0412 | |||
| FCNCA / First Citizens BancShares, Inc. | 0,01 | -1,40 | 13,50 | 10,55 | 0,3223 | -0,0452 | |||
| PFG / Principal Financial Group, Inc. | 0,15 | 13,21 | 11,89 | 18,82 | 0,2839 | -0,0173 | |||
| KEY / KeyCorp | 0,64 | 14,48 | 11,46 | 38,24 | 0,2736 | 0,0241 | |||
| TW / Tradeweb Markets Inc. | 0,08 | 12,76 | 10,93 | 12,97 | 0,2608 | -0,0302 | |||
| CG / The Carlyle Group Inc. | 0,18 | 33,15 | 10,77 | 109,04 | 0,2572 | 0,1021 | |||
| L / Loews Corporation | 0,12 | 9,00 | 10,65 | 13,65 | 0,2542 | -0,0277 | |||
| FDS / FactSet Research Systems Inc. | 0,03 | 13,37 | 10,32 | 5,68 | 0,2465 | -0,0475 | |||
| FNF / Fidelity National Financial, Inc. | 0,18 | 14,16 | 9,94 | 0,58 | 0,2373 | -0,0601 | |||
| EG / Everest Group, Ltd. | 0,03 | 12,58 | 9,67 | 5,35 | 0,2308 | -0,0454 | |||
| EWBC / East West Bancorp, Inc. | 0,09 | 12,68 | 9,44 | 32,03 | 0,2255 | 0,0102 | |||
| US0669224778 / BlackRock Cash Funds: Treasury, SL Agency Shares | 9,18 | 45,30 | 9,18 | 45,30 | 0,2192 | 0,0290 | |||
| RGA / Reinsurance Group of America, Incorporated | 0,04 | 12,75 | 8,62 | 15,85 | 0,2057 | -0,0181 | |||
| UNM / Unum Group | 0,12 | 8,18 | 8,39 | 0,04 | 0,2003 | -0,0521 | |||
| NLY / Annaly Capital Management, Inc. | 0,40 | 19,16 | 8,22 | 23,59 | 0,1963 | -0,0039 | |||
| GL / Globe Life Inc. | 0,06 | 14,74 | 8,10 | 30,67 | 0,1935 | 0,0068 | |||
| EQH / Equitable Holdings, Inc. | 0,16 | 0,00 | 8,07 | 3,84 | 0,1926 | -0,0412 | |||
| RNR / RenaissanceRe Holdings Ltd. | 0,03 | 6,35 | 8,03 | 7,14 | 0,1916 | -0,0338 | |||
| OWL / Blue Owl Capital Inc. | 0,41 | 30,19 | 8,02 | 35,97 | 0,1915 | 0,0139 | |||
| SF / Stifel Financial Corp. | 0,07 | 14,09 | 7,85 | 51,95 | 0,1875 | 0,0320 | |||
| EVR / Evercore Inc. | 0,02 | 18,21 | 7,51 | 73,43 | 0,1792 | 0,0489 | |||
| FHN / First Horizon Corporation | 0,34 | 8,65 | 7,50 | 31,07 | 0,1790 | 0,0068 | |||
| ALLY / Ally Financial Inc. | 0,19 | 15,17 | 7,11 | 33,47 | 0,1699 | 0,0094 | |||
| HLI / Houlihan Lokey, Inc. | 0,04 | 13,24 | 6,97 | 33,20 | 0,1665 | 0,0089 | |||
| WBS / Webster Financial Corporation | 0,12 | 12,13 | 6,73 | 36,66 | 0,1607 | 0,0125 | |||
| KNSL / Kinsale Capital Group, Inc. | 0,02 | 12,66 | 6,63 | 14,06 | 0,1582 | -0,0166 | |||
| COOP / Mr. Cooper Group Inc. | 0,04 | 6,61 | 0,1578 | 0,1578 | |||||
| AIZ / Assurant, Inc. | 0,04 | 13,39 | 6,59 | 10,20 | 0,1574 | -0,0227 | |||
| SSB / SouthState Bank Corporation | 0,07 | 6,39 | 0,1525 | 0,1525 | |||||
| SEIC / SEI Investments Company | 0,07 | 18,40 | 6,20 | 33,26 | 0,1480 | 0,0080 | |||
| PRI / Primerica, Inc. | 0,02 | 15,00 | 6,16 | 16,55 | 0,1472 | -0,0120 | |||
| JEF / Jefferies Financial Group Inc. | 0,11 | -0,34 | 6,11 | 22,96 | 0,1458 | -0,0037 | |||
| CMA / Comerica Incorporated | 0,09 | 11,14 | 6,09 | 39,72 | 0,1453 | 0,0142 | |||
| AGNC / AGNC Investment Corp. | 0,64 | 21,40 | 6,05 | 29,65 | 0,1444 | 0,0040 | |||
| WAL / Western Alliance Bancorporation | 0,07 | 14,13 | 5,80 | 26,98 | 0,1386 | 0,0010 | |||
| ORI / Old Republic International Corporation | 0,16 | 13,39 | 5,77 | 9,07 | 0,1378 | -0,0215 | |||
| AFG / American Financial Group, Inc. | 0,05 | 5,40 | 5,74 | 3,95 | 0,1370 | -0,0291 | |||
| WTFC / Wintrust Financial Corporation | 0,04 | 12,42 | 5,71 | 29,44 | 0,1364 | 0,0035 | |||
| US0669225197 / BlackRock Cash Funds: Institutional, SL Agency Shares | 5,41 | -36,50 | 5,41 | -36,49 | 0,1292 | -0,1273 | |||
| ZION / Zions Bancorporation, National Association | 0,10 | 14,13 | 5,26 | 36,10 | 0,1257 | 0,0093 | |||
| BPOP / Popular, Inc. | 0,05 | 7,60 | 5,24 | 29,20 | 0,1252 | 0,0031 | |||
| IVZ / Invesco Ltd. | 0,25 | 14,15 | 5,22 | 72,20 | 0,1245 | 0,0334 | |||
| CFR / Cullen/Frost Bankers, Inc. | 0,04 | 11,64 | 5,12 | 22,12 | 0,1223 | -0,0039 | |||
| CBSH / Commerce Bancshares, Inc. | 0,08 | 10,61 | 5,10 | 11,45 | 0,1218 | -0,0160 | |||
| MKTX / MarketAxess Holdings Inc. | 0,02 | 10,09 | 5,09 | 2,08 | 0,1216 | -0,0285 | |||
| BEN / Franklin Resources, Inc. | 0,21 | 10,06 | 5,04 | 40,80 | 0,1202 | 0,0126 | |||
| TPG / TPG Inc. | 0,09 | 65,40 | 5,02 | 103,20 | 0,1198 | 0,0455 | |||
| OMF / OneMain Holdings, Inc. | 0,08 | 18,64 | 4,77 | 45,65 | 0,1139 | 0,0153 | |||
| VOYA / Voya Financial, Inc. | 0,07 | 11,94 | 4,64 | 32,39 | 0,1108 | 0,0053 | |||
| SNV / Synovus Financial Corp. | 0,10 | 10,75 | 4,56 | 20,77 | 0,1089 | -0,0048 | |||
| PNFP / Pinnacle Financial Partners, Inc. | 0,05 | 12,09 | 4,56 | -1,73 | 0,1088 | -0,0307 | |||
| SLM / SLM Corporation | 0,14 | 14,17 | 4,55 | 25,58 | 0,1087 | -0,0004 | |||
| AXS / AXIS Capital Holdings Limited | 0,05 | 3,20 | 4,53 | 0,53 | 0,1082 | -0,0275 | |||
| XP / XP Inc. | 0,28 | 11,29 | 4,51 | 11,58 | 0,1077 | -0,0140 | |||
| STWD / Starwood Property Trust, Inc. | 0,23 | 18,12 | 4,49 | 19,76 | 0,1072 | -0,0056 | |||
| MORN / Morningstar, Inc. | 0,02 | -1,84 | 4,42 | -4,68 | 0,1056 | -0,0340 | |||
| RITM / Rithm Capital Corp. | 0,36 | 14,14 | 4,38 | 22,82 | 0,1046 | -0,0028 | |||
| RYAN / Ryan Specialty Holdings, Inc. | 0,07 | 14,16 | 4,36 | 6,63 | 0,1041 | -0,0190 | |||
| LBRD.K / Liberty Broadband Corporation | 0,07 | 4,34 | 0,1036 | 0,1036 | |||||
| THG / The Hanover Insurance Group, Inc. | 0,03 | 14,33 | 4,31 | 18,13 | 0,1028 | -0,0069 | |||
| PB / Prosperity Bancshares, Inc. | 0,06 | 12,48 | 4,12 | 10,34 | 0,0984 | -0,0140 | |||
| MTG / MGIC Investment Corporation | 0,16 | 2,82 | 4,11 | 6,90 | 0,0980 | -0,0176 | |||
| HLNE / Hamilton Lane Incorporated | 0,03 | 4,07 | 0,0971 | 0,0971 | |||||
| AMG / Affiliated Managers Group, Inc. | 0,02 | 5,40 | 4,06 | 33,55 | 0,0970 | 0,0054 | |||
| FAF / First American Financial Corporation | 0,07 | 13,37 | 4,01 | 11,95 | 0,0957 | -0,0121 | |||
| LAZ / Lazard, Inc. | 0,08 | 9,95 | 3,90 | 46,93 | 0,0931 | 0,0132 | |||
| JHG / Janus Henderson Group plc | 0,09 | 8,72 | 3,74 | 41,74 | 0,0893 | 0,0099 | |||
| FNB / F.N.B. Corporation | 0,24 | 9,04 | 3,69 | 27,62 | 0,0882 | 0,0011 | |||
| RLI / RLI Corp. | 0,06 | 9,13 | 3,66 | -2,69 | 0,0873 | -0,0258 | |||
| OZK / Bank OZK | 0,07 | 15,46 | 3,60 | 33,62 | 0,0859 | 0,0049 | |||
| COLB / Columbia Banking System, Inc. | 0,15 | 14,13 | 3,51 | 21,15 | 0,0839 | -0,0034 | |||
| WTM / White Mountains Insurance Group, Ltd. | 0,00 | 11,77 | 3,01 | 13,05 | 0,0718 | -0,0082 | |||
| LNC / Lincoln National Corporation | 0,08 | 0,00 | 2,96 | 19,60 | 0,0707 | -0,0038 | |||
| AGO / Assured Guaranty Ltd. | 0,03 | 3,95 | 2,74 | 0,22 | 0,0654 | -0,0169 | |||
| KMPR / Kemper Corporation | 0,04 | 9,07 | 2,57 | 13,62 | 0,0614 | -0,0067 | |||
| VIRT / Virtu Financial, Inc. | 0,06 | 8,08 | 2,43 | 21,83 | 0,0581 | -0,0020 | |||
| RKT / Rocket Companies, Inc. | 0,16 | 72,65 | 2,33 | 97,63 | 0,0556 | 0,0201 | |||
| CACC / Credit Acceptance Corporation | 0,00 | 19,78 | 2,29 | 20,54 | 0,0547 | -0,0025 | |||
| FRHC / Freedom Holding Corp. | 0,01 | 2,22 | 0,0529 | 0,0529 | |||||
| FHB / First Hawaiian, Inc. | 0,08 | 4,47 | 2,05 | 10,80 | 0,0490 | -0,0067 | |||
| BHF / Brighthouse Financial, Inc. | 0,04 | 12,04 | 2,03 | -7,90 | 0,0485 | -0,0179 | |||
| BOKF / BOK Financial Corporation | 0,02 | 13,86 | 1,70 | 24,07 | 0,0406 | -0,0006 | |||
| CNA / CNA Financial Corporation | 0,02 | 14,30 | 0,78 | 5,11 | 0,0187 | -0,0037 | |||
| LBRDA / Liberty Broadband Corporation | 0,01 | 0,64 | 0,0153 | 0,0153 | |||||
| TFSL / TFS Financial Corporation | 0,04 | -9,56 | 0,47 | -8,54 | 0,0113 | -0,0043 | |||
| UWMC / UWM Holdings Corporation | 0,11 | 39,83 | 0,46 | 19,58 | 0,0109 | -0,0006 | |||
| XAF FINANCIAL SEP25 / DE (N/A) | 0,09 | 0,0022 | 0,0022 | ||||||
| S P MID 400 EMINI SEP25 / DE (N/A) | -0,00 | -0,0000 | -0,0000 |