Grundlæggende statistik
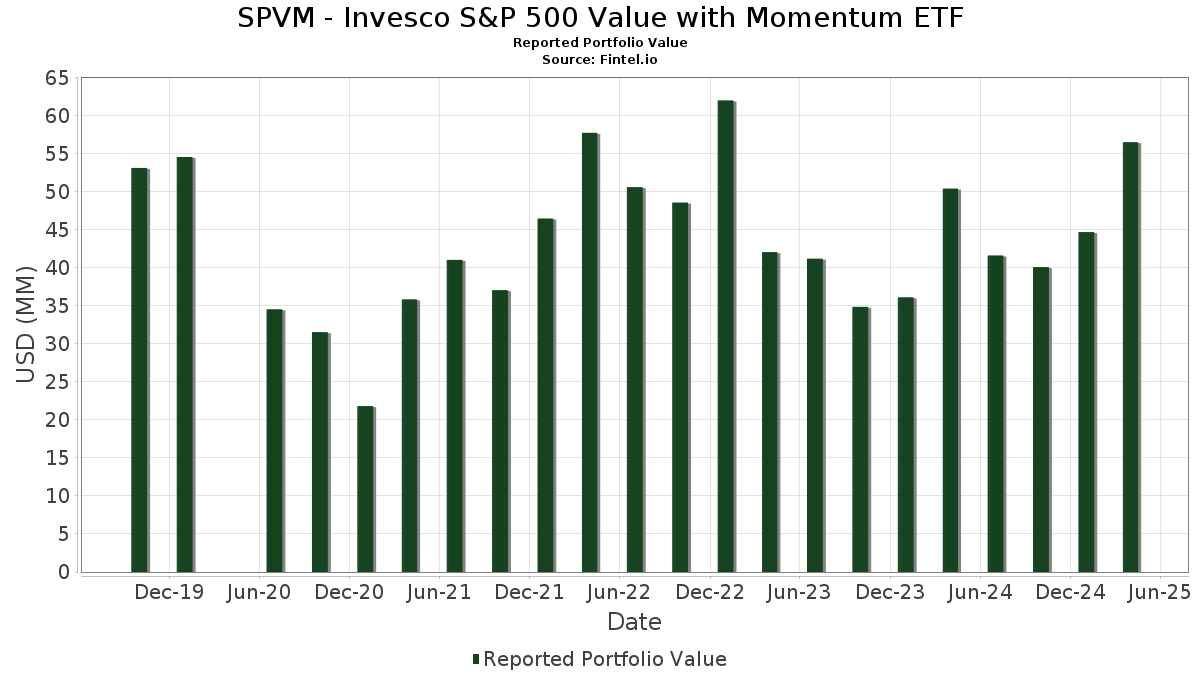
| Porteføljeværdi | $ 73.483.401 |
| Nuværende stillinger | 105 |
Seneste beholdninger, ydeevne, AUM (fra 13F, 13D)
SPVM - Invesco S&P 500 Value with Momentum ETF har afsløret 105 samlede besiddelser i deres seneste SEC-arkivering. Den seneste porteføljeværdi er beregnet til at være $ 73.483.401 USD. Faktiske aktiver under forvaltning (AUM) er denne værdi plus kontanter (som ikke er oplyst). SPVM - Invesco S&P 500 Value with Momentum ETFs største beholdninger er General Motors Company (US:GM) , Invesco Ltd. (US:IVZ) , Hewlett Packard Enterprise Company (US:HPE) , United Airlines Holdings, Inc. (US:UAL) , and Mohawk Industries, Inc. (US:MHK) . SPVM - Invesco S&P 500 Value with Momentum ETFs nye stillinger omfatter Warner Bros. Discovery, Inc. (US:WBD) , Trimble Inc. (DE:TB5) , Keurig Dr Pepper Inc. (US:KDP) , Healthpeak Properties, Inc. (US:PEAK) , and .
Top øger dette kvartal
Vi bruger ændringen i porteføljeallokeringen, fordi dette er den mest meningsfulde metrik. Ændringer kan skyldes handler eller ændringer i aktiekurser.
| Sikkerhed | Aktier (MM) |
Værdi (MM$) |
Portefølje % | ΔPortefølje % |
|---|---|---|---|---|
| 3,80 | 3,80 | 6,0311 | 6,0311 | |
| 3,80 | 3,80 | 6,0311 | 6,0311 | |
| 1,45 | 1,45 | 2,3108 | 2,3108 | |
| 1,45 | 1,45 | 2,3108 | 2,3108 | |
| IVZ / Invesco Ltd. | 0,06 | 1,34 | 2,1288 | 1,5932 |
| PARA / Paramount Global | 0,07 | 0,87 | 1,3882 | 1,3882 |
| WBD / Warner Bros. Discovery, Inc. | 0,06 | 0,74 | 1,1742 | 1,1742 |
| NEM / Newmont Corporation | 0,01 | 0,67 | 1,0601 | 1,0601 |
| HPE / Hewlett Packard Enterprise Company | 0,06 | 1,32 | 2,0896 | 0,9344 |
| GL / Globe Life Inc. | 0,01 | 0,81 | 1,2812 | 0,8875 |
Top falder i dette kvartal
Vi bruger ændringen i porteføljeallokeringen, fordi dette er den mest meningsfulde metrik. Ændringer kan skyldes handler eller ændringer i aktiekurser.
| Sikkerhed | Aktier (MM) |
Værdi (MM$) |
Portefølje % | ΔPortefølje % |
|---|---|---|---|---|
| COF / Capital One Financial Corporation | 0,00 | 0,00 | -1,1505 | |
| XOM / Exxon Mobil Corporation | 0,00 | 0,00 | -1,1122 | |
| ETR / Entergy Corporation | 0,00 | 0,00 | -0,9664 | |
| NRG / NRG Energy, Inc. | 0,00 | 0,00 | -0,9596 | |
| J / Jacobs Solutions Inc. | 0,00 | 0,00 | -0,8306 | |
| AIG / American International Group, Inc. | 0,00 | 0,00 | -0,8268 | |
| HCA / HCA Healthcare, Inc. | 0,00 | 0,00 | -0,8132 | |
| TPR / Tapestry, Inc. | 0,00 | 0,00 | -0,8039 | |
| SO / The Southern Company | 0,00 | 0,00 | -0,7662 | |
| OMC / Omnicom Group Inc. | 0,00 | 0,00 | -0,7652 |
13F og Fondsarkivering
Denne formular blev indsendt den 2025-09-26 for rapporteringsperioden 2025-07-31. Klik på linkikonet for at se den fulde transaktionshistorik.
Opgrader for at låse op for premium-data og eksportere til Excel ![]() .
.
| Sikkerhed | Type | Gennemsnitlig aktiekurs | Aktier (MM) |
Δ Aktier (%) |
Værdi ($MM) |
Δ Aktier (%) |
Portefølje (%) |
ΔPortefølje (%) |
|
|---|---|---|---|---|---|---|---|---|---|
| Invesco Private Prime Fund / STIV (N/A) | 3,80 | 3,80 | 6,0311 | 6,0311 | |||||
| Invesco Private Prime Fund / STIV (N/A) | 3,80 | 3,80 | 6,0311 | 6,0311 | |||||
| GM / General Motors Company | 0,03 | 16,66 | 1,58 | 37,53 | 2,5158 | 0,1952 | |||
| Invesco Private Government Fund / STIV (N/A) | 1,45 | 1,45 | 2,3108 | 2,3108 | |||||
| Invesco Private Government Fund / STIV (N/A) | 1,45 | 1,45 | 2,3108 | 2,3108 | |||||
| IVZ / Invesco Ltd. | 0,06 | 234,34 | 1,34 | 405,28 | 2,1288 | 1,5932 | |||
| HPE / Hewlett Packard Enterprise Company | 0,06 | 79,92 | 1,32 | 129,90 | 2,0896 | 0,9344 | |||
| UAL / United Airlines Holdings, Inc. | 0,01 | 67,11 | 1,19 | 114,26 | 1,8876 | 0,7708 | |||
| MHK / Mohawk Industries, Inc. | 0,01 | 58,79 | 1,17 | 71,11 | 1,8548 | 0,4784 | |||
| C / Citigroup Inc. | 0,01 | 19,47 | 1,04 | 63,84 | 1,6565 | 0,3727 | |||
| TSN / Tyson Foods, Inc. | 0,02 | 26,88 | 0,98 | 8,44 | 1,5512 | -0,2651 | |||
| CFG / Citizens Financial Group, Inc. | 0,02 | 43,21 | 0,95 | 85,24 | 1,5160 | 0,4777 | |||
| TAP / Molson Coors Beverage Company | 0,02 | 202,40 | 0,95 | 157,45 | 1,5102 | 0,6452 | |||
| PHM / PulteGroup, Inc. | 0,01 | 56,91 | 0,94 | 72,79 | 1,4950 | 0,3969 | |||
| SYF / Synchrony Financial | 0,01 | 27,08 | 0,90 | 70,53 | 1,4262 | 0,3644 | |||
| TFC / Truist Financial Corporation | 0,02 | 129,72 | 0,88 | 107,76 | 1,4031 | 0,6660 | |||
| PARA / Paramount Global | 0,07 | 0,87 | 1,3882 | 1,3882 | |||||
| KR / The Kroger Co. | 0,01 | -9,01 | 0,87 | -11,64 | 1,3881 | -0,6057 | |||
| RF / Regions Financial Corporation | 0,03 | 56,49 | 0,87 | 94,21 | 1,3867 | 0,4808 | |||
| STT / State Street Corporation | 0,01 | 21,47 | 0,87 | 54,08 | 1,3822 | 0,2441 | |||
| PRU / Prudential Financial, Inc. | 0,01 | 8,19 | 0,84 | 9,11 | 1,3323 | -0,2169 | |||
| HPQ / HP Inc. | 0,03 | 105,55 | 0,81 | 99,51 | 1,2950 | 0,4709 | |||
| NTRS / Northern Trust Corporation | 0,01 | 21,31 | 0,81 | 67,63 | 1,2853 | 0,3135 | |||
| GL / Globe Life Inc. | 0,01 | 160,08 | 0,81 | 379,76 | 1,2812 | 0,8875 | |||
| L / Loews Corporation | 0,01 | -14,51 | 0,80 | -10,84 | 1,2682 | -0,5367 | |||
| UHS / Universal Health Services, Inc. | 0,00 | 31,27 | 0,78 | 23,37 | 1,2336 | -0,0348 | |||
| BBY / Best Buy Co., Inc. | 0,01 | 43,84 | 0,76 | 40,44 | 1,2146 | 0,1164 | |||
| WBD / Warner Bros. Discovery, Inc. | 0,06 | 0,74 | 1,1742 | 1,1742 | |||||
| USB / U.S. Bancorp | 0,02 | 59,27 | 0,73 | 77,48 | 1,1662 | 0,3327 | |||
| MTB / M&T Bank Corporation | 0,00 | 39,09 | 0,72 | 54,70 | 1,1511 | 0,2065 | |||
| MET / MetLife, Inc. | 0,01 | 21,91 | 0,71 | 22,80 | 1,1313 | -0,0370 | |||
| BKR / Baker Hughes Company | 0,02 | 71,83 | 0,70 | 103,19 | 1,1150 | 0,2131 | |||
| HBAN / Huntington Bancshares Incorporated | 0,04 | 38,30 | 0,70 | 56,40 | 1,1073 | 0,2090 | |||
| BAC / Bank of America Corporation | 0,01 | 21,06 | 0,69 | 43,45 | 1,0974 | 0,1271 | |||
| PNC / The PNC Financial Services Group, Inc. | 0,00 | 56,44 | 0,69 | 85,44 | 1,0935 | 0,3446 | |||
| VZ / Verizon Communications Inc. | 0,02 | 27,93 | 0,69 | 24,28 | 1,0904 | -0,0239 | |||
| FITB / Fifth Third Bancorp | 0,02 | 50,53 | 0,68 | 74,10 | 1,0798 | 0,2930 | |||
| CAH / Cardinal Health, Inc. | 0,00 | -18,12 | 0,67 | -10,11 | 1,0610 | -0,4355 | |||
| NEM / Newmont Corporation | 0,01 | 0,67 | 1,0601 | 1,0601 | |||||
| SW / Smurfit Westrock Plc | 0,01 | 68,82 | 0,65 | 78,36 | 1,0356 | 0,2987 | |||
| PCG / PG&E Corporation | 0,05 | 67,93 | 0,65 | 42,64 | 1,0315 | 0,1132 | |||
| COR / Cencora, Inc. | 0,00 | -16,57 | 0,64 | -18,49 | 1,0160 | -0,5647 | |||
| GSCE / GS Connect S&P GSCI Enhanced Commodity Total Return ETN | 0,00 | 13,32 | 0,63 | 49,65 | 1,0072 | 0,1539 | |||
| WFC / Wells Fargo & Company | 0,01 | 3,71 | 0,63 | 17,94 | 1,0027 | -0,0776 | |||
| ALL / The Allstate Corporation | 0,00 | -4,06 | 0,63 | -1,72 | 0,9996 | -0,2907 | |||
| CCL / Carnival Corporation & plc | 0,02 | 38,17 | 0,63 | 124,73 | 0,9974 | 0,4332 | |||
| VICI / VICI Properties Inc. | 0,02 | 146,56 | 0,62 | 187,96 | 0,9897 | 0,3684 | |||
| MCK / McKesson Corporation | 0,00 | 41,42 | 0,62 | 96,21 | 0,9896 | 0,1591 | |||
| AIZ / Assurant, Inc. | 0,00 | 19,06 | 0,61 | 15,87 | 0,9631 | -0,0930 | |||
| BK / The Bank of New York Mellon Corporation | 0,01 | -5,44 | 0,60 | 19,25 | 0,9556 | -0,0606 | |||
| EXC / Exelon Corporation | 0,01 | 51,97 | 0,59 | 81,68 | 0,9302 | 0,1759 | |||
| HIG / The Hartford Insurance Group, Inc. | 0,00 | -13,57 | 0,58 | -12,44 | 0,9290 | -0,4159 | |||
| CHRW / C.H. Robinson Worldwide, Inc. | 0,01 | 46,92 | 0,58 | 107,14 | 0,9226 | 0,1167 | |||
| FOXA / Fox Corporation | 0,01 | -27,12 | 0,57 | -18,40 | 0,9100 | -0,5046 | |||
| STLD / Steel Dynamics, Inc. | 0,00 | 0,07 | 0,56 | -1,58 | 0,8910 | -0,2577 | |||
| RJF / Raymond James Financial, Inc. | 0,00 | 45,36 | 0,55 | 77,49 | 0,8782 | 0,2497 | |||
| TRV / The Travelers Companies, Inc. | 0,00 | -12,25 | 0,55 | -13,68 | 0,8738 | -0,4085 | |||
| EVRG / Evergy, Inc. | 0,01 | -12,39 | 0,55 | -10,16 | 0,8711 | -0,3601 | |||
| IP / International Paper Company | 0,01 | 59,63 | 0,55 | 63,58 | 0,8708 | 0,1944 | |||
| BRK.B / Berkshire Hathaway Inc. | 0,00 | -22,36 | 0,55 | -31,28 | 0,8698 | -0,7363 | |||
| JPM / JPMorgan Chase & Co. | 0,00 | -7,02 | 0,55 | 12,60 | 0,8661 | -0,1098 | |||
| TB5 / Trimble Inc. | 0,01 | 0,54 | 0,8603 | 0,8603 | |||||
| PNW / Pinnacle West Capital Corporation | 0,01 | 0,53 | 0,8408 | 0,8408 | |||||
| CINF / Cincinnati Financial Corporation | 0,00 | -24,83 | 0,53 | -20,36 | 0,8403 | -0,4981 | |||
| AMCR / Amcor plc | 0,06 | 28,68 | 0,52 | 31,00 | 0,8332 | 0,0249 | |||
| LDOS / Leidos Holdings, Inc. | 0,00 | 26,44 | 0,52 | 36,94 | 0,8262 | 0,0619 | |||
| SRE / Sempra | 0,01 | 39,11 | 0,52 | 53,25 | 0,8240 | 0,1407 | |||
| CB / Chubb Limited | 0,00 | -14,94 | 0,51 | -20,87 | 0,8138 | -0,4914 | |||
| CMI / Cummins Inc. | 0,00 | 63,76 | 0,51 | 83,15 | 0,8131 | 0,0826 | |||
| MS / Morgan Stanley | 0,00 | 15,32 | 0,51 | 42,34 | 0,8129 | 0,0883 | |||
| ED / Consolidated Edison, Inc. | 0,00 | -12,91 | 0,51 | -20,00 | 0,8075 | -0,4740 | |||
| T / AT&T Inc. | 0,02 | -25,75 | 0,50 | -26,54 | 0,7966 | -0,5789 | |||
| LUV / Southwest Airlines Co. | 0,02 | 0,49 | 0,7720 | 0,7720 | |||||
| FE / FirstEnergy Corp. | 0,01 | 6,20 | 0,48 | 5,93 | 0,7661 | -0,1528 | |||
| OKE / ONEOK, Inc. | 0,01 | 109,80 | 0,47 | 78,20 | 0,7541 | 0,0568 | |||
| AEP / American Electric Power Company, Inc. | 0,00 | -11,39 | 0,47 | -7,45 | 0,7509 | -0,2787 | |||
| ES / Eversource Energy | 0,01 | 0,47 | 0,7436 | 0,7436 | |||||
| DVA / DaVita Inc. | 0,00 | 44,50 | 0,46 | 43,21 | 0,7387 | 0,0847 | |||
| DUK / Duke Energy Corporation | 0,00 | -3,66 | 0,46 | -3,93 | 0,7381 | -0,2370 | |||
| GD / General Dynamics Corporation | 0,00 | 2,37 | 0,46 | 17,18 | 0,7269 | -0,0598 | |||
| D / Dominion Energy, Inc. | 0,01 | -4,31 | 0,45 | 2,76 | 0,7110 | -0,1661 | |||
| XEL / Xcel Energy Inc. | 0,01 | 35,58 | 0,44 | 85,77 | 0,7066 | 0,1447 | |||
| DTE / DTE Energy Company | 0,00 | -17,75 | 0,44 | -16,85 | 0,7064 | -0,3721 | |||
| AFL / Aflac Incorporated | 0,00 | 14,27 | 0,44 | 4,50 | 0,7016 | -0,1504 | |||
| NI / NiSource Inc. | 0,01 | -4,36 | 0,43 | 3,86 | 0,6844 | -0,1521 | |||
| KIM / Kimco Realty Corporation | 0,02 | 8,64 | 0,43 | 7,81 | 0,6816 | -0,1382 | |||
| NWSA / News Corporation | 0,01 | 12,93 | 0,43 | 22,06 | 0,6777 | -0,0266 | |||
| PPL / PPL Corporation | 0,01 | 1,38 | 0,42 | -0,71 | 0,6708 | -0,1877 | |||
| CHTR / Charter Communications, Inc. | 0,00 | 96,22 | 0,42 | 106,40 | 0,6668 | 0,1910 | |||
| 1AEE / Ameren Corporation | 0,00 | 11,59 | 0,41 | 52,63 | 0,6466 | 0,0229 | |||
| ATO / Atmos Energy Corporation | 0,00 | -7,60 | 0,40 | -10,44 | 0,6414 | -0,2659 | |||
| CNP / CenterPoint Energy, Inc. | 0,01 | 5,53 | 0,40 | 40,57 | 0,6283 | -0,0303 | |||
| CMS / CMS Energy Corporation | 0,01 | -7,82 | 0,39 | -7,51 | 0,6264 | -0,2340 | |||
| LNT / Alliant Energy Corporation | 0,01 | 4,41 | 0,39 | 11,05 | 0,6240 | -0,0880 | |||
| CTSH / Cognizant Technology Solutions Corporation | 0,01 | 2,74 | 0,39 | 0,00 | 0,6163 | -0,1640 | |||
| SNA / Snap-on Incorporated | 0,00 | 27,84 | 0,38 | 24,35 | 0,6094 | -0,1962 | |||
| MO / Altria Group, Inc. | 0,01 | -9,79 | 0,38 | -5,43 | 0,6087 | -0,2088 | |||
| WRB / W. R. Berkley Corporation | 0,01 | -23,24 | 0,38 | -26,25 | 0,6071 | -0,4384 | |||
| LH / Labcorp Holdings Inc. | 0,00 | -2,23 | 0,38 | 5,62 | 0,5980 | -0,1211 | |||
| KMI / Kinder Morgan, Inc. | 0,01 | -3,20 | 0,37 | 3,32 | 0,5932 | -0,1355 | |||
| KDP / Keurig Dr Pepper Inc. | 0,01 | 0,36 | 0,5790 | 0,5790 | |||||
| DGX / Quest Diagnostics Incorporated | 0,00 | -15,69 | 0,36 | -20,74 | 0,5775 | -0,3477 | |||
| O / Realty Income Corporation | 0,01 | -7,99 | 0,35 | -10,86 | 0,5621 | -0,2368 | |||
| PEAK / Healthpeak Properties, Inc. | 0,02 | 0,35 | 0,5587 | 0,5587 | |||||
| US8252528851 / Invesco Government & Agency Portfolio, Institutional Class | 0,07 | -32,36 | 0,07 | -32,73 | 0,1182 | -0,1036 | |||
| NRG / NRG Energy, Inc. | 0,00 | -100,00 | 0,00 | -100,00 | -0,9596 | ||||
| ETR / Entergy Corporation | 0,00 | -100,00 | 0,00 | -100,00 | -0,9664 | ||||
| VTRS / Viatris Inc. | 0,00 | -100,00 | 0,00 | -100,00 | -0,5336 | ||||
| BLDR / Builders FirstSource, Inc. | 0,00 | -100,00 | 0,00 | -100,00 | -0,5699 | ||||
| OMC / Omnicom Group Inc. | 0,00 | -100,00 | 0,00 | -100,00 | -0,7652 | ||||
| XOM / Exxon Mobil Corporation | 0,00 | -100,00 | 0,00 | -100,00 | -1,1122 | ||||
| AIG / American International Group, Inc. | 0,00 | -100,00 | 0,00 | -100,00 | -0,8268 | ||||
| J / Jacobs Solutions Inc. | 0,00 | -100,00 | 0,00 | -100,00 | -0,8306 | ||||
| COF / Capital One Financial Corporation | 0,00 | -100,00 | 0,00 | -100,00 | -1,1505 | ||||
| TPR / Tapestry, Inc. | 0,00 | -100,00 | 0,00 | -100,00 | -0,8039 | ||||
| HCA / HCA Healthcare, Inc. | 0,00 | -100,00 | 0,00 | -100,00 | -0,8132 | ||||
| SO / The Southern Company | 0,00 | -100,00 | 0,00 | -100,00 | -0,7662 |