Grundlæggende statistik
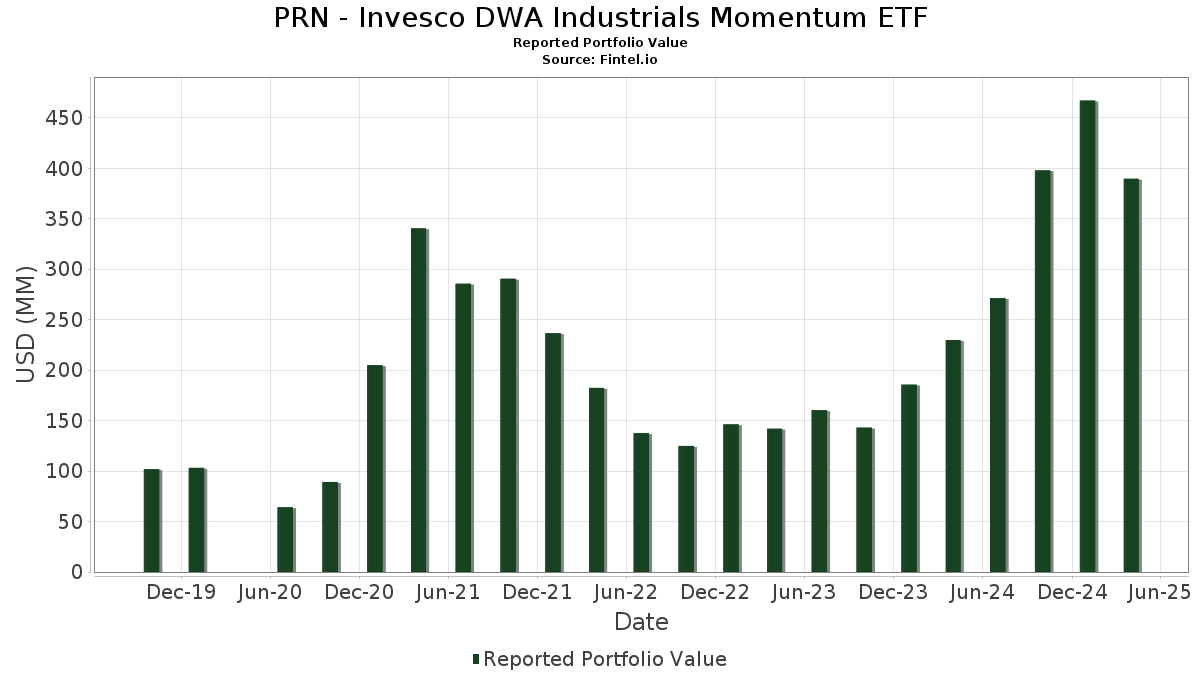
| Porteføljeværdi | $ 425.294.746 |
| Nuværende stillinger | 44 |
Seneste beholdninger, ydeevne, AUM (fra 13F, 13D)
PRN - Invesco DWA Industrials Momentum ETF har afsløret 44 samlede besiddelser i deres seneste SEC-arkivering. Den seneste porteføljeværdi er beregnet til at være $ 425.294.746 USD. Faktiske aktiver under forvaltning (AUM) er denne værdi plus kontanter (som ikke er oplyst). PRN - Invesco DWA Industrials Momentum ETFs største beholdninger er Rocket Lab Corporation (US:RKLB) , Comfort Systems USA, Inc. (US:FIX) , HEICO Corporation (US:HEI) , Rollins, Inc. (US:ROL) , and Cintas Corporation (US:CTAS) . PRN - Invesco DWA Industrials Momentum ETFs nye stillinger omfatter BWX Technologies, Inc. (US:BWXT) , Adaptive Biotechnologies Corporation (US:ADPT) , .
Top øger dette kvartal
Vi bruger ændringen i porteføljeallokeringen, fordi dette er den mest meningsfulde metrik. Ændringer kan skyldes handler eller ændringer i aktiekurser.
| Sikkerhed | Aktier (MM) |
Værdi (MM$) |
Portefølje % | ΔPortefølje % |
|---|---|---|---|---|
| 45,81 | 45,81 | 12,6725 | 12,6725 | |
| RKLB / Rocket Lab Corporation | 0,46 | 21,29 | 5,8906 | 5,8906 |
| 17,61 | 17,61 | 4,8725 | 4,8725 | |
| ROL / Rollins, Inc. | 0,28 | 15,79 | 4,3675 | 4,3675 |
| TGLS / Tecnoglass Inc. | 0,11 | 8,31 | 2,2998 | 2,2998 |
| AGX / Argan, Inc. | 0,03 | 7,04 | 1,9473 | 1,9473 |
| ADP / Automatic Data Processing, Inc. | 0,02 | 6,86 | 1,8979 | 1,8979 |
| BWXT / BWX Technologies, Inc. | 0,04 | 6,70 | 1,8541 | 1,8541 |
| PRIM / Primoris Services Corporation | 0,07 | 6,16 | 1,7041 | 1,7041 |
| WM / Waste Management, Inc. | 0,03 | 6,10 | 1,6877 | 1,6877 |
Top falder i dette kvartal
Vi bruger ændringen i porteføljeallokeringen, fordi dette er den mest meningsfulde metrik. Ændringer kan skyldes handler eller ændringer i aktiekurser.
| Sikkerhed | Aktier (MM) |
Værdi (MM$) |
Portefølje % | ΔPortefølje % |
|---|---|---|---|---|
| LII / Lennox International Inc. | 0,00 | 0,00 | -2,1144 | |
| ARIS / Aris Water Solutions, Inc. | 0,00 | 0,00 | -1,6934 | |
| PBI / Pitney Bowes Inc. | 0,00 | 0,00 | -1,6240 | |
| ESAB / ESAB Corporation | 0,00 | 0,00 | -1,6069 | |
| SMR / NuScale Power Corporation | 0,17 | 8,49 | 2,3488 | -1,5970 |
| CNM / Core & Main, Inc. | 0,00 | 0,00 | -1,5769 | |
| ALSN / Allison Transmission Holdings, Inc. | 0,00 | 0,00 | -1,5562 | |
| OSIS / OSI Systems, Inc. | 0,00 | 0,00 | -1,5520 | |
| CR / Crane Company | 0,00 | 0,00 | -1,4523 | |
| SANM / Sanmina Corporation | 0,00 | 0,00 | -1,4167 |
13F og Fondsarkivering
Denne formular blev indsendt den 2025-09-26 for rapporteringsperioden 2025-07-31. Klik på linkikonet for at se den fulde transaktionshistorik.
Opgrader for at låse op for premium-data og eksportere til Excel ![]() .
.
| Sikkerhed | Type | Gennemsnitlig aktiekurs | Aktier (MM) |
Δ Aktier (%) |
Værdi ($MM) |
Δ Aktier (%) |
Portefølje (%) |
ΔPortefølje (%) |
|
|---|---|---|---|---|---|---|---|---|---|
| Invesco Private Prime Fund / STIV (N/A) | 45,81 | 45,81 | 12,6725 | 12,6725 | |||||
| RKLB / Rocket Lab Corporation | 0,46 | 21,29 | 5,8906 | 5,8906 | |||||
| FIX / Comfort Systems USA, Inc. | 0,03 | -21,92 | 21,14 | 25,73 | 5,8472 | 1,6068 | |||
| Invesco Private Government Fund / STIV (N/A) | 17,61 | 17,61 | 4,8725 | 4,8725 | |||||
| HEI / HEICO Corporation | 0,05 | 2,34 | 17,29 | 33,38 | 4,7830 | 0,7242 | |||
| ROL / Rollins, Inc. | 0,28 | 15,79 | 4,3675 | 4,3675 | |||||
| CTAS / Cintas Corporation | 0,07 | 0,60 | 14,92 | 11,63 | 4,1275 | 0,7561 | |||
| PWR / Quanta Services, Inc. | 0,03 | -20,94 | 14,16 | 4,39 | 3,9185 | 0,4959 | |||
| PH / Parker-Hannifin Corporation | 0,02 | -2,14 | 13,69 | 18,38 | 3,7868 | 0,1664 | |||
| TT / Trane Technologies plc | 0,03 | -15,03 | 13,35 | -2,89 | 3,6929 | -0,6108 | |||
| HWM / Howmet Aerospace Inc. | 0,07 | -11,99 | 13,29 | 14,17 | 3,6771 | 0,0321 | |||
| GWW / W.W. Grainger, Inc. | 0,01 | -5,73 | 13,06 | -4,32 | 3,6121 | -0,6609 | |||
| AXON / Axon Enterprise, Inc. | 0,01 | -23,44 | 11,16 | -11,31 | 3,0887 | -0,0866 | |||
| KTOS / Kratos Defense & Security Solutions, Inc. | 0,18 | 3,20 | 10,40 | 79,33 | 2,8761 | 1,0607 | |||
| JBL / Jabil Inc. | 0,05 | -35,20 | 10,37 | -1,34 | 2,8699 | -0,4222 | |||
| TDG / TransDigm Group Incorporated | 0,01 | -29,98 | 9,63 | -20,30 | 2,6637 | -1,1188 | |||
| GE / General Electric Company | 0,03 | -30,80 | 8,78 | -6,91 | 2,4290 | -0,5244 | |||
| SMR / NuScale Power Corporation | 0,17 | -76,24 | 8,49 | -37,67 | 2,3488 | -1,5970 | |||
| TGLS / Tecnoglass Inc. | 0,11 | 8,31 | 2,2998 | 2,2998 | |||||
| LMB / Limbach Holdings, Inc. | 0,06 | -14,69 | 8,22 | 26,39 | 2,2739 | 0,6334 | |||
| TPC / Tutor Perini Corporation | 0,16 | -7,76 | 7,94 | 106,98 | 2,1972 | 0,9956 | |||
| CW / Curtiss-Wright Corporation | 0,01 | -34,68 | 7,31 | -7,16 | 2,0234 | -0,4433 | |||
| AGX / Argan, Inc. | 0,03 | 7,04 | 1,9473 | 1,9473 | |||||
| ADP / Automatic Data Processing, Inc. | 0,02 | 6,86 | 1,8979 | 1,8979 | |||||
| BWXT / BWX Technologies, Inc. | 0,04 | 6,70 | 1,8541 | 1,8541 | |||||
| RSG / Republic Services, Inc. | 0,03 | -28,58 | 6,48 | -34,31 | 1,7927 | -1,2958 | |||
| VSEC / VSE Corporation | 0,04 | -26,73 | 6,34 | 0,16 | 1,7543 | -0,2281 | |||
| PRIM / Primoris Services Corporation | 0,07 | 6,16 | 1,7041 | 1,7041 | |||||
| WM / Waste Management, Inc. | 0,03 | 6,10 | 1,6877 | 1,6877 | |||||
| REVG / REV Group, Inc. | 0,12 | -5,93 | 6,01 | 42,55 | 1,6639 | 0,3427 | |||
| APG / APi Group Corporation | 0,17 | 6,01 | 1,6639 | 1,6639 | |||||
| AIT / Applied Industrial Technologies, Inc. | 0,02 | -20,31 | 5,65 | -11,06 | 1,5634 | -0,4262 | |||
| R / Ryder System, Inc. | 0,03 | -23,85 | 5,63 | -1,69 | 1,5574 | -0,2357 | |||
| DY / Dycom Industries, Inc. | 0,02 | -56,73 | 5,21 | -38,51 | 1,4403 | -0,6955 | |||
| DRS / Leonardo DRS, Inc. | 0,12 | -31,17 | 5,13 | -22,54 | 1,4180 | -0,6536 | |||
| ITT / ITT Inc. | 0,03 | -22,94 | 4,97 | -4,41 | 1,3742 | -0,2529 | |||
| ROAD / Construction Partners, Inc. | 0,05 | -25,93 | 4,93 | -7,08 | 1,3642 | 0,0254 | |||
| EXLS / ExlService Holdings, Inc. | 0,11 | -22,82 | 4,56 | -30,87 | 1,2623 | -0,8040 | |||
| BMI / Badger Meter, Inc. | 0,02 | -3,42 | 4,29 | -17,45 | 1,1873 | -0,4404 | |||
| ADPT / Adaptive Biotechnologies Corporation | 0,39 | 4,03 | 1,1150 | 1,1150 | |||||
| BYRN / Byrna Technologies Inc. | 0,17 | 3,67 | 1,0145 | 1,0145 | |||||
| XMTR / Xometry, Inc. | 0,11 | 3,60 | 0,9972 | 0,9972 | |||||
| CRAI / CRA International, Inc. | 0,02 | 3,60 | 0,9966 | 0,9966 | |||||
| US8252528851 / Invesco Government & Agency Portfolio, Institutional Class | 0,30 | -48,03 | 0,30 | -48,09 | 0,0829 | -0,0977 | |||
| HURN / Huron Consulting Group Inc. | 0,00 | -100,00 | 0,00 | -100,00 | -1,1481 | ||||
| HURN / Huron Consulting Group Inc. | 0,00 | -100,00 | 0,00 | -100,00 | -1,1481 | ||||
| LII / Lennox International Inc. | 0,00 | -100,00 | 0,00 | -100,00 | -2,1144 | ||||
| ALSN / Allison Transmission Holdings, Inc. | 0,00 | -100,00 | 0,00 | -100,00 | -1,5562 | ||||
| MWA / Mueller Water Products, Inc. | 0,00 | -100,00 | 0,00 | -100,00 | -1,4153 | ||||
| SANM / Sanmina Corporation | 0,00 | -100,00 | 0,00 | -100,00 | -1,4167 | ||||
| AZZ / AZZ Inc. | 0,00 | -100,00 | 0,00 | -100,00 | -1,1573 | ||||
| LQDT / Liquidity Services, Inc. | 0,00 | -100,00 | 0,00 | -100,00 | -1,1604 | ||||
| AYI / Acuity Inc. | 0,00 | -100,00 | 0,00 | -100,00 | -1,2984 | ||||
| PBI / Pitney Bowes Inc. | 0,00 | -100,00 | 0,00 | -100,00 | -1,6240 | ||||
| ZWS / Zurn Elkay Water Solutions Corporation | 0,00 | -100,00 | 0,00 | -100,00 | -1,3926 | ||||
| ESE / ESCO Technologies Inc. | 0,00 | -100,00 | 0,00 | -100,00 | -1,0935 | ||||
| ESAB / ESAB Corporation | 0,00 | -100,00 | 0,00 | -100,00 | -1,6069 | ||||
| NPO / Enpro Inc. | 0,00 | -100,00 | 0,00 | -100,00 | -1,0247 | ||||
| CR / Crane Company | 0,00 | -100,00 | 0,00 | -100,00 | -1,4523 | ||||
| EPAC / Enerpac Tool Group Corp. | 0,00 | -100,00 | 0,00 | -100,00 | -1,0476 | ||||
| CNM / Core & Main, Inc. | 0,00 | -100,00 | 0,00 | -100,00 | -1,5769 | ||||
| ARIS / Aris Water Solutions, Inc. | 0,00 | -100,00 | 0,00 | -100,00 | -1,6934 | ||||
| OSIS / OSI Systems, Inc. | 0,00 | -100,00 | 0,00 | -100,00 | -1,5520 |