Grundlæggende statistik
| Insider-profil | GOODWIN DANIEL L |
| Porteføljeværdi | $ 206.811.998 |
| Nuværende stillinger | 94 |
Seneste beholdninger, ydeevne, AUM (fra 13F, 13D)
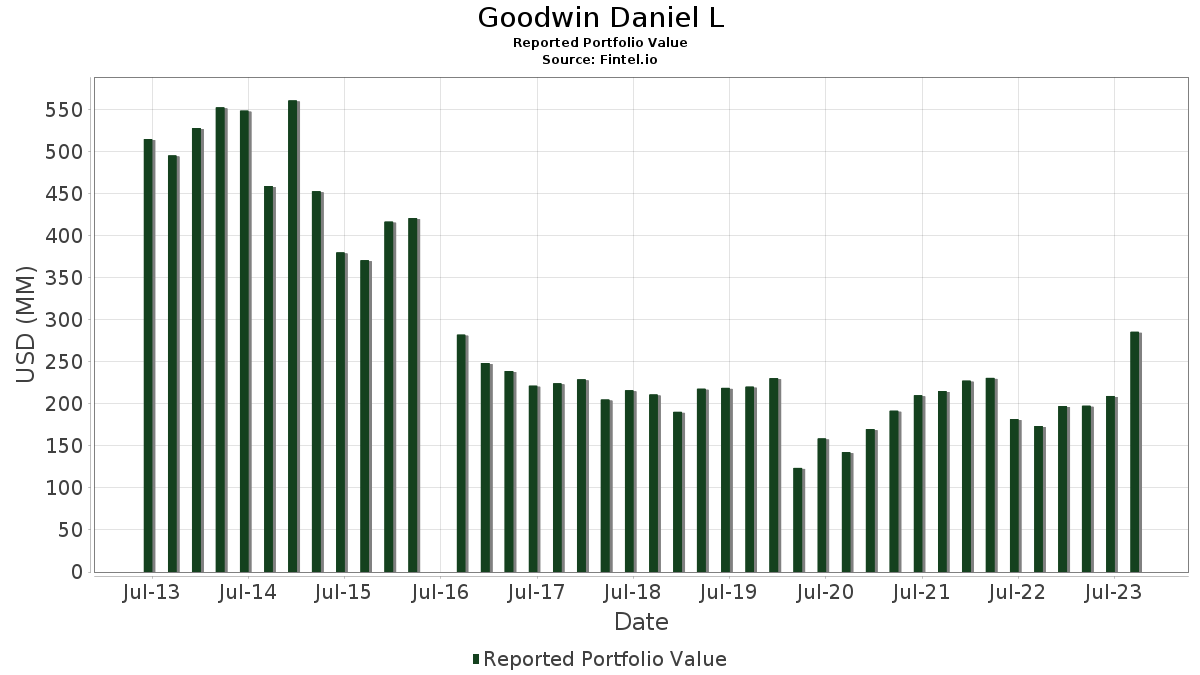
Goodwin Daniel L har afsløret 94 samlede besiddelser i deres seneste SEC-arkivering. Den seneste porteføljeværdi er beregnet til at være $ 206.811.998 USD. Faktiske aktiver under forvaltning (AUM) er denne værdi plus kontanter (som ikke er oplyst). Goodwin Daniel Ls største beholdninger er Kite Realty Group Trust (US:KRG) , SPDR S&P 500 ETF (US:SPY) , Alphabet Inc. (US:GOOG) , UnitedHealth Group Incorporated (US:UNH) , and Amazon.com, Inc. (US:AMZN) . Goodwin Daniel Ls nye stillinger omfatter Portillo's Inc. (US:PTLO) , Applied Materials, Inc. (US:AMAT) , Phillips 66 (US:PSX) , ON Semiconductor Corporation (US:ON) , and Cohen & Steers Quality Income Realty Fund, Inc. (US:RQI) .
Top øger dette kvartal
Vi bruger ændringen i porteføljeallokeringen, fordi dette er den mest meningsfulde metrik. Ændringer kan skyldes handler eller ændringer i aktiekurser.
| Sikkerhed | Aktier (MM) |
Værdi (MM$) |
Portefølje % | ΔPortefølje % |
|---|---|---|---|---|
| 0,04 | 0,69 | 0,2413 | 0,2413 | |
| 0,01 | 2,07 | 0,7238 | 0,1455 | |
| 0,01 | 0,34 | 0,1187 | 0,1187 | |
| 0,00 | 0,32 | 0,1114 | 0,1114 | |
| 0,00 | 0,30 | 0,1051 | 0,1051 | |
| 0,00 | 0,30 | 0,1041 | 0,1041 | |
| 0,02 | 0,24 | 0,0850 | 0,0850 | |
| 0,01 | 0,18 | 0,0638 | 0,0638 | |
| 0,00 | 0,08 | 0,0271 | 0,0271 | |
| 0,00 | 0,85 | 0,2972 | 0,0205 |
Top falder i dette kvartal
Vi bruger ændringen i porteføljeallokeringen, fordi dette er den mest meningsfulde metrik. Ændringer kan skyldes handler eller ændringer i aktiekurser.
| Sikkerhed | Aktier (MM) |
Værdi (MM$) |
Portefølje % | ΔPortefølje % |
|---|---|---|---|---|
| 5,13 | 109,97 | 38,4691 | -16,2709 | |
| 0,03 | 10,76 | 3,7636 | -1,1208 | |
| 0,02 | 2,08 | 0,7274 | -0,9789 | |
| 0,03 | 4,41 | 1,5411 | -0,5852 | |
| 0,01 | 5,13 | 1,7955 | -0,5398 | |
| 0,03 | 3,98 | 1,3926 | -0,5198 | |
| 0,26 | 2,66 | 0,9305 | -0,4973 | |
| 0,01 | 2,40 | 0,8410 | -0,4096 | |
| 0,01 | 3,06 | 1,0710 | -0,3489 | |
| 0,00 | 0,40 | 0,1387 | -0,3095 |
13F og Fondsarkivering
Denne formular blev indsendt den 2023-10-24 for rapporteringsperioden 2023-09-30. Klik på linkikonet for at se den fulde transaktionshistorik.
Opgrader for at låse op for premium-data og eksportere til Excel ![]() .
.
| Sikkerhed | Type | Gennemsnitlig aktiekurs | Aktier (MM) |
Δ Aktier (%) |
Δ Aktier (%) |
Værdi ($MM) |
Portefølje (%) |
ΔPortefølje (%) |
|
|---|---|---|---|---|---|---|---|---|---|
| KRG / Kite Realty Group Trust | 5,13 | 0,00 | 109,97 | -4,12 | 38,4691 | -16,2709 | |||
| SPY / SPDR S&P 500 ETF | 0,03 | 9,01 | 10,76 | 5,12 | 3,7636 | -1,1208 | |||
| GOOG / Alphabet Inc. | 0,04 | 11,40 | 5,57 | 21,42 | 1,9473 | -0,2409 | |||
| UNH / UnitedHealth Group Incorporated | 0,01 | 0,00 | 5,13 | 4,91 | 1,7955 | -0,5398 | |||
| AMZN / Amazon.com, Inc. | 0,03 | 1,40 | 4,41 | -1,12 | 1,5411 | -0,5852 | |||
| JPM / JPMorgan Chase & Co. | 0,03 | -0,36 | 3,98 | -0,65 | 1,3926 | -0,5198 | |||
| MPC / Marathon Petroleum Corporation | 0,02 | 0,00 | 3,77 | 29,80 | 1,3182 | -0,0675 | |||
| MSFT / Microsoft Corporation | 0,01 | 10,99 | 3,06 | 2,93 | 1,0710 | -0,3489 | |||
| DIA / SPDR Dow Jones Industrial Average ETF Trust | 0,01 | 23,95 | 2,99 | 20,71 | 1,0462 | -0,1360 | |||
| NVG / Nuveen AMT-Free Municipal Credit Income Fund | 0,26 | 0,90 | 2,66 | -11,10 | 0,9305 | -0,4973 | |||
| NVDA / NVIDIA Corporation | 0,01 | 5,68 | 2,43 | 8,69 | 0,8491 | -0,2169 | |||
| PANW / Palo Alto Networks, Inc. | 0,01 | 0,00 | 2,40 | -8,24 | 0,8410 | -0,4096 | |||
| AAPL / Apple Inc. | 0,01 | -0,15 | 2,31 | -11,87 | 1,1173 | -0,1340 | |||
| GS / The Goldman Sachs Group, Inc. | 0,01 | 4,72 | 2,15 | 5,03 | 0,7527 | -0,2248 | |||
| QCOM / QUALCOMM Incorporated | 0,02 | -37,66 | 2,08 | -41,85 | 0,7274 | -0,9789 | |||
| QQQ / Invesco QQQ Trust, Series 1 | 0,01 | 76,07 | 2,07 | 70,85 | 0,7238 | 0,1455 | |||
| BAC.PRL / Bank of America Corporation - Preferred Stock | 0,00 | 0,00 | 1,82 | -5,11 | 0,6369 | -0,2786 | |||
| MS / Morgan Stanley | 0,02 | 0,00 | 1,80 | -4,37 | 0,6285 | -0,2682 | |||
| GHI / Greystone Housing Impact Investors LP | 0,10 | 19,02 | 1,61 | 11,55 | 0,5645 | -0,1257 | |||
| NEA / Nuveen AMT-Free Quality Municipal Income Fund | 0,16 | 0,00 | 1,51 | -11,42 | 0,5294 | -0,2862 | |||
| NZF / Nuveen Municipal Credit Income Fund | 0,12 | 0,64 | 1,28 | -9,99 | 0,4475 | -0,2307 | |||
| NAD / Nuveen Quality Municipal Income Fund | 0,12 | -0,53 | 1,26 | -10,52 | 0,4407 | -0,2311 | |||
| IIM / Invesco Value Municipal Income Trust | 0,11 | 0,00 | 1,19 | -12,01 | 0,4154 | -0,2288 | |||
| IVT / InvenTrust Properties Corp. | 0,05 | 0,00 | 1,09 | 2,92 | 0,3829 | -0,1248 | |||
| MHD / BlackRock MuniHoldings Fund, Inc. | 0,10 | 0,00 | 1,02 | -11,37 | 0,3573 | -0,1926 | |||
| MYI / BlackRock MuniYield Quality Fund III, Inc. | 0,10 | 0,29 | 0,99 | -12,44 | 0,3448 | -0,1925 | |||
| WFC / Wells Fargo & Company | 0,02 | -2,45 | 0,98 | -6,60 | 0,3416 | -0,1575 | |||
| EQR / Equity Residential | 0,02 | 0,00 | 0,95 | -11,04 | 0,3330 | -0,1775 | |||
| META / Meta Platforms, Inc. | 0,00 | 40,10 | 0,85 | 46,63 | 0,2972 | 0,0205 | |||
| MMD / NYLI MacKay DefinedTerm Muni Opportunities Fund | 0,05 | 13,48 | 0,82 | 5,91 | 0,2884 | -0,0832 | |||
| NFLX / Netflix, Inc. | 0,00 | 0,00 | 0,79 | -14,38 | 0,2774 | -0,1641 | |||
| EVN / Eaton Vance Municipal Income Trust | 0,09 | 5,57 | 0,76 | -5,35 | 0,2659 | -0,1178 | |||
| NMCO / Nuveen Municipal Credit Opportunities Fund | 0,08 | 20,85 | 0,73 | 8,31 | 0,2554 | -0,0666 | |||
| PMM / Putnam Managed Municipal Income Trust | 0,13 | 5,56 | 0,73 | -5,09 | 0,2543 | -0,1117 | |||
| PTLO / Portillo's Inc. | 0,04 | 0,69 | 0,2413 | 0,2413 | |||||
| COP / ConocoPhillips | 0,01 | 0,00 | 0,68 | 15,59 | 0,2389 | -0,0430 | |||
| XHR / Xenia Hotels & Resorts, Inc. | 0,06 | 0,00 | 0,66 | -4,34 | 0,2317 | -0,0986 | |||
| TSLA / Tesla, Inc. | 0,00 | 0,00 | 0,64 | -4,45 | 0,2254 | -0,0963 | |||
| DE / Deere & Company | 0,00 | 29,55 | 0,62 | 20,62 | 0,2170 | -0,0284 | |||
| NMZ / Nuveen Municipal High Income Opportunity Fund | 0,07 | 10,37 | 0,61 | -3,16 | 0,2143 | -0,0874 | |||
| EIM / Eaton Vance Municipal Bond Fund | 0,07 | 0,00 | 0,60 | -9,85 | 0,2082 | -0,1073 | |||
| SBUX / Starbucks Corporation | 0,01 | 0,00 | 0,59 | -7,78 | 0,2075 | -0,0998 | |||
| COST / Costco Wholesale Corporation | 0,00 | -4,11 | 0,59 | 0,68 | 0,2075 | -0,0739 | |||
| LEO / BNY Mellon Strategic Municipals, Inc. | 0,11 | 1,83 | 0,59 | -12,68 | 0,2072 | -0,1168 | |||
| LOW / Lowe's Companies, Inc. | 0,00 | -3,82 | 0,55 | -11,45 | 0,1923 | -0,1039 | |||
| VZ / Verizon Communications Inc. | 0,02 | 28,68 | 0,54 | 12,32 | 0,1882 | -0,0408 | |||
| BYM / BlackRock Municipal Income Quality Trust | 0,05 | 2,10 | 0,48 | -10,49 | 0,1674 | -0,0878 | |||
| PMO / Putnam Municipal Opportunities Trust | 0,05 | 0,00 | 0,48 | -9,83 | 0,1669 | -0,0858 | |||
| UHT / Universal Health Realty Income Trust | 0,01 | 0,00 | 0,46 | -15,10 | 0,1614 | -0,0978 | |||
| OHI / Omega Healthcare Investors, Inc. | 0,01 | 0,00 | 0,45 | 7,91 | 0,1578 | -0,0414 | |||
| AVB / AvalonBay Communities, Inc. | 0,00 | 0,00 | 0,44 | -9,19 | 0,1522 | -0,0766 | |||
| CVS / CVS Health Corporation | 0,01 | 1,73 | 0,41 | 2,76 | 0,1437 | -0,0471 | |||
| CAT / Caterpillar Inc. | 0,00 | 42,31 | 0,40 | 58,43 | 0,1413 | 0,0192 | |||
| BX / Blackstone Inc. | 0,00 | -63,37 | 0,40 | -57,78 | 0,1387 | -0,3095 | |||
| LLY / Eli Lilly and Company | 0,00 | 0,00 | 0,38 | 14,33 | 0,1315 | -0,0252 | |||
| SO / The Southern Company | 0,01 | 0,00 | 0,36 | -8,03 | 0,1244 | -0,0598 | |||
| EPD / Enterprise Products Partners L.P. - Limited Partnership | 0,01 | 0,34 | 0,1187 | 0,1187 | |||||
| ICE / Intercontinental Exchange, Inc. | 0,00 | 50,00 | 0,33 | 46,02 | 0,1155 | 0,0075 | |||
| AMAT / Applied Materials, Inc. | 0,00 | 0,32 | 0,1114 | 0,1114 | |||||
| OCSL / Oaktree Specialty Lending Corporation | 0,02 | 20,74 | 0,32 | 25,40 | 0,1106 | -0,0101 | |||
| MCK / McKesson Corporation | 0,00 | 0,00 | 0,30 | 1,67 | 0,1065 | -0,0363 | |||
| MUI / BlackRock Municipal Income Fund, Inc. | 0,03 | 0,00 | 0,30 | -11,18 | 0,1057 | -0,0568 | |||
| PSX / Phillips 66 | 0,00 | 0,30 | 0,1051 | 0,1051 | |||||
| RNP / Cohen & Steers REIT and Preferred Income Fund, Inc. | 0,02 | 0,00 | 0,30 | -9,64 | 0,1051 | -0,0536 | |||
| ON / ON Semiconductor Corporation | 0,00 | 0,30 | 0,1041 | 0,1041 | |||||
| CSCO / Cisco Systems, Inc. | 0,01 | 0,00 | 0,30 | 3,87 | 0,1034 | -0,0324 | |||
| CSQ / Calamos Strategic Total Return Fund | 0,02 | 34,35 | 0,29 | 28,51 | 0,1025 | -0,0066 | |||
| ISRG / Intuitive Surgical, Inc. | 0,00 | 66,67 | 0,29 | 42,44 | 0,1022 | 0,0043 | |||
| MHI / Pioneer Municipal High Income Fund, Inc. | 0,04 | 9,54 | 0,29 | -7,35 | 0,1017 | -0,0477 | |||
| WMT / Walmart Inc. | 0,00 | 0,00 | 0,29 | 1,77 | 0,1007 | -0,0343 | |||
| FANG / Diamondback Energy, Inc. | 0,00 | -10,00 | 0,28 | 6,11 | 0,0975 | -0,0279 | |||
| RITM / Rithm Capital Corp. | 0,03 | -2,68 | 0,27 | -3,23 | 0,0946 | -0,0389 | |||
| STZ / Constellation Brands, Inc. | 0,00 | 1,42 | 0,27 | 3,46 | 0,0943 | -0,0299 | |||
| GOOGL / Alphabet Inc. | 0,00 | 0,00 | 0,26 | 9,21 | 0,0916 | -0,0227 | |||
| MQT / BlackRock MuniYield Quality Fund II, Inc. | 0,03 | 9,62 | 0,26 | -1,92 | 0,0896 | -0,0352 | |||
| ORCL / Oracle Corporation | 0,00 | 0,00 | 0,25 | -10,88 | 0,0889 | -0,0475 | |||
| ABBV / AbbVie Inc. | 0,00 | 0,00 | 0,25 | 10,57 | 0,0881 | -0,0206 | |||
| RQI / Cohen & Steers Quality Income Realty Fund, Inc. | 0,02 | 0,24 | 0,0850 | 0,0850 | |||||
| MAV / Pioneer Municipal High Income Advantage Fund, Inc. | 0,04 | 4,36 | 0,24 | -11,07 | 0,0845 | -0,0452 | |||
| MVF / BlackRock MuniVest Fund, Inc. | 0,04 | 0,00 | 0,24 | -9,96 | 0,0823 | -0,0424 | |||
| BXSL / Blackstone Secured Lending Fund | 0,01 | 6,29 | 0,23 | 6,45 | 0,0809 | -0,0229 | |||
| CCI / Crown Castle Inc. | 0,00 | 0,00 | 0,23 | -19,01 | 0,0805 | -0,0555 | |||
| KO / The Coca-Cola Company | 0,00 | 0,00 | 0,22 | -7,08 | 0,0783 | -0,0366 | |||
| NKE / NIKE, Inc. | 0,00 | 0,00 | 0,22 | -13,44 | 0,0769 | -0,0442 | |||
| VTR / Ventas, Inc. | 0,00 | 0,00 | 0,21 | -10,73 | 0,0730 | -0,0387 | |||
| NSC / Norfolk Southern Corporation | 0,00 | 0,00 | 0,21 | -13,45 | 0,0723 | -0,0413 | |||
| CSX / CSX Corporation | 0,01 | 0,00 | 0,20 | -10,22 | 0,0710 | -0,0364 | |||
| MUE / BlackRock MuniHoldings Quality Fund II, Inc. | 0,02 | 0,00 | 0,20 | -9,46 | 0,0703 | -0,0358 | |||
| ET / Energy Transfer LP - Limited Partnership | 0,01 | 22,73 | 0,19 | 35,97 | 0,0663 | -0,0004 | |||
| RMMZ / RiverNorth Managed Duration Municipal Income Fund II, Inc. | 0,01 | 0,18 | 0,0638 | 0,0638 | |||||
| SELF / Global Self Storage, Inc. | 0,03 | -8,57 | 0,16 | -11,93 | 0,0544 | -0,0300 | |||
| WCC / WESCO International, Inc. | 0,00 | 0,08 | 0,0271 | 0,0271 | |||||
| DMF / BNY Mellon Municipal Income, Inc. | 0,01 | 0,00 | 0,07 | -9,76 | 0,0261 | -0,0134 | |||
| NRDY / Nerdy, Inc. | 0,01 | 0,00 | 0,04 | -9,76 | 0,0129 | -0,0070 | |||
| NXPI / NXP Semiconductors N.V. | 0,00 | -100,00 | 0,00 | -100,00 | -0,0977 | ||||
| TCPC / BlackRock TCP Capital Corp. | 0,00 | -100,00 | 0,00 | -100,00 | -0,0521 | ||||
| VMW / Vmware Inc. - Class A | 0,00 | -100,00 | 0,00 | -100,00 | -0,1166 | ||||
| BALL / Ball Corporation | 0,00 | -100,00 | 0,00 | -100,00 | -0,0243 | ||||
| O / Realty Income Corporation | 0,00 | -100,00 | 0,00 | -100,00 | -0,1006 |