Grundlæggende statistik
| Porteføljeværdi | $ 134.724.680 |
| Nuværende stillinger | 96 |
Seneste beholdninger, ydeevne, AUM (fra 13F, 13D)
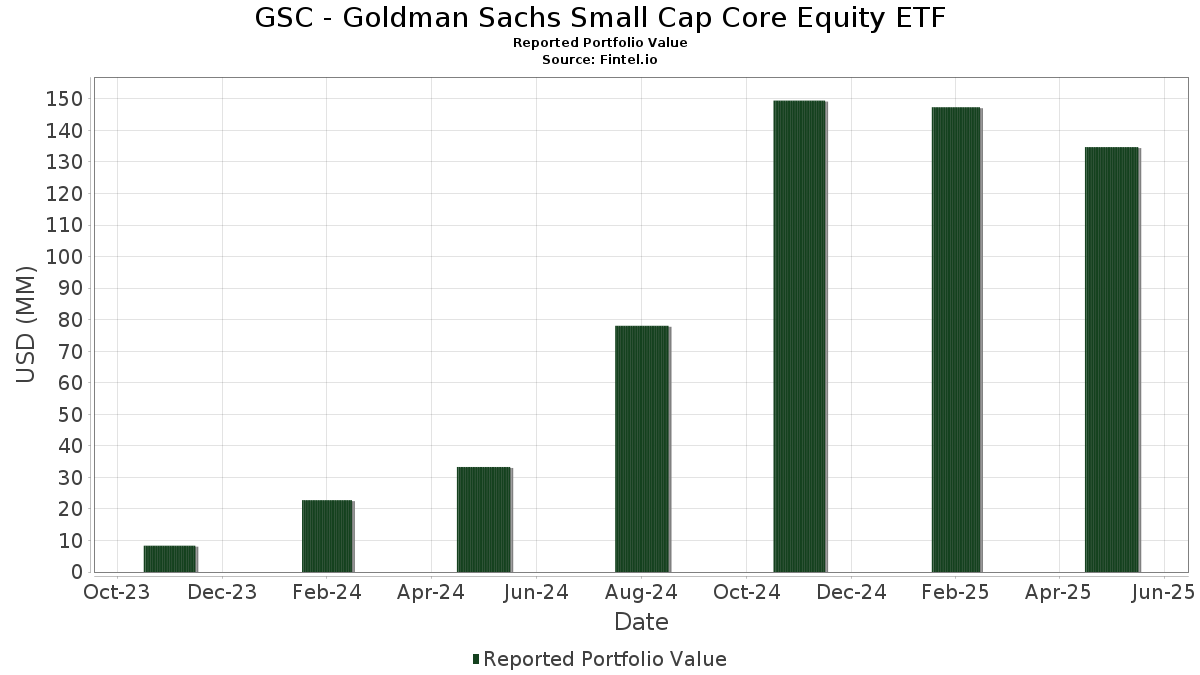
GSC - Goldman Sachs Small Cap Core Equity ETF har afsløret 96 samlede besiddelser i deres seneste SEC-arkivering. Den seneste porteføljeværdi er beregnet til at være $ 134.724.680 USD. Faktiske aktiver under forvaltning (AUM) er denne værdi plus kontanter (som ikke er oplyst). GSC - Goldman Sachs Small Cap Core Equity ETFs største beholdninger er COMMON STOCK (US:US78473E1038) , Federal Signal Corporation (US:FSS) , Moog, Inc. - Class A (US:MOGA) , Skyward Specialty Insurance Group, Inc. (US:SKWD) , and Goldman Sachs Trust - Financial Square Treasury Obligations Fund FST Class (US:FTOXX) . GSC - Goldman Sachs Small Cap Core Equity ETFs nye stillinger omfatter The Hanover Insurance Group, Inc. (US:THG) , Kontoor Brands, Inc. (US:KTB) , Prestige Consumer Healthcare Inc. (US:PBH) , InvenTrust Properties Corp. (US:IVT) , and Cousins Properties Incorporated (US:CUZ) .
Top øger dette kvartal
Vi bruger ændringen i porteføljeallokeringen, fordi dette er den mest meningsfulde metrik. Ændringer kan skyldes handler eller ændringer i aktiekurser.
| Sikkerhed | Aktier (MM) |
Værdi (MM$) |
Portefølje % | ΔPortefølje % |
|---|---|---|---|---|
| FTOXX / Goldman Sachs Trust - Financial Square Treasury Obligations Fund FST Class | 2,63 | 2,63 | 1,9633 | 1,2786 |
| THG / The Hanover Insurance Group, Inc. | 0,01 | 1,37 | 1,0260 | 1,0260 |
| KTB / Kontoor Brands, Inc. | 0,02 | 1,09 | 0,8171 | 0,8171 |
| PBH / Prestige Consumer Healthcare Inc. | 0,01 | 1,07 | 0,7971 | 0,7971 |
| IVT / InvenTrust Properties Corp. | 0,04 | 1,02 | 0,7590 | 0,7590 |
| CUZ / Cousins Properties Incorporated | 0,04 | 1,01 | 0,7543 | 0,7543 |
| DAN / Dana Incorporated | 0,06 | 0,96 | 0,7187 | 0,7187 |
| CNX / CNX Resources Corporation | 0,03 | 0,86 | 0,6417 | 0,6417 |
| AROC / Archrock, Inc. | 0,03 | 0,86 | 0,6388 | 0,6388 |
| MNTN / MNTN, Inc. | 0,03 | 0,82 | 0,6157 | 0,6157 |
Top falder i dette kvartal
Vi bruger ændringen i porteføljeallokeringen, fordi dette er den mest meningsfulde metrik. Ændringer kan skyldes handler eller ændringer i aktiekurser.
| Sikkerhed | Aktier (MM) |
Værdi (MM$) |
Portefølje % | ΔPortefølje % |
|---|---|---|---|---|
| BL / BlackLine, Inc. | 0,00 | 0,00 | -0,7733 | |
| BLFS / BioLife Solutions, Inc. | 0,00 | 0,00 | -0,7258 | |
| KNF / Knife River Corporation | 0,02 | 1,48 | 1,1020 | -0,4839 |
| ACA / Arcosa, Inc. | 0,02 | 1,33 | 0,9957 | -0,3472 |
| DOCN / DigitalOcean Holdings, Inc. | 0,03 | 0,87 | 0,6480 | -0,3096 |
| PWP / Perella Weinberg Partners | 0,10 | 1,67 | 1,2455 | -0,2886 |
| WGS / GeneDx Holdings Corp. | 0,01 | 0,83 | 0,6226 | -0,2284 |
| NMRK / Newmark Group, Inc. | 0,09 | 1,03 | 0,7660 | -0,2233 |
| CRGY / Crescent Energy Company | 0,07 | 0,62 | 0,4610 | -0,2156 |
| CWAN / Clearwater Analytics Holdings, Inc. | 0,04 | 0,94 | 0,6998 | -0,2064 |
13F og Fondsarkivering
Denne formular blev indsendt den 2025-07-22 for rapporteringsperioden 2025-05-31. Klik på linkikonet for at se den fulde transaktionshistorik.
Opgrader for at låse op for premium-data og eksportere til Excel ![]() .
.
| Sikkerhed | Type | Gennemsnitlig aktiekurs | Aktier (MM) |
Δ Aktier (%) |
Værdi ($MM) |
Δ Aktier (%) |
Portefølje (%) |
ΔPortefølje (%) |
|
|---|---|---|---|---|---|---|---|---|---|
| US78473E1038 / COMMON STOCK | 0,02 | 12,06 | 3,04 | 17,04 | 2,2665 | 0,4903 | |||
| FSS / Federal Signal Corporation | 0,03 | -20,51 | 2,80 | -7,99 | 2,0902 | 0,0069 | |||
| MOGA / Moog, Inc. - Class A | 0,01 | -3,15 | 2,78 | 5,27 | 2,0730 | 0,2671 | |||
| SKWD / Skyward Specialty Insurance Group, Inc. | 0,04 | -3,81 | 2,76 | 17,13 | 2,0579 | 0,4469 | |||
| FTOXX / Goldman Sachs Trust - Financial Square Treasury Obligations Fund FST Class | 2,63 | 162,93 | 2,63 | 163,00 | 1,9633 | 1,2786 | |||
| CVLT / Commvault Systems, Inc. | 0,01 | -4,35 | 2,59 | 2,70 | 1,9310 | 0,2070 | |||
| BMI / Badger Meter, Inc. | 0,01 | -3,88 | 2,54 | 13,42 | 1,8933 | 0,3627 | |||
| ESE / ESCO Technologies Inc. | 0,01 | -5,64 | 2,36 | 3,73 | 1,7644 | 0,2046 | |||
| CR / Crane Company | 0,01 | -3,45 | 2,29 | 1,51 | 1,7072 | 0,1653 | |||
| HALO / Halozyme Therapeutics, Inc. | 0,04 | -3,36 | 2,25 | -8,42 | 1,6817 | -0,0018 | |||
| ATI / ATI Inc. | 0,03 | -3,09 | 2,20 | 32,75 | 1,6434 | 0,5078 | |||
| NMIH / NMI Holdings, Inc. | 0,05 | -3,21 | 2,17 | 5,49 | 1,6204 | 0,2120 | |||
| BOOT / Boot Barn Holdings, Inc. | 0,01 | -3,68 | 2,15 | 26,14 | 1,6066 | 0,4385 | |||
| MYRG / MYR Group Inc. | 0,01 | -5,12 | 2,12 | 21,31 | 1,5850 | 0,3864 | |||
| MTSI / MACOM Technology Solutions Holdings, Inc. | 0,02 | -6,37 | 2,11 | -1,59 | 1,5735 | 0,1078 | |||
| SXI / Standex International Corporation | 0,01 | 31,04 | 2,10 | 6,32 | 1,5697 | 0,2162 | |||
| PIPR / Piper Sandler Companies | 0,01 | -5,08 | 2,06 | -17,58 | 1,5364 | -0,1732 | |||
| MMSI / Merit Medical Systems, Inc. | 0,02 | -4,71 | 1,90 | -11,28 | 1,4213 | -0,0473 | |||
| WAY / Waystar Holding Corp. | 0,05 | -5,87 | 1,86 | -13,42 | 1,3874 | -0,0821 | |||
| SHAK / Shake Shack Inc. | 0,01 | -3,68 | 1,80 | 15,08 | 1,3448 | 0,2735 | |||
| OLLI / Ollie's Bargain Outlet Holdings, Inc. | 0,02 | -5,53 | 1,73 | 1,71 | 1,2882 | 0,1269 | |||
| CADE / Cadence Bank | 0,06 | 6,06 | 1,72 | -3,10 | 1,2837 | 0,0690 | |||
| SSB / SouthState Bank Corporation | 0,02 | 7,06 | 1,69 | -6,74 | 1,2598 | 0,0209 | |||
| PRMB / Primo Brands Corporation | 0,05 | -6,18 | 1,67 | -7,92 | 1,2502 | 0,0053 | |||
| PWP / Perella Weinberg Partners | 0,10 | -0,95 | 1,67 | -25,57 | 1,2455 | -0,2886 | |||
| IRTC / iRhythm Technologies, Inc. | 0,01 | -11,02 | 1,65 | 13,45 | 1,2346 | 0,2370 | |||
| MOD / Modine Manufacturing Company | 0,02 | -4,61 | 1,65 | 2,43 | 1,2296 | 0,1288 | |||
| HLNE / Hamilton Lane Incorporated | 0,01 | -5,39 | 1,63 | -9,84 | 1,2182 | -0,0205 | |||
| ESAB / ESAB Corporation | 0,01 | -5,27 | 1,61 | -7,00 | 1,1999 | 0,0166 | |||
| KTOS / Kratos Defense & Security Solutions, Inc. | 0,04 | -4,08 | 1,60 | 34,09 | 1,1929 | 0,3771 | |||
| TXNM / TXNM Energy, Inc. | 0,03 | -4,74 | 1,58 | 3,34 | 1,1785 | 0,1329 | |||
| ALKS / Alkermes plc | 0,05 | -5,05 | 1,58 | -15,36 | 1,1768 | -0,0979 | |||
| BANR / Banner Corporation | 0,03 | -3,01 | 1,58 | -13,32 | 1,1761 | -0,0680 | |||
| GTES / Gates Industrial Corporation plc | 0,07 | -3,73 | 1,56 | -5,90 | 1,1661 | 0,0297 | |||
| SF / Stifel Financial Corp. | 0,02 | -3,23 | 1,55 | -14,17 | 1,1576 | -0,0788 | |||
| KMPR / Kemper Corporation | 0,02 | -6,85 | 1,52 | -12,18 | 1,1359 | -0,0498 | |||
| VERX / Vertex, Inc. | 0,04 | -6,09 | 1,50 | 15,11 | 1,1206 | 0,2277 | |||
| AVNT / Avient Corporation | 0,04 | -5,03 | 1,49 | -19,80 | 1,1134 | -0,1593 | |||
| MTH / Meritage Homes Corporation | 0,02 | -6,44 | 1,49 | -17,86 | 1,1125 | -0,1297 | |||
| KNF / Knife River Corporation | 0,02 | -35,21 | 1,48 | -36,27 | 1,1020 | -0,4839 | |||
| INTA / Intapp, Inc. | 0,03 | 58,72 | 1,46 | 32,67 | 1,0890 | 0,3361 | |||
| PJT / PJT Partners Inc. | 0,01 | -2,98 | 1,45 | -8,24 | 1,0808 | 0,0010 | |||
| TRNO / Terreno Realty Corporation | 0,03 | -3,33 | 1,43 | -19,57 | 1,0706 | -0,1501 | |||
| FRME / First Merchants Corporation | 0,04 | -3,69 | 1,43 | -17,09 | 1,0649 | -0,1130 | |||
| IRT / Independence Realty Trust, Inc. | 0,08 | -6,00 | 1,41 | -19,85 | 1,0524 | -0,1515 | |||
| FELE / Franklin Electric Co., Inc. | 0,02 | -5,16 | 1,39 | -19,80 | 1,0403 | -0,1491 | |||
| TENB / Tenable Holdings, Inc. | 0,04 | -5,98 | 1,39 | -20,55 | 1,0364 | -0,1601 | |||
| THG / The Hanover Insurance Group, Inc. | 0,01 | 1,37 | 1,0260 | 1,0260 | |||||
| MHO / M/I Homes, Inc. | 0,01 | -5,82 | 1,34 | -14,27 | 1,0004 | -0,0698 | |||
| ACA / Arcosa, Inc. | 0,02 | -33,89 | 1,33 | -32,02 | 0,9957 | -0,3472 | |||
| CAKE / The Cheesecake Factory Incorporated | 0,02 | -6,02 | 1,30 | -3,99 | 0,9692 | 0,0431 | |||
| PFSI / PennyMac Financial Services, Inc. | 0,01 | -4,75 | 1,29 | -11,80 | 0,9659 | -0,0381 | |||
| ITGR / Integer Holdings Corporation | 0,01 | -5,84 | 1,29 | -9,28 | 0,9645 | -0,0099 | |||
| PPBI / Pacific Premier Bancorp, Inc. | 0,06 | -2,98 | 1,23 | -13,89 | 0,9165 | -0,0597 | |||
| GBCI / Glacier Bancorp, Inc. | 0,03 | -3,32 | 1,22 | -17,97 | 0,9107 | -0,1066 | |||
| AUB / Atlantic Union Bankshares Corporation | 0,04 | -5,59 | 1,21 | -20,51 | 0,9056 | -0,1395 | |||
| FROG / JFrog Ltd. | 0,03 | -6,04 | 1,19 | 9,81 | 0,8864 | 0,1460 | |||
| PNFP / Pinnacle Financial Partners, Inc. | 0,01 | -6,03 | 1,14 | -12,57 | 0,8518 | -0,0418 | |||
| QTWO / Q2 Holdings, Inc. | 0,01 | -6,05 | 1,12 | -5,83 | 0,8323 | 0,0213 | |||
| KTB / Kontoor Brands, Inc. | 0,02 | 1,09 | 0,8171 | 0,8171 | |||||
| AEIS / Advanced Energy Industries, Inc. | 0,01 | -6,09 | 1,07 | -6,40 | 0,7974 | 0,0162 | |||
| PBH / Prestige Consumer Healthcare Inc. | 0,01 | 1,07 | 0,7971 | 0,7971 | |||||
| ALKT / Alkami Technology, Inc. | 0,04 | 16,72 | 1,06 | 8,39 | 0,7911 | 0,1219 | |||
| PATK / Patrick Industries, Inc. | 0,01 | -6,01 | 1,04 | -10,91 | 0,7743 | -0,0228 | |||
| NMRK / Newmark Group, Inc. | 0,09 | -5,39 | 1,03 | -29,00 | 0,7660 | -0,2233 | |||
| IVT / InvenTrust Properties Corp. | 0,04 | 1,02 | 0,7590 | 0,7590 | |||||
| FUL / H.B. Fuller Company | 0,02 | -6,01 | 1,01 | -7,57 | 0,7574 | 0,0063 | |||
| PNTG / The Pennant Group, Inc. | 0,04 | -5,97 | 1,01 | 18,48 | 0,7569 | 0,1715 | |||
| CUZ / Cousins Properties Incorporated | 0,04 | 1,01 | 0,7543 | 0,7543 | |||||
| KN / Knowles Corporation | 0,06 | -5,99 | 1,01 | -7,02 | 0,7519 | 0,0104 | |||
| BPMC / Blueprint Medicines Corporation | 0,01 | -6,00 | 0,98 | -1,41 | 0,7308 | 0,0515 | |||
| DAN / Dana Incorporated | 0,06 | 0,96 | 0,7187 | 0,7187 | |||||
| CWAN / Clearwater Analytics Holdings, Inc. | 0,04 | -4,66 | 0,94 | -29,18 | 0,6998 | -0,2064 | |||
| LOAR / Loar Holdings Inc. | 0,01 | -6,01 | 0,93 | 12,50 | 0,6926 | 0,1285 | |||
| PI / Impinj, Inc. | 0,01 | -6,00 | 0,91 | 10,98 | 0,6795 | 0,1179 | |||
| MTDR / Matador Resources Company | 0,02 | 12,65 | 0,90 | -7,39 | 0,6734 | 0,0063 | |||
| GPK / Graphic Packaging Holding Company | 0,04 | -2,98 | 0,90 | -19,28 | 0,6696 | -0,0903 | |||
| DOCN / DigitalOcean Holdings, Inc. | 0,03 | -6,05 | 0,87 | -37,91 | 0,6480 | -0,3096 | |||
| OS / OneStream, Inc. | 0,03 | -9,23 | 0,86 | 9,38 | 0,6445 | 0,1038 | |||
| CNX / CNX Resources Corporation | 0,03 | 0,86 | 0,6417 | 0,6417 | |||||
| AROC / Archrock, Inc. | 0,03 | 0,86 | 0,6388 | 0,6388 | |||||
| WGS / GeneDx Holdings Corp. | 0,01 | -3,11 | 0,83 | -32,90 | 0,6226 | -0,2284 | |||
| MNTN / MNTN, Inc. | 0,03 | 0,82 | 0,6157 | 0,6157 | |||||
| CMC / Commercial Metals Company | 0,02 | -8,74 | 0,81 | -12,30 | 0,6022 | -0,0270 | |||
| IBP / Installed Building Products, Inc. | 0,00 | -6,03 | 0,80 | -12,54 | 0,5938 | -0,0290 | |||
| GOLDMAN SACHS FINANCIAL SQUARE FUNDS PRIME OBLIGATIONS FUND / STIV (000000000) | 0,79 | 0,79 | 0,5896 | 0,5896 | |||||
| LNTH / Lantheus Holdings, Inc. | 0,01 | -6,41 | 0,77 | -24,63 | 0,5736 | -0,1243 | |||
| RVMD / Revolution Medicines, Inc. | 0,02 | -13,49 | 0,74 | -16,38 | 0,5530 | -0,0531 | |||
| ASGN / ASGN Incorporated | 0,01 | -6,12 | 0,74 | -26,47 | 0,5499 | -0,1354 | |||
| VCYT / Veracyte, Inc. | 0,03 | -6,20 | 0,70 | -28,22 | 0,5207 | -0,1443 | |||
| BBIO / BridgeBio Pharma, Inc. | 0,02 | 0,63 | 0,4722 | 0,4722 | |||||
| CRGY / Crescent Energy Company | 0,07 | -6,02 | 0,62 | -37,55 | 0,4610 | -0,2156 | |||
| PTEN / Patterson-UTI Energy, Inc. | 0,08 | -5,98 | 0,46 | -37,62 | 0,3411 | -0,1597 | |||
| DVAX / Dynavax Technologies Corporation | 0,05 | -6,08 | 0,44 | -33,43 | 0,3292 | -0,1235 | |||
| AHL / Aspen Insurance Holdings Limited | 0,01 | 0,43 | 0,3182 | 0,3182 | |||||
| IMVT / Immunovant, Inc. | 0,02 | -5,95 | 0,33 | -32,25 | 0,2496 | -0,0880 | |||
| BLFS / BioLife Solutions, Inc. | 0,00 | -100,00 | 0,00 | -100,00 | -0,7258 | ||||
| BL / BlackLine, Inc. | 0,00 | -100,00 | 0,00 | -100,00 | -0,7733 |