Grundlæggende statistik
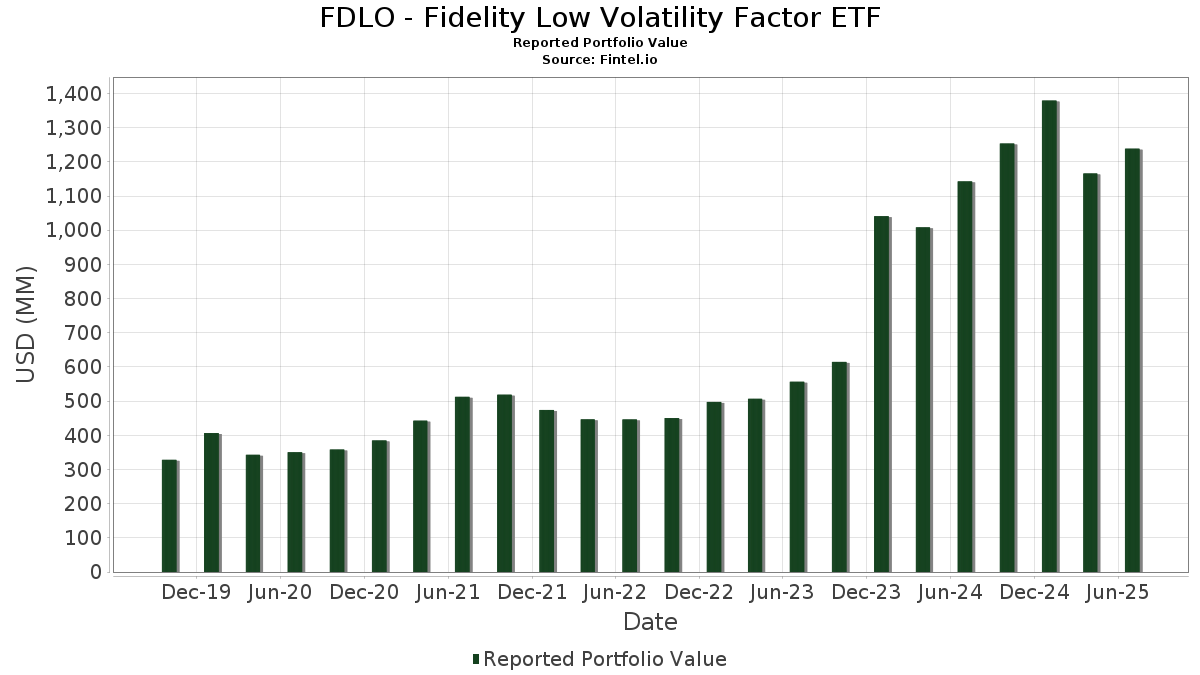
| Porteføljeværdi | $ 1.238.556.281 |
| Nuværende stillinger | 128 |
Seneste beholdninger, ydeevne, AUM (fra 13F, 13D)
FDLO - Fidelity Low Volatility Factor ETF har afsløret 128 samlede besiddelser i deres seneste SEC-arkivering. Den seneste porteføljeværdi er beregnet til at være $ 1.238.556.281 USD. Faktiske aktiver under forvaltning (AUM) er denne værdi plus kontanter (som ikke er oplyst). FDLO - Fidelity Low Volatility Factor ETFs største beholdninger er Microsoft Corporation (US:MSFT) , Apple Inc. (US:AAPL) , Amazon.com, Inc. (US:AMZN) , Alphabet Inc. (US:GOOGL) , and Broadcom Inc. (US:AVGO) .
Top øger dette kvartal
Vi bruger ændringen i porteføljeallokeringen, fordi dette er den mest meningsfulde metrik. Ændringer kan skyldes handler eller ændringer i aktiekurser.
| Sikkerhed | Aktier (MM) |
Værdi (MM$) |
Portefølje % | ΔPortefølje % |
|---|---|---|---|---|
| MSFT / Microsoft Corporation | 0,19 | 100,16 | 8,1045 | 1,7461 |
| AVGO / Broadcom Inc. | 0,15 | 43,93 | 3,5547 | 1,0881 |
| ORCL / Oracle Corporation | 0,10 | 25,56 | 2,0679 | 0,8534 |
| AMZN / Amazon.com, Inc. | 0,23 | 52,80 | 4,2719 | 0,7090 |
| GOOGL / Alphabet Inc. | 0,27 | 52,05 | 4,2114 | 0,5214 |
| JPM / JPMorgan Chase & Co. | 0,08 | 24,94 | 2,0180 | 0,2531 |
| CSCO / Cisco Systems, Inc. | 0,27 | 18,19 | 1,4717 | 0,1504 |
| ETN / Eaton Corporation plc | 0,02 | 9,47 | 0,7665 | 0,1445 |
| NKE / NIKE, Inc. | 0,10 | 7,53 | 0,6093 | 0,1222 |
| LHX / L3Harris Technologies, Inc. | 0,03 | 7,80 | 0,6311 | 0,0958 |
Top falder i dette kvartal
Vi bruger ændringen i porteføljeallokeringen, fordi dette er den mest meningsfulde metrik. Ændringer kan skyldes handler eller ændringer i aktiekurser.
| Sikkerhed | Aktier (MM) |
Værdi (MM$) |
Portefølje % | ΔPortefølje % |
|---|---|---|---|---|
| AAPL / Apple Inc. | 0,37 | 77,78 | 6,2932 | -0,5282 |
| UNH / UnitedHealth Group Incorporated | 0,03 | 7,61 | 0,6156 | -0,4603 |
| LLY / Eli Lilly and Company | 0,02 | 17,62 | 1,4257 | -0,4108 |
| BRK.B / Berkshire Hathaway Inc. | 0,05 | 24,98 | 2,0210 | -0,3981 |
| FI / Fiserv, Inc. | 0,04 | 5,55 | 0,4490 | -0,1832 |
| PGR / The Progressive Corporation | 0,04 | 9,23 | 0,7469 | -0,1739 |
| ACN / Accenture plc | 0,04 | 11,20 | 0,9066 | -0,1691 |
| VRSN / VeriSign, Inc. | 0,05 | 14,28 | 1,1555 | -0,1286 |
| MMC / Marsh & McLennan Companies, Inc. | 0,04 | 7,72 | 0,6246 | -0,1247 |
| PG / The Procter & Gamble Company | 0,07 | 10,04 | 0,8126 | -0,1170 |
13F og Fondsarkivering
Denne formular blev indsendt den 2025-09-26 for rapporteringsperioden 2025-07-31. Klik på linkikonet for at se den fulde transaktionshistorik.
Opgrader for at låse op for premium-data og eksportere til Excel ![]() .
.
| Sikkerhed | Type | Gennemsnitlig aktiekurs | Aktier (MM) |
Δ Aktier (%) |
Δ Aktier (%) |
Værdi ($MM) |
Portefølje (%) |
ΔPortefølje (%) |
|
|---|---|---|---|---|---|---|---|---|---|
| MSFT / Microsoft Corporation | 0,19 | 0,29 | 100,16 | 35,37 | 8,1045 | 1,7461 | |||
| AAPL / Apple Inc. | 0,37 | 0,30 | 77,78 | -2,02 | 6,2932 | -0,5282 | |||
| AMZN / Amazon.com, Inc. | 0,23 | 0,31 | 52,80 | 27,33 | 4,2719 | 0,7090 | |||
| GOOGL / Alphabet Inc. | 0,27 | 0,30 | 52,05 | 21,21 | 4,2114 | 0,5214 | |||
| AVGO / Broadcom Inc. | 0,15 | 0,30 | 43,93 | 53,05 | 3,5547 | 1,0881 | |||
| ORCL / Oracle Corporation | 0,10 | 0,27 | 25,56 | 80,83 | 2,0679 | 0,8534 | |||
| BRK.B / Berkshire Hathaway Inc. | 0,05 | 0,26 | 24,98 | -11,28 | 2,0210 | -0,3981 | |||
| JPM / JPMorgan Chase & Co. | 0,08 | 0,27 | 24,94 | 21,43 | 2,0180 | 0,2531 | |||
| V / Visa Inc. | 0,06 | 0,28 | 19,15 | 0,27 | 1,5497 | -0,0916 | |||
| CSCO / Cisco Systems, Inc. | 0,27 | 0,31 | 18,19 | 18,29 | 1,4717 | 0,1504 | |||
| LLY / Eli Lilly and Company | 0,02 | 0,14 | 17,62 | -17,56 | 1,4257 | -0,4108 | |||
| MA / Mastercard Incorporated | 0,03 | 0,18 | 16,36 | 3,55 | 1,3240 | -0,0339 | |||
| IBM / International Business Machines Corporation | 0,06 | 0,25 | 15,95 | 4,95 | 1,2905 | -0,0154 | |||
| TXN / Texas Instruments Incorporated | 0,08 | 0,29 | 14,87 | 13,45 | 1,2029 | 0,0769 | |||
| JNJ / Johnson & Johnson | 0,09 | 0,31 | 14,67 | 5,71 | 1,1871 | -0,0054 | |||
| ADI / Analog Devices, Inc. | 0,06 | 0,30 | 14,55 | 15,59 | 1,1769 | 0,0956 | |||
| VRSN / VeriSign, Inc. | 0,05 | 0,27 | 14,28 | -4,44 | 1,1555 | -0,1286 | |||
| T / AT&T Inc. | 0,48 | 0,31 | 13,15 | -0,74 | 1,0639 | -0,0744 | |||
| ABBV / AbbVie Inc. | 0,07 | 0,27 | 12,87 | -2,85 | 1,0410 | -0,0970 | |||
| HD / The Home Depot, Inc. | 0,03 | 0,29 | 12,85 | 2,25 | 1,0396 | -0,0402 | |||
| XOM / Exxon Mobil Corporation | 0,11 | 0,30 | 12,67 | 6,00 | 1,0249 | -0,0019 | |||
| VZ / Verizon Communications Inc. | 0,29 | 0,30 | 12,35 | -2,66 | 0,9997 | -0,0910 | |||
| ROP / Roper Technologies, Inc. | 0,02 | 0,17 | 12,01 | -1,56 | 0,9716 | -0,0766 | |||
| MSI / Motorola Solutions, Inc. | 0,03 | 0,25 | 11,93 | -0,07 | 0,9653 | -0,0605 | |||
| WMT / Walmart Inc. | 0,12 | 0,28 | 11,75 | 1,03 | 0,9507 | -0,0487 | |||
| TYL / Tyler Technologies, Inc. | 0,02 | 0,23 | 11,30 | 7,84 | 0,9142 | 0,0139 | |||
| ACN / Accenture plc | 0,04 | 0,25 | 11,20 | -10,49 | 0,9066 | -0,1691 | |||
| DOX / Amdocs Limited | 0,13 | 0,30 | 11,19 | -3,35 | 0,9056 | -0,0894 | |||
| CMCSA / Comcast Corporation | 0,32 | 0,31 | 10,52 | -2,54 | 0,8513 | -0,0763 | |||
| MCD / McDonald's Corporation | 0,03 | 0,18 | 10,46 | -5,95 | 0,8462 | -0,1094 | |||
| TMUS / T-Mobile US, Inc. | 0,04 | 0,26 | 10,33 | -3,21 | 0,8356 | -0,0812 | |||
| ABT / Abbott Laboratories | 0,08 | 0,29 | 10,21 | -3,20 | 0,8261 | -0,0803 | |||
| EA / Electronic Arts Inc. | 0,07 | 0,27 | 10,08 | 5,38 | 0,8156 | -0,0064 | |||
| PG / The Procter & Gamble Company | 0,07 | 0,30 | 10,04 | -7,16 | 0,8126 | -0,1170 | |||
| CME / CME Group Inc. | 0,03 | 0,19 | 9,48 | 0,62 | 0,7667 | -0,0425 | |||
| ETN / Eaton Corporation plc | 0,02 | 0,15 | 9,47 | 30,88 | 0,7665 | 0,1445 | |||
| MRK / Merck & Co., Inc. | 0,12 | 0,29 | 9,27 | -8,04 | 0,7498 | -0,1161 | |||
| PGR / The Progressive Corporation | 0,04 | 0,28 | 9,23 | -13,86 | 0,7469 | -0,1739 | |||
| AMGN / Amgen Inc. | 0,03 | 0,29 | 8,93 | 1,73 | 0,7224 | -0,0318 | |||
| PM / Philip Morris International Inc. | 0,05 | 0,30 | 8,88 | -3,98 | 0,7184 | -0,0762 | |||
| AKAM / Akamai Technologies, Inc. | 0,12 | 0,27 | 8,82 | -5,04 | 0,7139 | -0,0845 | |||
| TJX / The TJX Companies, Inc. | 0,07 | 0,24 | 8,59 | -2,98 | 0,6949 | -0,0658 | |||
| KO / The Coca-Cola Company | 0,13 | 0,31 | 8,58 | -6,13 | 0,6939 | -0,0912 | |||
| FOXA / Fox Corporation | 0,15 | 0,28 | 8,55 | 12,30 | 0,6916 | 0,0376 | |||
| TMO / Thermo Fisher Scientific Inc. | 0,02 | 0,27 | 8,47 | 9,32 | 0,6855 | 0,0195 | |||
| CB / Chubb Limited | 0,03 | 0,22 | 8,34 | -6,80 | 0,6752 | -0,0942 | |||
| HON / Honeywell International Inc. | 0,04 | 0,23 | 8,19 | 5,88 | 0,6630 | -0,0020 | |||
| TRV / The Travelers Companies, Inc. | 0,03 | 0,27 | 7,98 | -1,20 | 0,6459 | -0,0484 | |||
| ORLY / O'Reilly Automotive, Inc. | 0,08 | 1.393,38 | 7,97 | 3,75 | 0,6445 | -0,0152 | |||
| VRTX / Vertex Pharmaceuticals Incorporated | 0,02 | 0,27 | 7,91 | -10,09 | 0,6401 | -0,1160 | |||
| NOC / Northrop Grumman Corporation | 0,01 | 0,10 | 7,90 | 18,64 | 0,6391 | 0,0670 | |||
| CBOE / Cboe Global Markets, Inc. | 0,03 | 0,23 | 7,89 | 8,91 | 0,6387 | 0,0159 | |||
| GD / General Dynamics Corporation | 0,03 | 0,27 | 7,85 | 14,83 | 0,6353 | 0,0477 | |||
| ADP / Automatic Data Processing, Inc. | 0,03 | 0,23 | 7,82 | 3,19 | 0,6325 | -0,0184 | |||
| LHX / L3Harris Technologies, Inc. | 0,03 | 0,24 | 7,80 | 25,22 | 0,6311 | 0,0958 | |||
| MMC / Marsh & McLennan Companies, Inc. | 0,04 | 0,20 | 7,72 | -11,47 | 0,6246 | -0,1247 | |||
| WRB / W. R. Berkley Corporation | 0,11 | 0,28 | 7,63 | -3,75 | 0,6172 | -0,0638 | |||
| UNH / UnitedHealth Group Incorporated | 0,03 | 0,18 | 7,61 | -39,23 | 0,6156 | -0,4603 | |||
| LOW / Lowe's Companies, Inc. | 0,03 | 0,24 | 7,58 | 0,24 | 0,6135 | -0,0365 | |||
| NKE / NIKE, Inc. | 0,10 | 0,31 | 7,53 | 32,85 | 0,6093 | 0,1222 | |||
| UNP / Union Pacific Corporation | 0,03 | 0,27 | 7,51 | 3,20 | 0,6077 | -0,0176 | |||
| FAST / Fastenal Company | 0,16 | 100,56 | 7,51 | 14,26 | 0,6075 | 0,0429 | |||
| CVX / Chevron Corporation | 0,05 | 0,30 | 7,50 | 11,79 | 0,6069 | 0,0303 | |||
| AZO / AutoZone, Inc. | 0,00 | 0,15 | 7,45 | 0,31 | 0,6028 | -0,0354 | |||
| AJG / Arthur J. Gallagher & Co. | 0,03 | 0,19 | 7,31 | -10,26 | 0,5918 | -0,1085 | |||
| WM / Waste Management, Inc. | 0,03 | 0,20 | 6,98 | -1,61 | 0,5648 | -0,0448 | |||
| LMT / Lockheed Martin Corporation | 0,02 | 0,18 | 6,66 | -11,72 | 0,5393 | -0,1095 | |||
| PEP / PepsiCo, Inc. | 0,05 | 0,24 | 6,63 | 1,97 | 0,5368 | -0,0223 | |||
| SBUX / Starbucks Corporation | 0,07 | 0,27 | 6,63 | 11,67 | 0,5365 | 0,0263 | |||
| TSCO / Tractor Supply Company | 0,12 | 0,27 | 6,61 | 12,80 | 0,5348 | 0,0313 | |||
| ITW / Illinois Tool Works Inc. | 0,03 | 0,18 | 6,59 | 6,87 | 0,5335 | 0,0034 | |||
| JKHY / Jack Henry & Associates, Inc. | 0,04 | 0,20 | 6,51 | -1,88 | 0,5266 | -0,0434 | |||
| GRMN / Garmin Ltd. | 0,03 | 0,17 | 6,33 | 17,26 | 0,5118 | 0,0483 | |||
| RSG / Republic Services, Inc. | 0,03 | 0,16 | 6,31 | -7,87 | 0,5105 | -0,0779 | |||
| LIN / Linde plc | 0,01 | 0,04 | 6,27 | 1,59 | 0,5075 | -0,0230 | |||
| PAYX / Paychex, Inc. | 0,04 | 0,26 | 5,85 | -1,65 | 0,4735 | -0,0378 | |||
| FDS / FactSet Research Systems Inc. | 0,01 | 0,09 | 5,79 | -6,71 | 0,4684 | -0,0648 | |||
| AIZ / Assurant, Inc. | 0,03 | 0,28 | 5,74 | -2,54 | 0,4648 | -0,0418 | |||
| VRSK / Verisk Analytics, Inc. | 0,02 | 0,27 | 5,70 | -5,72 | 0,4611 | -0,0583 | |||
| REGN / Regeneron Pharmaceuticals, Inc. | 0,01 | 0,19 | 5,61 | -8,72 | 0,4539 | -0,0743 | |||
| FI / Fiserv, Inc. | 0,04 | 0,20 | 5,55 | -24,58 | 0,4490 | -0,1832 | |||
| SO / The Southern Company | 0,06 | 0,31 | 5,45 | 3,14 | 0,4409 | -0,0131 | |||
| OTIS / Otis Worldwide Corporation | 0,06 | 0,24 | 5,34 | -10,77 | 0,4319 | -0,0822 | |||
| BDX / Becton, Dickinson and Company | 0,03 | 0,20 | 5,29 | -13,76 | 0,4280 | -0,0991 | |||
| DUK / Duke Energy Corporation | 0,04 | 0,26 | 5,08 | -0,04 | 0,4108 | -0,0257 | |||
| MDLZ / Mondelez International, Inc. | 0,08 | 0,29 | 4,90 | -4,76 | 0,3967 | -0,0457 | |||
| COP / ConocoPhillips | 0,05 | 0,27 | 4,61 | 7,28 | 0,3733 | 0,0037 | |||
| BAH / Booz Allen Hamilton Holding Corporation | 0,04 | 0,31 | 4,51 | -10,31 | 0,3647 | -0,0671 | |||
| FCN / FTI Consulting, Inc. | 0,03 | 0,23 | 4,46 | 0,27 | 0,3610 | -0,0214 | |||
| CL / Colgate-Palmolive Company | 0,05 | 0,27 | 4,09 | -8,81 | 0,3308 | -0,0544 | |||
| HSY / The Hershey Company | 0,02 | 0,25 | 4,03 | 11,62 | 0,3263 | 0,0158 | |||
| XEL / Xcel Energy Inc. | 0,05 | 0,24 | 4,00 | 4,14 | 0,3233 | -0,0064 | |||
| ED / Consolidated Edison, Inc. | 0,04 | 0,21 | 3,85 | -8,01 | 0,3112 | -0,0481 | |||
| WEC / WEC Energy Group, Inc. | 0,04 | 0,22 | 3,83 | -0,18 | 0,3100 | -0,0198 | |||
| WMB / The Williams Companies, Inc. | 0,06 | 0,30 | 3,74 | 2,66 | 0,3028 | -0,0104 | |||
| AMT / American Tower Corporation | 0,02 | 0,23 | 3,62 | -7,36 | 0,2926 | -0,0427 | |||
| CMS / CMS Energy Corporation | 0,05 | 0,23 | 3,62 | 0,44 | 0,2925 | -0,0168 | |||
| AEE / Ameren Corporation | 0,04 | 0,30 | 3,57 | 2,23 | 0,2890 | -0,0113 | |||
| US31635A3032 / Fidelity Securities Lending Cash Central Fund | 3,50 | 8,27 | 3,50 | 8,29 | 0,2831 | 0,0054 | |||
| KMB / Kimberly-Clark Corporation | 0,03 | 0,21 | 3,50 | -5,23 | 0,2829 | -0,0341 | |||
| EOG / EOG Resources, Inc. | 0,03 | 0,21 | 3,39 | 8,98 | 0,2740 | 0,0071 | |||
| PLD / Prologis, Inc. | 0,03 | 0,27 | 3,36 | 4,77 | 0,2718 | -0,0037 | |||
| KMI / Kinder Morgan, Inc. | 0,12 | 0,28 | 3,25 | 7,00 | 0,2633 | 0,0019 | |||
| SHW / The Sherwin-Williams Company | 0,01 | 0,08 | 3,04 | -6,18 | 0,2456 | -0,0324 | |||
| ECL / Ecolab Inc. | 0,01 | 0,12 | 3,02 | 4,25 | 0,2443 | -0,0046 | |||
| GIS / General Mills, Inc. | 0,06 | 0,29 | 2,80 | -13,43 | 0,2269 | -0,0514 | |||
| CTVA / Corteva, Inc. | 0,04 | 0,22 | 2,79 | 16,59 | 0,2258 | 0,0202 | |||
| EQIX / Equinix, Inc. | 0,00 | 0,28 | 2,78 | -8,50 | 0,2247 | -0,0362 | |||
| APD / Air Products and Chemicals, Inc. | 0,01 | -0,18 | 2,70 | 6,02 | 0,2182 | -0,0004 | |||
| DLR / Digital Realty Trust, Inc. | 0,01 | 0,11 | 2,63 | 10,02 | 0,2125 | 0,0074 | |||
| CCI / Crown Castle Inc. | 0,02 | 0,18 | 2,58 | -0,42 | 0,2088 | -0,0140 | |||
| CSGP / CoStar Group, Inc. | 0,03 | 0,25 | 2,51 | 28,69 | 0,2033 | 0,0355 | |||
| O / Realty Income Corporation | 0,04 | 0,32 | 2,47 | -2,68 | 0,1995 | -0,0182 | |||
| VMC / Vulcan Materials Company | 0,01 | 0,05 | 2,31 | 4,77 | 0,1867 | -0,0026 | |||
| DTM / DT Midstream, Inc. | 0,02 | 0,29 | 2,26 | 6,01 | 0,1828 | -0,0004 | |||
| US31635A1051 / Fidelity Cash Central Fund | 2,19 | 17,44 | 2,19 | 17,45 | 0,1770 | 0,0169 | |||
| COG / Cabot Oil & Gas Corp. | 0,09 | 0,26 | 2,17 | -0,46 | 0,1755 | -0,0117 | |||
| PSA / Public Storage | 0,01 | 0,19 | 2,15 | -9,32 | 0,1741 | -0,0298 | |||
| PKG / Packaging Corporation of America | 0,01 | 0,09 | 1,78 | 4,47 | 0,1437 | -0,0024 | |||
| ATR / AptarGroup, Inc. | 0,01 | 0,21 | 1,74 | 5,02 | 0,1406 | -0,0016 | |||
| AVB / AvalonBay Communities, Inc. | 0,01 | 0,13 | 1,70 | -11,16 | 0,1378 | -0,0270 | |||
| AMCR / Amcor plc | 0,18 | 0,29 | 1,69 | 1,94 | 0,1363 | -0,0057 | |||
| AVY / Avery Dennison Corporation | 0,01 | 0,08 | 1,68 | -1,82 | 0,1355 | -0,0112 | |||
| AMH / American Homes 4 Rent | 0,05 | 0,27 | 1,58 | -6,99 | 0,1282 | -0,0182 | |||
| ADC / Agree Realty Corporation | 0,02 | 0,20 | 1,50 | -7,46 | 0,1215 | -0,0179 | |||
| ELS / Equity LifeStyle Properties, Inc. | 0,02 | 0,26 | 1,49 | -7,24 | 0,1202 | -0,0175 | |||
| UST BILLS 0% 08/21/2025 / DBT (US912797PP64) | 0,19 | 0,0157 | 0,0157 | ||||||
| SP500 MIC EMIN FUTSEP25 HWAU5 / DE (N/A) | 0,09 | 0,0076 | 0,0076 |