Testing Laboratories - Insider Trading Data
Insiders are officers, directors, or significant investors. This page shows insider sentiment and transactions for the Testing industry. Research shows that insider trades are predictive of future stock returns. By examining insider trades for an industry, we can understand what well-informed people think of the overall future industry prospects.
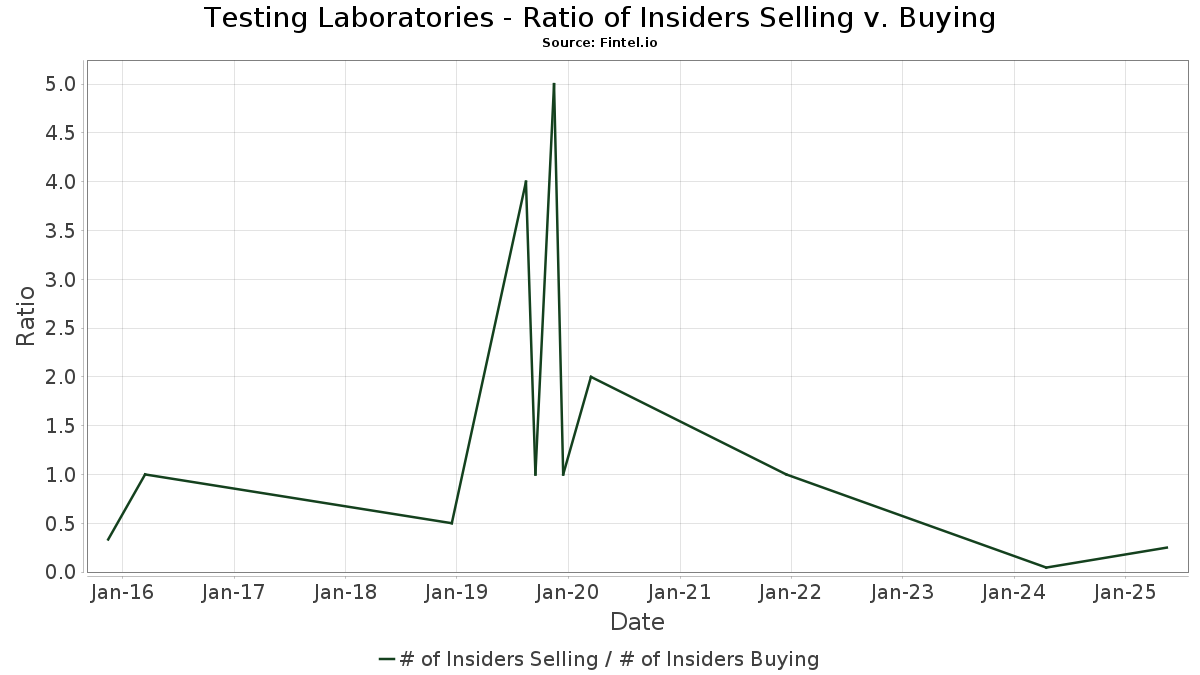
Testing Laboratories - Insider Buy/Sell Ratio
Insider selling and buying is a useful indicator for analyzing the market because it serves as a proxy for their optimism or pessimism in their own companies. By looking at ratio of total selling and buying across the entire market, we might be able to draw some conclusions about the future market.
We offer two charts here. The first one shows the total dollar volume of buying and selling by insiders. The second chart shows the ratio of the number of insiders selling, vs. the number of insiders buying. In both charts, we filter out trades made by indirect holders (such as trusts), and 10% owners (who, although considered an 'insider' by the SEC, do not actually manage the companies in which they are considered insiders).
Testing Laboratories - Transaction History
Click the link icon to see the full transaction history. Transactions reported as part of a 10b5-1 automatic trading plan will have an X in the column marked 10b-5.
| Tran Date |
Security | Form | Insider | Code | Direct | Share Price |
Shares Changed |
|
|---|---|---|---|---|---|---|---|---|
| 2019-02-28 | NEO / NeoGenomics, Inc. | 4 | BALLIET JENNIFER | D | 8.03 | 10,000 | ||
| 2019-02-28 | NEO / NeoGenomics, Inc. | 4 | BALLIET JENNIFER | D | -20,000 | |||
| 2019-02-28 | NEO / NeoGenomics, Inc. | 4 | BALLIET JENNIFER | D | 19.57 | -30,000 | ||
| 2019-02-27 | NEO / NeoGenomics, Inc. | 4 | CARDOZA GEORGE | D | 3.45 | -30,000 | ||
| 2019-02-27 | NEO / NeoGenomics, Inc. | 4 | CARDOZA GEORGE | D | 3.45 | 30,000 | ||
| 2019-02-27 | NEO / NeoGenomics, Inc. | 4 | JONES STEVEN C By Aspen Select Opportunity Fund | I | 18.90 | -252,881 | ||
| 2019-02-27 | NEO / NeoGenomics, Inc. | 4 | JONES STEVEN C By self as Trustee for Steven and Carisa Jones 401k and Trust | I | 18.78 | -32,371 | ||
| 2019-02-27 | NEO / NeoGenomics, Inc. | 4 | SHOVLIN ROBERT J. | D | 19.23 | -44,135 | ||
| 2019-02-26 | NEO / NeoGenomics, Inc. | 4 | SHOVLIN ROBERT J. | D | -119,348 | |||
| 2019-02-26 | NEO / NeoGenomics, Inc. | 4 | Bonello William | D | 7.52 | 20,037 | ||
| 2019-02-26 | NEO / NeoGenomics, Inc. | 4 | Bonello William | D | 8.03 | 40,166 | ||
| 2019-02-26 | NEO / NeoGenomics, Inc. | 4 | Bonello William | D | -40,166 | |||
| 2019-02-26 | NEO / NeoGenomics, Inc. | 4 | SHOVLIN ROBERT J. | D | 7.15 | 119,348 | ||
| 2019-02-26 | NEO / NeoGenomics, Inc. | 4 | SHOVLIN ROBERT J. | D | -66,666 | |||
| 2019-02-26 | NEO / NeoGenomics, Inc. | 4 | SHOVLIN ROBERT J. | D | 7.52 | 66,666 | ||
| 2019-02-26 | NEO / NeoGenomics, Inc. | 4 | Bonello William | D | -20,037 | |||
| 2019-02-26 | NEO / NeoGenomics, Inc. | 4 | HIPP RAYMOND R | D | 4.78 | 10,000 | ||
| 2019-02-26 | NEO / NeoGenomics, Inc. | 4 | HIPP RAYMOND R | D | -10,000 | |||
| 2019-02-26 | NEO / NeoGenomics, Inc. | 4 | HIPP RAYMOND R | D | -5,556 | |||
| 2019-02-26 | NEO / NeoGenomics, Inc. | 4 | HIPP RAYMOND R | D | -3,333 | |||
| 2019-02-26 | NEO / NeoGenomics, Inc. | 4 | HIPP RAYMOND R | D | 9.11 | 5,556 | ||
| 2019-02-26 | NEO / NeoGenomics, Inc. | 4 | HIPP RAYMOND R | D | 7.27 | 3,333 | ||
| 2019-02-26 | NEO / NeoGenomics, Inc. | 4 | JONES STEVEN C By Aspen Select Opportunity Fund | I | 19.24 | -11,721 | ||
| 2019-02-26 | NEO / NeoGenomics, Inc. | 4 | HIPP RAYMOND R | D | 18.90 | -18,889 | ||
| 2019-02-26 | NEO / NeoGenomics, Inc. | 4 | JONES STEVEN C By self as Trustee for Steven and Carisa Jones 401k and Trust | I | 19.27 | -1,900 | ||
| 2019-02-26 | NEO / NeoGenomics, Inc. | 4 | SHOVLIN ROBERT J. | D | 18.88 | -141,879 | ||
| 2019-02-26 | NEO / NeoGenomics, Inc. | 4 | JONES STEVEN C Shares owned in IRA, custodian accounts, and trusts for the family of Steven Jones | I | 19.24 | -1,000 | ||
| 2019-02-26 | NEO / NeoGenomics, Inc. | 4 | Bonello William | D | 18.90 | -60,203 | ||
| 2019-01-24 | APDN / Applied DNA Sciences, Inc. | 4 | Montgomery William W | D | 0.4749 | 50,000 | ||
| 2019-01-23 | APDN / Applied DNA Sciences, Inc. | 4 | Montgomery William W | D | 0.4611 | 90,000 | ||
| 2019-01-22 | APDN / Applied DNA Sciences, Inc. | 4 | Montgomery William W | D | 0.4435 | 60,000 | ||
| 2019-01-18 | APDN / Applied DNA Sciences, Inc. | 4 | Montgomery William W | D | 0.4448 | 100,000 | ||
| 2019-01-07 | DIGP / Hypha Labs, Inc. | 4 | Peterson Todd A | D | -100,000 | |||
| 2019-01-07 | DIGP / Hypha Labs, Inc. | 4 | Denkin Todd | D | -2,500,000 | |||
| 2019-01-07 | DIGP / Hypha Labs, Inc. | 4 | Orser Cindy Sue | D | -100,000 | |||
| 2019-01-07 | DIGP / Hypha Labs, Inc. | 4 | Denkin Todd | D | -500,000 | |||
| 2019-01-07 | DIGP / Hypha Labs, Inc. | 4 | Orser Cindy Sue | D | -200,000 | |||
| 2019-01-07 | DIGP / Hypha Labs, Inc. | 4 | Orser Cindy Sue | D | 200,000 | |||
| 2019-01-07 | DIGP / Hypha Labs, Inc. | 4 | Denkin Todd | D | 2,500,000 | |||
| 2019-01-07 | DIGP / Hypha Labs, Inc. | 4 | Denkin Todd | D | 500,000 | |||
| 2019-01-07 | DIGP / Hypha Labs, Inc. | 4 | Orser Cindy Sue | D | 500,000 | |||
| 2019-01-07 | DIGP / Hypha Labs, Inc. | 4 | Orser Cindy Sue | D | 100,000 | |||
| 2019-01-07 | DIGP / Hypha Labs, Inc. | 4 | Peterson Todd A | D | 100,000 | |||
| 2019-01-07 | DIGP / Hypha Labs, Inc. | 4 | RABEN BRUCE I | D | 500,000 | |||
| 2019-01-07 | APDN / Applied DNA Sciences, Inc. | 4 | Montgomery William W | D | 0.4657 | 216,000 | ||
| 2019-01-03 | APDN / Applied DNA Sciences, Inc. | 4 | Montgomery William W | D | 0.4354 | 154,000 | ||
| 2018-12-31 | APDN / Applied DNA Sciences, Inc. | 4 | Montgomery William W | D | 0.3713 | 30,000 | ||
| 2018-12-25 | DIGP / Hypha Labs, Inc. | 4 | Peterson Todd A | D | 115,652 | |||
| 2018-12-25 | DIGP / Hypha Labs, Inc. | 4 | Denkin Todd | D | 46,261 | |||
| 2018-12-21 | NEO / NeoGenomics, Inc. | 4 | Johnson Kevin C | D | 11.60 | 26,000 |