Grundlæggende statistik
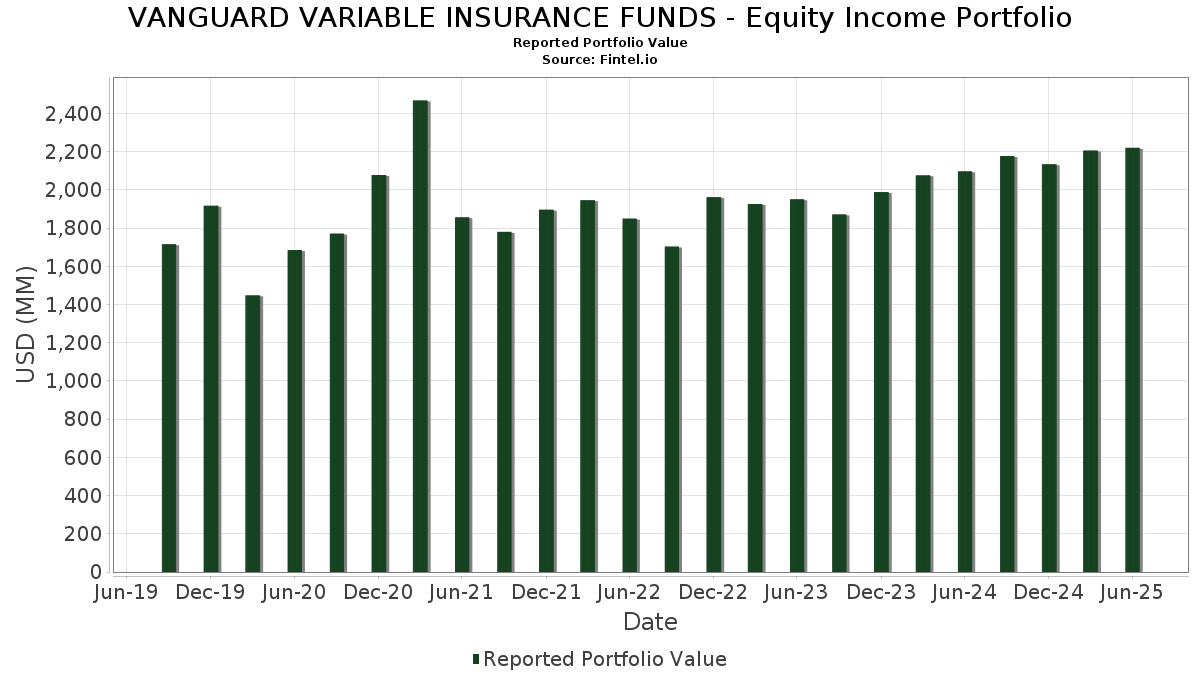
| Porteføljeværdi | $ 2.219.443.542 |
| Nuværende stillinger | 180 |
Seneste beholdninger, ydeevne, AUM (fra 13F, 13D)
VANGUARD VARIABLE INSURANCE FUNDS - Equity Income Portfolio har afsløret 180 samlede besiddelser i deres seneste SEC-arkivering. Den seneste porteføljeværdi er beregnet til at være $ 2.219.443.542 USD. Faktiske aktiver under forvaltning (AUM) er denne værdi plus kontanter (som ikke er oplyst). VANGUARD VARIABLE INSURANCE FUNDS - Equity Income Portfolios største beholdninger er Broadcom Inc. (US:AVGO) , JPMorgan Chase & Co. (US:JPM) , Bank of America Corporation (US:BAC) , Johnson & Johnson (US:JNJ) , and UnitedHealth Group Incorporated (US:UNH) . VANGUARD VARIABLE INSURANCE FUNDS - Equity Income Portfolios nye stillinger omfatter Avery Dennison Corporation (US:AVY) , Ferguson Enterprises Inc. (US:FERG) , Otis Worldwide Corporation (US:OTIS) , NewMarket Corporation (US:NEU) , and Nexstar Media Group, Inc. (US:NXST) .
Top øger dette kvartal
Vi bruger ændringen i porteføljeallokeringen, fordi dette er den mest meningsfulde metrik. Ændringer kan skyldes handler eller ændringer i aktiekurser.
| Sikkerhed | Aktier (MM) |
Værdi (MM$) |
Portefølje % | ΔPortefølje % |
|---|---|---|---|---|
| 38,27 | 38,27 | 1,7186 | 1,7186 | |
| 0,43 | 118,03 | 5,3005 | 1,6401 | |
| 17,70 | 0,7949 | 0,7949 | ||
| 0,10 | 17,29 | 0,7763 | 0,7763 | |
| 0,48 | 14,28 | 0,6415 | 0,6415 | |
| 0,06 | 14,03 | 0,6302 | 0,6302 | |
| 0,06 | 12,67 | 0,5691 | 0,5691 | |
| 0,19 | 20,05 | 0,9005 | 0,5688 | |
| 0,09 | 28,22 | 1,2672 | 0,3727 | |
| 1,33 | 62,87 | 2,8234 | 0,3715 |
Top falder i dette kvartal
Vi bruger ændringen i porteføljeallokeringen, fordi dette er den mest meningsfulde metrik. Ændringer kan skyldes handler eller ændringer i aktiekurser.
| Sikkerhed | Aktier (MM) |
Værdi (MM$) |
Portefølje % | ΔPortefølje % |
|---|---|---|---|---|
| 0,17 | 52,89 | 2,3750 | -0,9924 | |
| 0,10 | 16,12 | 0,7237 | -0,7271 | |
| 0,93 | 22,43 | 1,0072 | -0,4032 | |
| 0,38 | 57,67 | 2,5897 | -0,3859 | |
| 0,50 | 44,65 | 2,0051 | -0,3527 | |
| 0,00 | 0,17 | 0,0076 | -0,2994 | |
| 0,04 | 7,08 | 0,3181 | -0,2854 | |
| 0,64 | 50,35 | 2,2610 | -0,2790 | |
| 0,25 | 26,37 | 1,1844 | -0,2671 | |
| 0,63 | 13,15 | 0,5903 | -0,2239 |
13F og Fondsarkivering
Denne formular blev indsendt den 2025-08-27 for rapporteringsperioden 2025-06-30. Klik på linkikonet for at se den fulde transaktionshistorik.
Opgrader for at låse op for premium-data og eksportere til Excel ![]() .
.
| Sikkerhed | Type | Gennemsnitlig aktiekurs | Aktier (MM) |
Δ Aktier (%) |
Δ Aktier (%) |
Værdi ($MM) |
Portefølje (%) |
ΔPortefølje (%) |
|
|---|---|---|---|---|---|---|---|---|---|
| AVGO / Broadcom Inc. | 0,43 | -9,32 | 118,03 | 49,29 | 5,3005 | 1,6401 | |||
| JPM / JPMorgan Chase & Co. | 0,29 | -13,07 | 83,25 | 2,74 | 3,7387 | -0,0131 | |||
| BAC / Bank of America Corporation | 1,33 | 4,69 | 62,87 | 18,72 | 2,8234 | 0,3715 | |||
| JNJ / Johnson & Johnson | 0,38 | -2,58 | 57,67 | -10,27 | 2,5897 | -0,3859 | |||
| UNH / UnitedHealth Group Incorporated | 0,17 | 22,07 | 52,89 | -27,29 | 2,3750 | -0,9924 | |||
| MRK / Merck & Co., Inc. | 0,64 | 4,06 | 50,35 | -8,23 | 2,2610 | -0,2790 | |||
| COP / ConocoPhillips | 0,50 | 2,60 | 44,65 | -12,33 | 2,0051 | -0,3527 | |||
| Vanguard Market Liquidity Fund / STIV (N/A) | 38,27 | 38,27 | 1,7186 | 1,7186 | |||||
| CSCO / Cisco Systems, Inc. | 0,55 | -13,14 | 38,23 | -2,34 | 1,7170 | -0,0956 | |||
| GILD / Gilead Sciences, Inc. | 0,34 | 4,62 | 37,98 | 3,52 | 1,7055 | 0,0070 | |||
| PM / Philip Morris International Inc. | 0,16 | -8,04 | 29,64 | 5,52 | 1,3310 | 0,0306 | |||
| HON / Honeywell International Inc. | 0,12 | 8,31 | 28,75 | 19,12 | 1,2910 | 0,1736 | |||
| ACN / Accenture plc | 0,09 | 52,48 | 28,22 | 46,06 | 1,2672 | 0,3727 | |||
| PCAR / PACCAR Inc | 0,29 | 10,94 | 27,74 | 8,31 | 1,2457 | 0,0600 | |||
| ELV / Elevance Health, Inc. | 0,07 | 29,74 | 26,81 | 16,02 | 1,2038 | 0,1341 | |||
| AIG / American International Group, Inc. | 0,31 | -4,98 | 26,63 | -6,45 | 1,1957 | -0,1221 | |||
| AEP / American Electric Power Company, Inc. | 0,25 | -11,41 | 26,37 | -15,88 | 1,1844 | -0,2671 | |||
| UL / Unilever PLC - Depositary Receipt (Common Stock) | 0,43 | 20,53 | 26,37 | 23,81 | 1,1843 | 0,1981 | |||
| MTB / M&T Bank Corporation | 0,13 | 2,76 | 24,99 | 11,52 | 1,1223 | 0,0848 | |||
| NXPI / NXP Semiconductors N.V. | 0,11 | -0,55 | 24,48 | 14,33 | 1,0995 | 0,1080 | |||
| SRE / Sempra | 0,32 | 11,11 | 23,87 | 17,97 | 1,0722 | 0,1352 | |||
| EQT / EQT Corporation | 0,41 | -10,23 | 23,69 | -2,01 | 1,0638 | -0,0555 | |||
| CTRA / Coterra Energy Inc. | 0,91 | 3,07 | 23,13 | -9,48 | 1,0385 | -0,1444 | |||
| EMR / Emerson Electric Co. | 0,17 | -0,86 | 23,06 | 20,57 | 1,0356 | 0,1501 | |||
| MS / Morgan Stanley | 0,16 | -4,39 | 22,50 | 15,44 | 1,0105 | 0,1080 | |||
| PFE / Pfizer Inc. | 0,93 | -23,03 | 22,43 | -26,37 | 1,0072 | -0,4032 | |||
| D / Dominion Energy, Inc. | 0,39 | 53,80 | 22,12 | 55,03 | 0,9935 | 0,3328 | |||
| MPC / Marathon Petroleum Corporation | 0,13 | -4,54 | 22,10 | 8,85 | 0,9924 | 0,0524 | |||
| LHX / L3Harris Technologies, Inc. | 0,09 | -10,76 | 22,02 | 6,94 | 0,9889 | 0,0356 | |||
| PPG / PPG Industries, Inc. | 0,19 | 14,32 | 21,79 | 18,93 | 0,9786 | 0,1302 | |||
| ADM / Archer-Daniels-Midland Company | 0,41 | -18,24 | 21,62 | -10,12 | 0,9710 | -0,1428 | |||
| CCI / Crown Castle Inc. | 0,21 | 5,63 | 21,15 | 4,11 | 0,9496 | 0,0092 | |||
| TRGP / Targa Resources Corp. | 0,12 | 80,28 | 21,09 | 56,55 | 0,9473 | 0,3234 | |||
| KDP / Keurig Dr Pepper Inc. | 0,63 | 14,85 | 20,81 | 10,95 | 0,9345 | 0,0662 | |||
| RF / Regions Financial Corporation | 0,88 | -3,85 | 20,60 | 4,07 | 0,9249 | 0,0086 | |||
| WMT / Walmart Inc. | 0,21 | 15,61 | 20,28 | 28,76 | 0,9110 | 0,1816 | |||
| CNI / Canadian National Railway Company | 0,19 | 161,40 | 20,05 | 179,92 | 0,9005 | 0,5688 | |||
| TEL / TE Connectivity plc | 0,12 | -13,34 | 20,01 | 3,43 | 0,8986 | 0,0029 | |||
| NDAQ / Nasdaq, Inc. | 0,22 | -3,21 | 19,96 | 14,09 | 0,8965 | 0,0864 | |||
| MET / MetLife, Inc. | 0,24 | -5,19 | 19,52 | -5,04 | 0,8767 | -0,0750 | |||
| PPL / PPL Corporation | 0,55 | -3,80 | 18,54 | -9,72 | 0,8327 | -0,1182 | |||
| NOC / Northrop Grumman Corporation | 0,04 | 15,83 | 18,43 | 13,11 | 0,8278 | 0,0733 | |||
| B / Barrick Mining Corporation | 0,88 | 0,51 | 18,36 | 7,65 | 0,8245 | 0,0348 | |||
| RJF / Raymond James Financial, Inc. | 0,12 | -3,73 | 17,81 | 6,29 | 0,7997 | 0,0240 | |||
| FR001400F0V4 / BNP Paribas SA | 17,70 | 0,7949 | 0,7949 | ||||||
| IDEXY / Industria de Diseño Textil, S.A. - Depositary Receipt (Common Stock) | 0,34 | 21,12 | 17,62 | 26,90 | 0,7911 | 0,1484 | |||
| AVY / Avery Dennison Corporation | 0,10 | 17,29 | 0,7763 | 0,7763 | |||||
| ATO / Atmos Energy Corporation | 0,11 | -9,30 | 17,19 | -9,58 | 0,7718 | -0,1082 | |||
| AZN / AstraZeneca PLC - Depositary Receipt (Common Stock) | 0,24 | 16,74 | 16,66 | 10,99 | 0,7480 | 0,0532 | |||
| PG / The Procter & Gamble Company | 0,10 | -44,99 | 16,12 | -48,57 | 0,7237 | -0,7271 | |||
| ICE / Intercontinental Exchange, Inc. | 0,09 | -6,08 | 15,60 | -0,11 | 0,7006 | -0,0225 | |||
| JCI / Johnson Controls International plc | 0,15 | -19,44 | 15,49 | 6,22 | 0,6954 | 0,0204 | |||
| RHHBY / Roche Holding AG - Depositary Receipt (Common Stock) | 0,05 | 9,14 | 15,24 | 8,24 | 0,6845 | 0,0325 | |||
| WFC / Wells Fargo & Company | 0,19 | -0,63 | 14,94 | 10,90 | 0,6707 | 0,0472 | |||
| STZ / Constellation Brands, Inc. | 0,09 | 56,49 | 14,88 | 38,72 | 0,6683 | 0,1716 | |||
| RI / Pernod Ricard SA | 0,15 | -3,07 | 14,87 | -2,13 | 0,6677 | -0,0356 | |||
| XOM / Exxon Mobil Corporation | 0,14 | 0,00 | 14,59 | -9,36 | 0,6553 | -0,0900 | |||
| AAL / Anglo American plc | 0,48 | 14,28 | 0,6415 | 0,6415 | |||||
| WEC / WEC Energy Group, Inc. | 0,14 | 5,88 | 14,07 | 1,23 | 0,6318 | -0,0116 | |||
| ARES / Ares Management Corporation | 0,08 | -19,62 | 14,07 | -5,04 | 0,6318 | -0,0541 | |||
| DRI / Darden Restaurants, Inc. | 0,06 | 14,03 | 0,6302 | 0,6302 | |||||
| MMC / Marsh & McLennan Companies, Inc. | 0,06 | 52,61 | 13,94 | 36,74 | 0,6260 | 0,1540 | |||
| WY / Weyerhaeuser Company | 0,54 | -3,29 | 13,89 | -15,15 | 0,6239 | -0,1342 | |||
| IEX / IDEX Corporation | 0,08 | 19,71 | 13,48 | 16,14 | 0,6054 | 0,0680 | |||
| TMUS / T-Mobile US, Inc. | 0,06 | -15,36 | 13,22 | -24,39 | 0,5937 | -0,2158 | |||
| KVUE / Kenvue Inc. | 0,63 | -14,36 | 13,15 | -25,25 | 0,5903 | -0,2239 | |||
| TSCO / Tractor Supply Company | 0,25 | -10,37 | 12,97 | -14,16 | 0,5824 | -0,1171 | |||
| FERG / Ferguson Enterprises Inc. | 0,06 | 12,67 | 0,5691 | 0,5691 | |||||
| CAT / Caterpillar Inc. | 0,03 | 0,00 | 12,13 | 17,71 | 0,5448 | 0,0676 | |||
| TTE / TotalEnergies SE - Depositary Receipt (Common Stock) | 0,19 | -10,38 | 11,64 | -14,98 | 0,5225 | -0,1111 | |||
| C / Citigroup Inc. | 0,13 | -1,62 | 11,24 | 17,97 | 0,5048 | 0,0636 | |||
| VZ / Verizon Communications Inc. | 0,26 | -1,10 | 11,19 | -5,67 | 0,5025 | -0,0466 | |||
| QCOM / QUALCOMM Incorporated | 0,07 | 0,00 | 11,17 | 3,68 | 0,5016 | 0,0028 | |||
| PEP / PepsiCo, Inc. | 0,08 | 0,76 | 10,60 | -11,27 | 0,4762 | -0,0771 | |||
| NKE / NIKE, Inc. | 0,15 | -8,09 | 10,59 | 2,86 | 0,4757 | -0,0011 | |||
| HD / The Home Depot, Inc. | 0,03 | -12,44 | 10,36 | -12,39 | 0,4654 | -0,0823 | |||
| UNP / Union Pacific Corporation | 0,04 | 0,00 | 9,63 | -2,61 | 0,4324 | -0,0253 | |||
| CMCSA / Comcast Corporation | 0,27 | 0,00 | 9,50 | -3,28 | 0,4265 | -0,0281 | |||
| ABBV / AbbVie Inc. | 0,05 | 0,00 | 9,36 | -11,41 | 0,4204 | -0,0688 | |||
| NEE / NextEra Energy, Inc. | 0,13 | 163,39 | 9,23 | 157,95 | 0,4144 | 0,2488 | |||
| ADP / Automatic Data Processing, Inc. | 0,03 | -2,54 | 9,17 | -1,62 | 0,4119 | -0,0198 | |||
| MO / Altria Group, Inc. | 0,14 | -2,39 | 7,98 | -4,64 | 0,3582 | -0,0291 | |||
| LOW / Lowe's Companies, Inc. | 0,04 | 0,00 | 7,82 | -4,88 | 0,3514 | -0,0294 | |||
| LMT / Lockheed Martin Corporation | 0,02 | 0,00 | 7,67 | 3,68 | 0,3444 | 0,0019 | |||
| CI / The Cigna Group | 0,02 | -5,98 | 7,51 | -5,54 | 0,3371 | -0,0308 | |||
| DUK / Duke Energy Corporation | 0,06 | -7,99 | 7,15 | -10,98 | 0,3211 | -0,0508 | |||
| BMY / Bristol-Myers Squibb Company | 0,15 | 1,69 | 7,09 | -22,83 | 0,3186 | -0,1070 | |||
| PNC / The PNC Financial Services Group, Inc. | 0,04 | -52,08 | 7,08 | -42,55 | 0,3181 | -0,2854 | |||
| KO / The Coca-Cola Company | 0,10 | 0,00 | 6,77 | -1,21 | 0,3039 | -0,0133 | |||
| EOG / EOG Resources, Inc. | 0,05 | 2,29 | 6,51 | -4,59 | 0,2924 | -0,0236 | |||
| GD / General Dynamics Corporation | 0,02 | -5,67 | 6,46 | 0,94 | 0,2901 | -0,0062 | |||
| AFL / Aflac Incorporated | 0,06 | 0,00 | 6,30 | -5,16 | 0,2831 | -0,0246 | |||
| STT / State Street Corporation | 0,06 | -2,11 | 6,07 | 16,27 | 0,2724 | 0,0309 | |||
| AMP / Ameriprise Financial, Inc. | 0,01 | 4,34 | 5,99 | 15,03 | 0,2688 | 0,0279 | |||
| KR / The Kroger Co. | 0,08 | -9,84 | 5,92 | -4,45 | 0,2660 | -0,0210 | |||
| IBM / International Business Machines Corporation | 0,02 | 0,00 | 5,81 | 18,55 | 0,2608 | 0,0340 | |||
| HIG / The Hartford Insurance Group, Inc. | 0,05 | -4,88 | 5,74 | -2,46 | 0,2578 | -0,0147 | |||
| SYF / Synchrony Financial | 0,09 | 0,00 | 5,68 | 26,07 | 0,2552 | 0,0465 | |||
| CMI / Cummins Inc. | 0,02 | 9,77 | 5,65 | 14,71 | 0,2539 | 0,0257 | |||
| CVX / Chevron Corporation | 0,04 | 0,00 | 5,62 | -14,40 | 0,2526 | -0,0516 | |||
| OTIS / Otis Worldwide Corporation | 0,05 | 5,41 | 0,2427 | 0,2427 | |||||
| NTAP / NetApp, Inc. | 0,05 | 51,18 | 5,40 | 83,38 | 0,2424 | 0,1061 | |||
| ABT / Abbott Laboratories | 0,04 | 0,00 | 5,02 | 2,53 | 0,2255 | -0,0012 | |||
| RS / Reliance, Inc. | 0,02 | 0,00 | 4,96 | 8,70 | 0,2227 | 0,0115 | |||
| CVS / CVS Health Corporation | 0,07 | 0,00 | 4,93 | 1,82 | 0,2215 | -0,0028 | |||
| MTG / MGIC Investment Corporation | 0,18 | -4,75 | 4,92 | 7,01 | 0,2207 | 0,0081 | |||
| OSK / Oshkosh Corporation | 0,04 | 4,70 | 4,87 | 26,37 | 0,2187 | 0,0402 | |||
| BPOP / Popular, Inc. | 0,04 | -0,71 | 4,85 | 18,46 | 0,2176 | 0,0282 | |||
| NFG / National Fuel Gas Company | 0,06 | -6,39 | 4,80 | 0,13 | 0,2157 | -0,0064 | |||
| EIX / Edison International | 0,09 | 49,38 | 4,75 | 30,82 | 0,2131 | 0,0452 | |||
| EQH / Equitable Holdings, Inc. | 0,08 | 4,74 | 0,2127 | 0,2127 | |||||
| BBWI / Bath & Body Works, Inc. | 0,16 | 112,94 | 4,69 | 110,46 | 0,2105 | 0,1074 | |||
| EXC / Exelon Corporation | 0,10 | -11,93 | 4,55 | -17,01 | 0,2042 | -0,0495 | |||
| DVN / Devon Energy Corporation | 0,14 | 92,43 | 4,54 | 63,70 | 0,2037 | 0,0754 | |||
| MCD / McDonald's Corporation | 0,02 | 0,00 | 4,50 | -6,47 | 0,2020 | -0,0207 | |||
| DOX / Amdocs Limited | 0,05 | 0,00 | 4,45 | -0,27 | 0,1999 | -0,0068 | |||
| HAL / Halliburton Company | 0,22 | 27,65 | 4,45 | 2,54 | 0,1996 | -0,0011 | |||
| TNL / Travel + Leisure Co. | 0,08 | 0,00 | 4,38 | 11,48 | 0,1966 | 0,0148 | |||
| ESNT / Essent Group Ltd. | 0,07 | 0,00 | 4,36 | 5,21 | 0,1960 | 0,0039 | |||
| MTDR / Matador Resources Company | 0,09 | 18,05 | 4,36 | 10,28 | 0,1956 | 0,0127 | |||
| AGO / Assured Guaranty Ltd. | 0,05 | 0,00 | 4,33 | -1,14 | 0,1946 | -0,0083 | |||
| JXN / Jackson Financial Inc. | 0,05 | 13,81 | 4,32 | 20,61 | 0,1939 | 0,0282 | |||
| OC / Owens Corning | 0,03 | 9,14 | 4,28 | 5,10 | 0,1924 | 0,0036 | |||
| LEA / Lear Corporation | 0,04 | 5,14 | 4,21 | 13,20 | 0,1892 | 0,0169 | |||
| NEU / NewMarket Corporation | 0,01 | 4,17 | 0,1874 | 0,1874 | |||||
| PAG / Penske Automotive Group, Inc. | 0,02 | -1,68 | 4,17 | 17,33 | 0,1873 | 0,0227 | |||
| HWC / Hancock Whitney Corporation | 0,07 | 40,24 | 4,16 | 53,49 | 0,1867 | 0,0613 | |||
| VOYA / Voya Financial, Inc. | 0,06 | 0,00 | 4,14 | 4,78 | 0,1859 | 0,0030 | |||
| CSGS / CSG Systems International, Inc. | 0,06 | 1.441,91 | 3,93 | 1.565,68 | 0,1766 | 0,1656 | |||
| EBAY / eBay Inc. | 0,05 | -36,96 | 3,92 | -30,69 | 0,1761 | -0,0859 | |||
| PHIN / PHINIA Inc. | 0,09 | 0,00 | 3,81 | 4,87 | 0,1713 | 0,0029 | |||
| NOMD / Nomad Foods Limited | 0,22 | -1,55 | 3,80 | -14,87 | 0,1705 | -0,0360 | |||
| NXST / Nexstar Media Group, Inc. | 0,02 | 3,77 | 0,1693 | 0,1693 | |||||
| SLVM / Sylvamo Corporation | 0,07 | 30,93 | 3,75 | -2,19 | 0,1686 | -0,0091 | |||
| PRG / PROG Holdings, Inc. | 0,13 | 209,63 | 3,74 | 241,61 | 0,1682 | 0,1174 | |||
| OVV / Ovintiv Inc. | 0,10 | 0,00 | 3,73 | -11,12 | 0,1674 | -0,0267 | |||
| APOG / Apogee Enterprises, Inc. | 0,09 | 16,34 | 3,73 | 1,94 | 0,1673 | -0,0019 | |||
| FDX / FedEx Corporation | 0,02 | 0,00 | 3,71 | -6,74 | 0,1666 | -0,0176 | |||
| DTE / DTE Energy Company | 0,03 | 0,00 | 3,61 | -4,20 | 0,1619 | -0,0123 | |||
| SLB / Schlumberger Limited | 0,11 | -12,71 | 3,60 | -29,41 | 0,1616 | -0,0744 | |||
| CL / Colgate-Palmolive Company | 0,04 | 0,00 | 3,58 | -2,98 | 0,1607 | -0,0101 | |||
| KLG / WK Kellogg Co | 0,22 | 0,00 | 3,57 | -20,03 | 0,1605 | -0,0464 | |||
| T / AT&T Inc. | 0,12 | 6,69 | 3,53 | 9,20 | 0,1584 | 0,0088 | |||
| FBIN / Fortune Brands Innovations, Inc. | 0,07 | -40,47 | 3,44 | -49,67 | 0,1543 | -0,1617 | |||
| EVRG / Evergy, Inc. | 0,05 | -33,29 | 3,38 | -33,32 | 0,1519 | -0,0829 | |||
| LVS / Las Vegas Sands Corp. | 0,07 | 3,24 | 0,1457 | 0,1457 | |||||
| GS / The Goldman Sachs Group, Inc. | 0,00 | 0,00 | 3,11 | 29,59 | 0,1398 | 0,0286 | |||
| RTX / RTX Corporation | 0,02 | 0,00 | 3,10 | 10,25 | 0,1392 | 0,0090 | |||
| R / Ryder System, Inc. | 0,02 | 50,55 | 3,04 | 66,52 | 0,1365 | 0,0520 | |||
| FDP / Fresh Del Monte Produce Inc. | 0,09 | 119,49 | 2,99 | 130,76 | 0,1345 | 0,0744 | |||
| SYY / Sysco Corporation | 0,03 | 21,97 | 2,64 | 24,52 | 0,1186 | 0,0098 | |||
| NRG / NRG Energy, Inc. | 0,02 | -68,21 | 2,63 | -46,52 | 0,1182 | -0,1097 | |||
| TXN / Texas Instruments Incorporated | 0,01 | -15,21 | 2,52 | -2,02 | 0,1131 | -0,0059 | |||
| CNO / CNO Financial Group, Inc. | 0,06 | 0,00 | 2,34 | -7,38 | 0,1049 | -0,0119 | |||
| AMGN / Amgen Inc. | 0,01 | -12,98 | 2,01 | -22,05 | 0,0901 | -0,0290 | |||
| BLK / BlackRock, Inc. | 0,00 | -6,96 | 1,96 | 3,15 | 0,0882 | 0,0000 | |||
| PGR / The Progressive Corporation | 0,01 | 0,00 | 1,91 | -5,72 | 0,0858 | -0,0080 | |||
| VRTS / Virtus Investment Partners, Inc. | 0,01 | 0,00 | 1,79 | 5,24 | 0,0803 | 0,0016 | |||
| ETN / Eaton Corporation plc | 0,00 | 0,00 | 1,57 | 31,40 | 0,0703 | 0,0151 | |||
| MAS / Masco Corporation | 0,02 | 1,52 | 0,0683 | 0,0683 | |||||
| S&P500 EMINI FUT Sep25 / DE (N/A) | 1,41 | 0,0634 | 0,0634 | ||||||
| BWA / BorgWarner Inc. | 0,04 | 27,09 | 1,22 | 48,42 | 0,0550 | 0,0168 | |||
| CIVI / Civitas Resources, Inc. | 0,04 | 0,00 | 1,19 | -21,09 | 0,0534 | -0,0164 | |||
| RL / Ralph Lauren Corporation | 0,00 | -19,73 | 1,02 | 13,57 | 0,0459 | 0,0046 | |||
| WS / Worthington Steel, Inc. | 0,03 | -43,06 | 0,98 | -32,97 | 0,0440 | -0,0236 | |||
| MDT / Medtronic plc | 0,01 | 0,00 | 0,93 | -3,01 | 0,0419 | -0,0026 | |||
| CB / Chubb Limited | 0,00 | 0,00 | 0,89 | -4,08 | 0,0401 | -0,0030 | |||
| IOSP / Innospec Inc. | 0,01 | 0,88 | 0,0396 | 0,0396 | |||||
| KLIC / Kulicke and Soffa Industries, Inc. | 0,02 | 0,81 | 0,0362 | 0,0362 | |||||
| SIG / Signet Jewelers Limited | 0,01 | 0,78 | 0,0349 | 0,0349 | |||||
| SF / Stifel Financial Corp. | 0,01 | 129,21 | 0,76 | 152,51 | 0,0339 | 0,0201 | |||
| BK / The Bank of New York Mellon Corporation | 0,01 | -15,85 | 0,68 | -8,53 | 0,0304 | -0,0039 | |||
| TOWN / TowneBank | 0,02 | -20,16 | 0,59 | 1,74 | 0,0263 | -0,0074 | |||
| OGN / Organon & Co. | 0,06 | 277,33 | 0,54 | 20,58 | 0,0242 | -0,0004 | |||
| BX / Blackstone Inc. | 0,00 | -36,39 | 0,46 | -31,99 | 0,0205 | -0,0105 | |||
| ORI / Old Republic International Corporation | 0,01 | -92,40 | 0,41 | -86,97 | 0,0185 | -0,1559 | |||
| EBC / Eastern Bankshares, Inc. | 0,01 | 0,19 | 0,0087 | 0,0087 | |||||
| GIS / General Mills, Inc. | 0,00 | 0,00 | 0,19 | -13,08 | 0,0084 | -0,0016 | |||
| SBUX / Starbucks Corporation | 0,00 | -97,27 | 0,17 | -97,47 | 0,0076 | -0,2994 | |||
| Vanguard Market Liquidity Fund / STIV (N/A) | 0,00 | 0,01 | 0,0003 | 0,0003 | |||||
| SJM / Steven Madden, Ltd. | 0,00 | -100,00 | 0,00 | -100,00 | -0,0523 |