Grundlæggende statistik
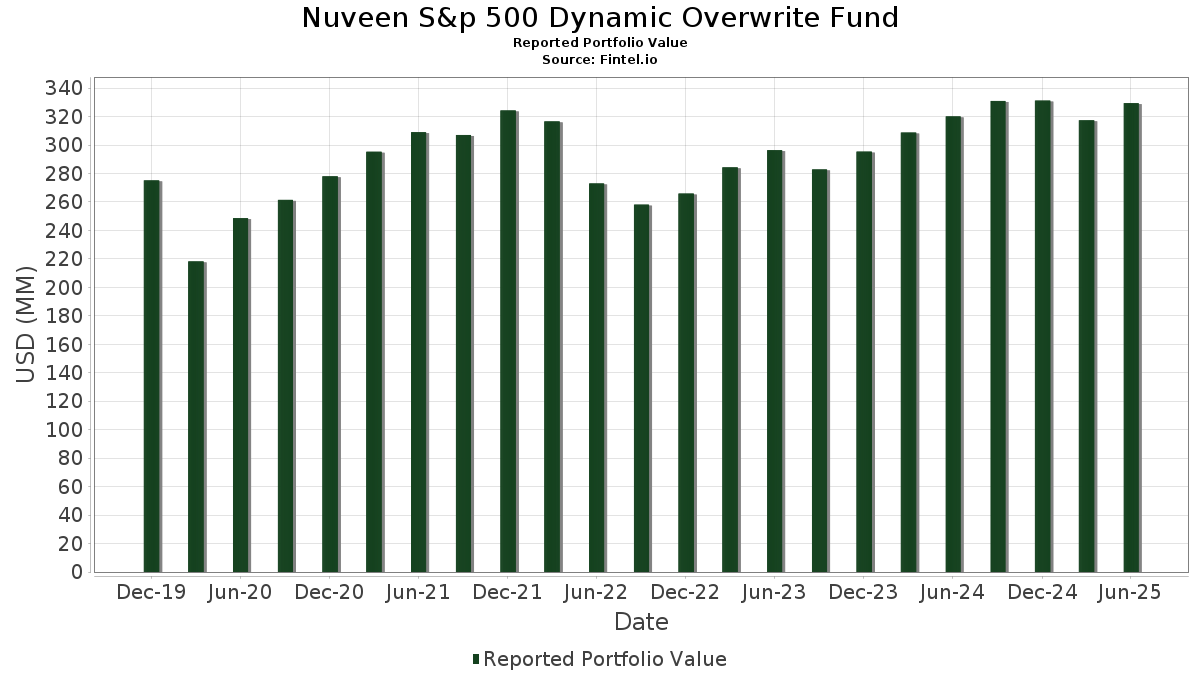
| Porteføljeværdi | $ 329.431.495 |
| Nuværende stillinger | 359 |
Seneste beholdninger, ydeevne, AUM (fra 13F, 13D)
Nuveen S&p 500 Dynamic Overwrite Fund har afsløret 359 samlede besiddelser i deres seneste SEC-arkivering. Den seneste porteføljeværdi er beregnet til at være $ 329.431.495 USD. Faktiske aktiver under forvaltning (AUM) er denne værdi plus kontanter (som ikke er oplyst). Nuveen S&p 500 Dynamic Overwrite Funds største beholdninger er NVIDIA Corporation (US:NVDA) , Microsoft Corporation (US:MSFT) , Apple Inc. (US:AAPL) , Amazon.com, Inc. (US:AMZN) , and Meta Platforms, Inc. (US:META) . Nuveen S&p 500 Dynamic Overwrite Funds nye stillinger omfatter Dreyfus Institutional Preferred Government Plus Money Market Fund (US:US85748R0096) , Amcor plc (US:AMCR) , .
Top øger dette kvartal
Vi bruger ændringen i porteføljeallokeringen, fordi dette er den mest meningsfulde metrik. Ændringer kan skyldes handler eller ændringer i aktiekurser.
| Sikkerhed | Aktier (MM) |
Værdi (MM$) |
Portefølje % | ΔPortefølje % |
|---|---|---|---|---|
| 0,17 | 26,13 | 8,0892 | 2,1929 | |
| 0,02 | 6,53 | 2,0226 | 1,8016 | |
| 0,05 | 25,54 | 7,9041 | 1,7064 | |
| 0,03 | 9,42 | 2,9159 | 1,0757 | |
| 0,02 | 12,24 | 3,7880 | 0,7147 | |
| 0,07 | 14,74 | 4,5629 | 0,4516 | |
| 0,00 | 4,64 | 1,4358 | 0,3970 | |
| 0,01 | 3,06 | 0,9475 | 0,3179 | |
| 0,02 | 5,83 | 1,8057 | 0,3037 | |
| 0,02 | 7,05 | 2,1823 | 0,2638 |
Top falder i dette kvartal
Vi bruger ændringen i porteføljeallokeringen, fordi dette er den mest meningsfulde metrik. Ændringer kan skyldes handler eller ændringer i aktiekurser.
| Sikkerhed | Aktier (MM) |
Værdi (MM$) |
Portefølje % | ΔPortefølje % |
|---|---|---|---|---|
| -5,22 | -1,6148 | -1,6148 | ||
| 0,10 | 21,20 | 6,5612 | -0,8193 | |
| 0,02 | 1,72 | 0,5318 | -0,6301 | |
| 0,01 | 2,71 | 0,8376 | -0,6234 | |
| 5,15 | 1,5928 | -0,4539 | ||
| 0,04 | 1,56 | 0,4839 | -0,3508 | |
| 0,01 | 7,19 | 2,2245 | -0,3094 | |
| 0,00 | 0,54 | 0,1674 | -0,2748 | |
| 0,02 | 2,78 | 0,8601 | -0,2533 | |
| 0,00 | 0,57 | 0,1775 | -0,2504 |
13F og Fondsarkivering
Denne formular blev indsendt den 2025-08-27 for rapporteringsperioden 2025-06-30. Klik på linkikonet for at se den fulde transaktionshistorik.
Opgrader for at låse op for premium-data og eksportere til Excel ![]() .
.
| Sikkerhed | Type | Gennemsnitlig aktiekurs | Aktier (MM) |
Δ Aktier (%) |
Δ Aktier (%) |
Værdi ($MM) |
Portefølje (%) |
ΔPortefølje (%) |
|
|---|---|---|---|---|---|---|---|---|---|
| NVDA / NVIDIA Corporation | 0,17 | -2,22 | 26,13 | 42,54 | 8,0892 | 2,1929 | |||
| MSFT / Microsoft Corporation | 0,05 | 0,00 | 25,54 | 32,50 | 7,9041 | 1,7064 | |||
| AAPL / Apple Inc. | 0,10 | 0,00 | 21,20 | -7,64 | 6,5612 | -0,8193 | |||
| AMZN / Amazon.com, Inc. | 0,07 | 0,00 | 14,74 | 15,31 | 4,5629 | 0,4516 | |||
| META / Meta Platforms, Inc. | 0,02 | 0,00 | 12,24 | 28,07 | 3,7880 | 0,7147 | |||
| AVGO / Broadcom Inc. | 0,03 | 0,00 | 9,42 | 64,63 | 2,9159 | 1,0757 | |||
| GOOGL / Alphabet Inc. | 0,04 | 0,00 | 7,86 | 13,95 | 2,4325 | 0,2148 | |||
| BRK.B / Berkshire Hathaway Inc. | 0,01 | 0,00 | 7,19 | -8,80 | 2,2245 | -0,3094 | |||
| JPM / JPMorgan Chase & Co. | 0,02 | 0,00 | 7,05 | 18,19 | 2,1823 | 0,2638 | |||
| VTI / Vanguard Index Funds - Vanguard Total Stock Market ETF | 0,02 | 760,00 | 6,53 | 851,09 | 2,0226 | 1,8016 | |||
| GOOG / Alphabet Inc. | 0,03 | 0,00 | 6,10 | 13,54 | 1,8874 | 0,1603 | |||
| TSLA / Tesla, Inc. | 0,02 | 1,90 | 5,83 | 24,90 | 1,8057 | 0,3037 | |||
| US85748R0096 / Dreyfus Institutional Preferred Government Plus Money Market Fund | 5,15 | -19,14 | 1,5928 | -0,4539 | |||||
| V / Visa Inc. | 0,01 | 0,00 | 4,99 | 1,30 | 1,5435 | -0,0394 | |||
| LLY / Eli Lilly and Company | 0,01 | 0,00 | 4,98 | -5,61 | 1,5406 | -0,1553 | |||
| NFLX / Netflix, Inc. | 0,00 | 0,00 | 4,64 | 43,59 | 1,4358 | 0,3970 | |||
| MA / Mastercard Incorporated | 0,01 | 0,00 | 4,20 | 2,54 | 1,3010 | -0,0175 | |||
| WMT / Walmart Inc. | 0,04 | 0,00 | 4,01 | 11,37 | 1,2404 | 0,0833 | |||
| COST / Costco Wholesale Corporation | 0,00 | 0,00 | 3,92 | 4,67 | 1,2140 | 0,0089 | |||
| PG / The Procter & Gamble Company | 0,02 | 0,00 | 3,58 | -6,51 | 1,1073 | -0,1233 | |||
| HD / The Home Depot, Inc. | 0,01 | 0,00 | 3,45 | 0,03 | 1,0687 | -0,0412 | |||
| KO / The Coca-Cola Company | 0,05 | 0,00 | 3,30 | -1,20 | 1,0211 | -0,0529 | |||
| ORCL / Oracle Corporation | 0,01 | 0,00 | 3,06 | 56,41 | 0,9475 | 0,3179 | |||
| CSCO / Cisco Systems, Inc. | 0,04 | 0,00 | 3,03 | 12,46 | 0,9385 | 0,0712 | |||
| ABBV / AbbVie Inc. | 0,02 | 0,00 | 2,92 | -11,41 | 0,9038 | -0,1561 | |||
| JNJ / Johnson & Johnson | 0,02 | -12,86 | 2,78 | -19,73 | 0,8601 | -0,2533 | |||
| GS / The Goldman Sachs Group, Inc. | 0,00 | 0,00 | 2,73 | 29,55 | 0,8456 | 0,1675 | |||
| UNH / UnitedHealth Group Incorporated | 0,01 | 0,00 | 2,71 | -40,44 | 0,8376 | -0,6234 | |||
| CVX / Chevron Corporation | 0,02 | 0,00 | 2,66 | -14,41 | 0,8219 | -0,1758 | |||
| MCD / McDonald's Corporation | 0,01 | 0,00 | 2,60 | -6,45 | 0,8033 | -0,0890 | |||
| BSX / Boston Scientific Corporation | 0,02 | 0,00 | 2,53 | 6,47 | 0,7841 | 0,0190 | |||
| ABT / Abbott Laboratories | 0,02 | 0,00 | 2,47 | 2,57 | 0,7658 | -0,0102 | |||
| RTX / RTX Corporation | 0,02 | 0,00 | 2,35 | 10,26 | 0,7288 | 0,0419 | |||
| PM / Philip Morris International Inc. | 0,01 | -2,80 | 2,32 | 11,50 | 0,7174 | 0,0491 | |||
| PEP / PepsiCo, Inc. | 0,02 | 0,00 | 2,18 | -11,93 | 0,6741 | -0,1212 | |||
| AMAT / Applied Materials, Inc. | 0,01 | 0,00 | 2,17 | 26,16 | 0,6718 | 0,1185 | |||
| WFC / Wells Fargo & Company | 0,03 | 0,00 | 2,16 | 11,58 | 0,6682 | 0,0461 | |||
| TXN / Texas Instruments Incorporated | 0,01 | 0,00 | 2,12 | 15,56 | 0,6555 | 0,0660 | |||
| MS / Morgan Stanley | 0,01 | 0,00 | 2,05 | 20,77 | 0,6337 | 0,0884 | |||
| BAC / Bank of America Corporation | 0,04 | -2,12 | 2,04 | 11,01 | 0,6306 | 0,0403 | |||
| AXP / American Express Company | 0,01 | 0,00 | 2,04 | 18,58 | 0,6303 | 0,0779 | |||
| HON / Honeywell International Inc. | 0,01 | 0,00 | 2,03 | 10,03 | 0,6280 | 0,0347 | |||
| INTU / Intuit Inc. | 0,00 | 0,00 | 1,97 | 28,35 | 0,6082 | 0,1156 | |||
| MMC / Marsh & McLennan Companies, Inc. | 0,01 | 0,00 | 1,96 | -10,44 | 0,6054 | -0,0966 | |||
| DUK / Duke Energy Corporation | 0,02 | -7,90 | 1,95 | -10,89 | 0,6028 | -0,1001 | |||
| ISRG / Intuitive Surgical, Inc. | 0,00 | 0,00 | 1,94 | 9,72 | 0,6008 | 0,0319 | |||
| CAT / Caterpillar Inc. | 0,00 | 0,00 | 1,94 | 17,73 | 0,6003 | 0,0704 | |||
| BKNG / Booking Holdings Inc. | 0,00 | 0,00 | 1,92 | 25,72 | 0,5931 | 0,1027 | |||
| C / Citigroup Inc. | 0,02 | 0,00 | 1,90 | 19,91 | 0,5874 | 0,0784 | |||
| MRK / Merck & Co., Inc. | 0,02 | 0,00 | 1,86 | -11,83 | 0,5746 | -0,1023 | |||
| AJG / Arthur J. Gallagher & Co. | 0,01 | 0,00 | 1,82 | -7,28 | 0,5636 | -0,0679 | |||
| ETN / Eaton Corporation plc | 0,01 | 0,00 | 1,80 | 31,34 | 0,5567 | 0,1163 | |||
| SPGI / S&P Global Inc. | 0,00 | 0,00 | 1,79 | 3,77 | 0,5546 | -0,0007 | |||
| XOM / Exxon Mobil Corporation | 0,02 | -47,54 | 1,72 | -52,45 | 0,5318 | -0,6301 | |||
| QCOM / QUALCOMM Incorporated | 0,01 | 0,00 | 1,63 | 3,63 | 0,5039 | -0,0011 | |||
| TRV / The Travelers Companies, Inc. | 0,01 | 0,00 | 1,61 | 1,20 | 0,4978 | -0,0135 | |||
| ICE / Intercontinental Exchange, Inc. | 0,01 | 0,00 | 1,61 | 6,36 | 0,4971 | 0,0115 | |||
| UNP / Union Pacific Corporation | 0,01 | 0,00 | 1,59 | -2,64 | 0,4917 | -0,0328 | |||
| VZ / Verizon Communications Inc. | 0,04 | -36,86 | 1,56 | -39,77 | 0,4839 | -0,3508 | |||
| DE / Deere & Company | 0,00 | 0,00 | 1,53 | 8,33 | 0,4748 | 0,0195 | |||
| DIS / The Walt Disney Company | 0,01 | 0,00 | 1,53 | 25,72 | 0,4737 | 0,0820 | |||
| ITW / Illinois Tool Works Inc. | 0,01 | 0,00 | 1,52 | -0,33 | 0,4700 | -0,0198 | |||
| TMO / Thermo Fisher Scientific Inc. | 0,00 | 0,00 | 1,51 | -18,54 | 0,4680 | -0,1287 | |||
| ADI / Analog Devices, Inc. | 0,01 | 0,00 | 1,41 | 18,04 | 0,4355 | 0,0521 | |||
| MCK / McKesson Corporation | 0,00 | 0,00 | 1,40 | 8,86 | 0,4334 | 0,0198 | |||
| LMT / Lockheed Martin Corporation | 0,00 | 0,00 | 1,36 | 3,65 | 0,4225 | -0,0009 | |||
| PFE / Pfizer Inc. | 0,05 | 0,00 | 1,21 | -4,34 | 0,3752 | -0,0323 | |||
| VRTX / Vertex Pharmaceuticals Incorporated | 0,00 | 0,00 | 1,13 | -8,14 | 0,3492 | -0,0459 | |||
| UBER / Uber Technologies, Inc. | 0,01 | -11,67 | 1,07 | 13,09 | 0,3316 | 0,0270 | |||
| MPC / Marathon Petroleum Corporation | 0,01 | 0,00 | 1,06 | 14,04 | 0,3269 | 0,0290 | |||
| BA / The Boeing Company | 0,00 | -7,01 | 1,00 | 14,37 | 0,3105 | 0,0281 | |||
| GEV / GE Vernova Inc. | 0,00 | 7,55 | 0,97 | 86,56 | 0,3010 | 0,1333 | |||
| NOW / ServiceNow, Inc. | 0,00 | -29,51 | 0,96 | -8,92 | 0,2972 | -0,0420 | |||
| OGE / OGE Energy Corp. | 0,02 | -14,61 | 0,89 | -17,55 | 0,2750 | -0,0715 | |||
| UPS / United Parcel Service, Inc. | 0,01 | 0,00 | 0,89 | -8,29 | 0,2742 | -0,0362 | |||
| GE / General Electric Company | 0,00 | -42,69 | 0,77 | -26,37 | 0,2371 | -0,0972 | |||
| NKE / NIKE, Inc. | 0,01 | -8,21 | 0,76 | 2,70 | 0,2356 | -0,0027 | |||
| IDA / IDACORP, Inc. | 0,01 | 0,00 | 0,69 | -0,58 | 0,2127 | -0,0098 | |||
| CWEN / Clearway Energy, Inc. | 0,02 | 0,00 | 0,64 | 5,64 | 0,1975 | 0,0034 | |||
| UNM / Unum Group | 0,01 | 0,00 | 0,61 | -0,82 | 0,1881 | -0,0090 | |||
| ADBE / Adobe Inc. | 0,00 | -57,28 | 0,57 | -56,92 | 0,1775 | -0,2504 | |||
| SPOT / Spotify Technology S.A. | 0,00 | 0,00 | 0,55 | 39,65 | 0,1712 | 0,0437 | |||
| CRM / Salesforce, Inc. | 0,00 | -61,30 | 0,54 | -60,73 | 0,1674 | -0,2748 | |||
| UGI / UGI Corporation | 0,01 | 0,00 | 0,53 | 10,19 | 0,1643 | 0,0093 | |||
| CW / Curtiss-Wright Corporation | 0,00 | 0,00 | 0,50 | 53,99 | 0,1556 | 0,0506 | |||
| HEI / HEICO Corporation | 0,00 | 0,00 | 0,50 | 22,85 | 0,1550 | 0,0238 | |||
| NNN / NNN REIT, Inc. | 0,01 | 0,00 | 0,50 | 1,22 | 0,1541 | -0,0040 | |||
| IBM / International Business Machines Corporation | 0,00 | -59,50 | 0,49 | -52,04 | 0,1532 | -0,1783 | |||
| RGLD / Royal Gold, Inc. | 0,00 | 0,00 | 0,49 | 8,72 | 0,1507 | 0,0067 | |||
| LNG / Cheniere Energy, Inc. | 0,00 | 0,00 | 0,48 | 5,23 | 0,1496 | 0,0019 | |||
| FR / First Industrial Realty Trust, Inc. | 0,01 | -6,36 | 0,48 | -16,64 | 0,1476 | -0,0360 | |||
| GGG / Graco Inc. | 0,01 | 0,00 | 0,46 | 3,11 | 0,1437 | -0,0013 | |||
| OVV / Ovintiv Inc. | 0,01 | 0,00 | 0,46 | -11,15 | 0,1432 | -0,0242 | |||
| EME / EMCOR Group, Inc. | 0,00 | 15,00 | 0,46 | 66,67 | 0,1409 | 0,0529 | |||
| KBH / KB Home | 0,01 | 0,00 | 0,45 | -9,02 | 0,1408 | -0,0197 | |||
| EHC / Encompass Health Corporation | 0,00 | 62,09 | 0,45 | 96,05 | 0,1386 | 0,0652 | |||
| WTRG / Essential Utilities, Inc. | 0,01 | -19,30 | 0,43 | -24,11 | 0,1326 | -0,0491 | |||
| CCK / Crown Holdings, Inc. | 0,00 | 0,00 | 0,43 | 15,14 | 0,1322 | 0,0131 | |||
| PR / Permian Resources Corporation | 0,03 | 41,49 | 0,42 | 39,27 | 0,1307 | 0,0331 | |||
| ADC / Agree Realty Corporation | 0,01 | -44,61 | 0,42 | -47,58 | 0,1307 | -0,1283 | |||
| BRX / Brixmor Property Group Inc. | 0,02 | 0,00 | 0,41 | -1,90 | 0,1279 | -0,0076 | |||
| H / Hyatt Hotels Corporation | 0,00 | 0,00 | 0,40 | 14,08 | 0,1230 | 0,0109 | |||
| PRI / Primerica, Inc. | 0,00 | 0,00 | 0,39 | -3,71 | 0,1205 | -0,0097 | |||
| VEEV / Veeva Systems Inc. | 0,00 | 0,00 | 0,39 | 24,19 | 0,1194 | 0,0196 | |||
| US8575093013 / State Street Navigator Securities Lending Government Money Market Portfolio | 0,38 | -11,45 | 0,38 | -11,42 | 0,1176 | -0,0204 | |||
| EGP / EastGroup Properties, Inc. | 0,00 | 30,57 | 0,38 | 23,86 | 0,1175 | 0,0190 | |||
| RPM / RPM International Inc. | 0,00 | 0,00 | 0,38 | -5,03 | 0,1172 | -0,0110 | |||
| INGR / Ingredion Incorporated | 0,00 | 0,00 | 0,38 | 0,27 | 0,1169 | -0,0042 | |||
| TXNM / TXNM Energy, Inc. | 0,01 | -3,20 | 0,36 | 1,99 | 0,1109 | -0,0021 | |||
| POST / Post Holdings, Inc. | 0,00 | 0,00 | 0,35 | -6,10 | 0,1096 | -0,0119 | |||
| HOOD / Robinhood Markets, Inc. | 0,00 | 0,00 | 0,34 | 125,83 | 0,1057 | 0,0569 | |||
| OC / Owens Corning | 0,00 | 0,00 | 0,34 | -3,68 | 0,1054 | -0,0083 | |||
| CTRE / CareTrust REIT, Inc. | 0,01 | 0,00 | 0,34 | 7,26 | 0,1053 | 0,0031 | |||
| SGI / Somnigroup International Inc. | 0,00 | 0,00 | 0,32 | 13,83 | 0,0995 | 0,0085 | |||
| THC / Tenet Healthcare Corporation | 0,00 | 0,00 | 0,32 | 30,99 | 0,0984 | 0,0203 | |||
| JLL / Jones Lang LaSalle Incorporated | 0,00 | 0,00 | 0,31 | 2,95 | 0,0975 | -0,0007 | |||
| BAH / Booz Allen Hamilton Holding Corporation | 0,00 | 0,00 | 0,31 | -0,32 | 0,0969 | -0,0042 | |||
| EQH / Equitable Holdings, Inc. | 0,01 | 0,00 | 0,31 | 7,69 | 0,0955 | 0,0034 | |||
| MUR / Murphy Oil Corporation | 0,01 | 0,00 | 0,30 | -20,58 | 0,0932 | -0,0290 | |||
| ESI / Element Solutions Inc | 0,01 | 0,00 | 0,29 | 0,34 | 0,0907 | -0,0034 | |||
| TMHC / Taylor Morrison Home Corporation | 0,00 | 0,00 | 0,29 | 2,46 | 0,0902 | -0,0014 | |||
| BWXT / BWX Technologies, Inc. | 0,00 | 0,00 | 0,29 | 46,23 | 0,0901 | 0,0260 | |||
| SCCO / Southern Copper Corporation | 0,00 | 0,96 | 0,29 | 9,20 | 0,0885 | 0,0044 | |||
| FTI / TechnipFMC plc | 0,01 | 0,00 | 0,28 | 8,85 | 0,0877 | 0,0039 | |||
| WSO / Watsco, Inc. | 0,00 | 0,00 | 0,28 | -13,00 | 0,0871 | -0,0171 | |||
| CACI / CACI International Inc | 0,00 | 0,00 | 0,28 | 29,77 | 0,0866 | 0,0173 | |||
| LAMR / Lamar Advertising Company | 0,00 | 0,00 | 0,27 | 6,61 | 0,0850 | 0,0022 | |||
| BJ / BJ's Wholesale Club Holdings, Inc. | 0,00 | 0,00 | 0,27 | -5,59 | 0,0838 | -0,0083 | |||
| MRVL / Marvell Technology, Inc. | 0,00 | 12,92 | 0,27 | 42,25 | 0,0825 | 0,0221 | |||
| SSNC / SS&C Technologies Holdings, Inc. | 0,00 | 0,00 | 0,26 | -1,13 | 0,0814 | -0,0039 | |||
| NXT / Nextracker Inc. | 0,00 | 0,00 | 0,25 | 29,08 | 0,0784 | 0,0153 | |||
| PECO / Phillips Edison & Company, Inc. | 0,01 | 0,00 | 0,25 | -4,21 | 0,0777 | -0,0064 | |||
| DT / Dynatrace, Inc. | 0,00 | 212,84 | 0,25 | 267,16 | 0,0762 | 0,0546 | |||
| RRC / Range Resources Corporation | 0,01 | 47,50 | 0,25 | 50,31 | 0,0760 | 0,0234 | |||
| AGCO / AGCO Corporation | 0,00 | 0,00 | 0,24 | 11,42 | 0,0757 | 0,0051 | |||
| IBKR / Interactive Brokers Group, Inc. | 0,00 | 300,00 | 0,24 | 34,09 | 0,0733 | 0,0164 | |||
| CSL / Carlisle Companies Incorporated | 0,00 | 0,00 | 0,23 | 9,86 | 0,0725 | 0,0038 | |||
| MKL / Markel Group Inc. | 0,00 | 0,00 | 0,23 | 6,88 | 0,0723 | 0,0020 | |||
| RGA / Reinsurance Group of America, Incorporated | 0,00 | 0,00 | 0,23 | 0,88 | 0,0713 | -0,0022 | |||
| USFD / US Foods Holding Corp. | 0,00 | 0,00 | 0,23 | 18,13 | 0,0706 | 0,0082 | |||
| AMH / American Homes 4 Rent | 0,01 | -7,26 | 0,23 | -11,37 | 0,0701 | -0,0122 | |||
| DKS / DICK'S Sporting Goods, Inc. | 0,00 | 0,00 | 0,22 | -2,18 | 0,0696 | -0,0041 | |||
| MSTR / Strategy Inc | 0,00 | 0,00 | 0,22 | 40,51 | 0,0688 | 0,0178 | |||
| ZS / Zscaler, Inc. | 0,00 | 0,00 | 0,22 | 58,27 | 0,0683 | 0,0235 | |||
| MP / MP Materials Corp. | 0,01 | 0,00 | 0,22 | 36,65 | 0,0681 | 0,0162 | |||
| CNH / CNH Industrial N.V. | 0,02 | 0,00 | 0,22 | 5,37 | 0,0671 | 0,0010 | |||
| MTG / MGIC Investment Corporation | 0,01 | 0,00 | 0,22 | 12,50 | 0,0670 | 0,0050 | |||
| CBT / Cabot Corporation | 0,00 | 0,00 | 0,21 | -9,83 | 0,0656 | -0,0099 | |||
| CUZ / Cousins Properties Incorporated | 0,01 | 0,00 | 0,21 | 1,45 | 0,0653 | -0,0013 | |||
| PPC / Pilgrim's Pride Corporation | 0,00 | 0,00 | 0,21 | -17,65 | 0,0652 | -0,0169 | |||
| CASY / Casey's General Stores, Inc. | 0,00 | 0,00 | 0,21 | 18,08 | 0,0648 | 0,0075 | |||
| DBX / Dropbox, Inc. | 0,01 | 0,00 | 0,21 | 7,18 | 0,0647 | 0,0019 | |||
| DINO / HF Sinclair Corporation | 0,01 | 0,00 | 0,21 | 24,85 | 0,0640 | 0,0108 | |||
| AMCR / Amcor plc | 0,02 | 0,21 | 0,0637 | 0,0637 | |||||
| CIEN / Ciena Corporation | 0,00 | 0,00 | 0,21 | 34,87 | 0,0635 | 0,0145 | |||
| BYD / Boyd Gaming Corporation | 0,00 | 0,00 | 0,20 | 19,28 | 0,0614 | 0,0077 | |||
| MGY / Magnolia Oil & Gas Corporation | 0,01 | -8,30 | 0,20 | -18,33 | 0,0608 | -0,0166 | |||
| EXEL / Exelixis, Inc. | 0,00 | 0,00 | 0,19 | 19,75 | 0,0602 | 0,0078 | |||
| OHI / Omega Healthcare Investors, Inc. | 0,01 | -16,19 | 0,19 | -19,67 | 0,0597 | -0,0172 | |||
| LPLA / LPL Financial Holdings Inc. | 0,00 | 0,00 | 0,19 | 14,46 | 0,0590 | 0,0055 | |||
| ORI / Old Republic International Corporation | 0,00 | 0,00 | 0,19 | -2,06 | 0,0589 | -0,0035 | |||
| IRT / Independence Realty Trust, Inc. | 0,01 | 0,00 | 0,19 | -16,81 | 0,0585 | -0,0144 | |||
| ENTG / Entegris, Inc. | 0,00 | 62,78 | 0,19 | 49,60 | 0,0582 | 0,0179 | |||
| BEPC / Brookfield Renewable Corporation | 0,01 | 20,29 | 0,18 | 41,41 | 0,0562 | 0,0149 | |||
| CLH / Clean Harbors, Inc. | 0,00 | 0,00 | 0,18 | 17,53 | 0,0562 | 0,0064 | |||
| PLNT / Planet Fitness, Inc. | 0,00 | 0,00 | 0,18 | 12,66 | 0,0554 | 0,0044 | |||
| AYI / Acuity Inc. | 0,00 | 17,00 | 0,18 | 32,33 | 0,0547 | 0,0118 | |||
| RS / Reliance, Inc. | 0,00 | 0,00 | 0,17 | 8,75 | 0,0539 | 0,0024 | |||
| NTNX / Nutanix, Inc. | 0,00 | 0,00 | 0,17 | 9,49 | 0,0538 | 0,0027 | |||
| PII / Polaris Inc. | 0,00 | 0,00 | 0,17 | -0,58 | 0,0533 | -0,0025 | |||
| MTZ / MasTec, Inc. | 0,00 | 68,07 | 0,17 | 146,38 | 0,0528 | 0,0304 | |||
| VMI / Valmont Industries, Inc. | 0,00 | 0,00 | 0,17 | 14,48 | 0,0517 | 0,0048 | |||
| AN / AutoNation, Inc. | 0,00 | 0,00 | 0,17 | 22,96 | 0,0516 | 0,0079 | |||
| FCNCA / First Citizens BancShares, Inc. | 0,00 | 0,00 | 0,17 | 5,73 | 0,0515 | 0,0008 | |||
| XPO / XPO, Inc. | 0,00 | 0,00 | 0,17 | 17,86 | 0,0511 | 0,0059 | |||
| TW / Tradeweb Markets Inc. | 0,00 | 0,00 | 0,16 | -1,81 | 0,0507 | -0,0027 | |||
| ARMK / Aramark | 0,00 | 0,00 | 0,16 | 20,90 | 0,0503 | 0,0072 | |||
| AHR / American Healthcare REIT, Inc. | 0,00 | 110,17 | 0,16 | 157,14 | 0,0503 | 0,0298 | |||
| COHR / Coherent Corp. | 0,00 | 0,00 | 0,16 | 37,93 | 0,0496 | 0,0121 | |||
| COIN / Coinbase Global, Inc. | 0,00 | 48,68 | 0,16 | 203,85 | 0,0490 | 0,0322 | |||
| AXTA / Axalta Coating Systems Ltd. | 0,01 | -30,11 | 0,16 | -37,55 | 0,0490 | -0,0324 | |||
| NET / Cloudflare, Inc. | 0,00 | 0,00 | 0,16 | 74,44 | 0,0488 | 0,0196 | |||
| OSK / Oshkosh Corporation | 0,00 | 0,00 | 0,16 | 20,93 | 0,0484 | 0,0067 | |||
| RDN / Radian Group Inc. | 0,00 | 0,00 | 0,15 | 8,57 | 0,0473 | 0,0022 | |||
| RBLX / Roblox Corporation | 0,00 | 43,07 | 0,15 | 162,07 | 0,0471 | 0,0281 | |||
| VVV / Valvoline Inc. | 0,00 | 0,00 | 0,15 | 8,70 | 0,0466 | 0,0021 | |||
| RPRX / Royalty Pharma plc | 0,00 | -26,41 | 0,15 | -14,77 | 0,0465 | -0,0102 | |||
| US21871X1090 / Corebridge Financial, Inc. | 0,00 | 0,00 | 0,15 | 12,21 | 0,0457 | 0,0035 | |||
| GLPI / Gaming and Leisure Properties, Inc. | 0,00 | -64,62 | 0,14 | -67,60 | 0,0431 | -0,0950 | |||
| CELH / Celsius Holdings, Inc. | 0,00 | 0,00 | 0,14 | 31,07 | 0,0418 | 0,0085 | |||
| LPX / Louisiana-Pacific Corporation | 0,00 | 0,00 | 0,13 | -6,34 | 0,0413 | -0,0046 | |||
| MMSI / Merit Medical Systems, Inc. | 0,00 | 0,00 | 0,13 | -11,64 | 0,0400 | -0,0070 | |||
| KBR / KBR, Inc. | 0,00 | -27,76 | 0,13 | -30,60 | 0,0395 | -0,0195 | |||
| Z / Zillow Group, Inc. | 0,00 | 0,00 | 0,13 | 2,46 | 0,0387 | -0,0007 | |||
| MEDP / Medpace Holdings, Inc. | 0,00 | 0,00 | 0,12 | 2,50 | 0,0384 | -0,0003 | |||
| MUSA / Murphy USA Inc. | 0,00 | -45,11 | 0,12 | -52,51 | 0,0382 | -0,0452 | |||
| WING / Wingstop Inc. | 0,00 | 0,00 | 0,12 | 48,78 | 0,0379 | 0,0115 | |||
| SUI / Sun Communities, Inc. | 0,00 | -49,58 | 0,12 | -50,61 | 0,0379 | -0,0416 | |||
| CVNA / Carvana Co. | 0,00 | 583,02 | 0,12 | 1.000,00 | 0,0378 | 0,0342 | |||
| WHR / Whirlpool Corporation | 0,00 | 0,00 | 0,12 | 13,08 | 0,0376 | 0,0029 | |||
| SCI / Service Corporation International | 0,00 | 0,00 | 0,12 | 0,84 | 0,0374 | -0,0009 | |||
| SOFI / SoFi Technologies, Inc. | 0,01 | 0,00 | 0,12 | 57,89 | 0,0372 | 0,0125 | |||
| TRU / TransUnion | 0,00 | 36,87 | 0,12 | 46,34 | 0,0372 | 0,0106 | |||
| ELS / Equity LifeStyle Properties, Inc. | 0,00 | -77,07 | 0,12 | -78,92 | 0,0365 | -0,1422 | |||
| AM / Antero Midstream Corporation | 0,01 | 0,00 | 0,12 | 5,41 | 0,0363 | 0,0005 | |||
| LAD / Lithia Motors, Inc. | 0,00 | 0,00 | 0,12 | 15,00 | 0,0359 | 0,0035 | |||
| RKT / Rocket Companies, Inc. | 0,01 | 0,00 | 0,12 | 17,35 | 0,0358 | 0,0041 | |||
| BKH / Black Hills Corporation | 0,00 | 0,00 | 0,12 | -7,26 | 0,0357 | -0,0044 | |||
| W / Wayfair Inc. | 0,00 | 54,76 | 0,11 | 147,83 | 0,0355 | 0,0206 | |||
| VOYA / Voya Financial, Inc. | 0,00 | 0,00 | 0,11 | 4,59 | 0,0354 | 0,0003 | |||
| TOL / Toll Brothers, Inc. | 0,00 | -51,08 | 0,11 | -47,20 | 0,0350 | -0,0338 | |||
| RBA / RB Global, Inc. | 0,00 | -0,09 | 0,11 | 5,66 | 0,0348 | 0,0006 | |||
| ESAB / ESAB Corporation | 0,00 | 0,00 | 0,11 | 3,70 | 0,0347 | -0,0001 | |||
| PEN / Penumbra, Inc. | 0,00 | 0,00 | 0,11 | -3,48 | 0,0344 | -0,0028 | |||
| THG / The Hanover Insurance Group, Inc. | 0,00 | 0,00 | 0,11 | -2,65 | 0,0342 | -0,0022 | |||
| CNR / Core Natural Resources, Inc. | 0,00 | 0,00 | 0,11 | -9,92 | 0,0340 | -0,0051 | |||
| SAIA / Saia, Inc. | 0,00 | 0,00 | 0,11 | -21,74 | 0,0337 | -0,0109 | |||
| ASTS / AST SpaceMobile, Inc. | 0,00 | 0,00 | 0,11 | 105,77 | 0,0334 | 0,0165 | |||
| TTD / The Trade Desk, Inc. | 0,00 | 46,08 | 0,11 | 94,55 | 0,0332 | 0,0153 | |||
| NLY / Annaly Capital Management, Inc. | 0,01 | 0,00 | 0,11 | -7,02 | 0,0329 | -0,0040 | |||
| SBRA / Sabra Health Care REIT, Inc. | 0,01 | 0,00 | 0,11 | 6,00 | 0,0329 | 0,0005 | |||
| MANH / Manhattan Associates, Inc. | 0,00 | -18,51 | 0,11 | -7,02 | 0,0328 | -0,0038 | |||
| RNR / RenaissanceRe Holdings Ltd. | 0,00 | 0,00 | 0,11 | 0,96 | 0,0328 | -0,0009 | |||
| FWONA / Formula One Group | 0,00 | 0,00 | 0,11 | 16,67 | 0,0325 | 0,0035 | |||
| NEU / NewMarket Corporation | 0,00 | 0,00 | 0,11 | 22,09 | 0,0325 | 0,0048 | |||
| FHN / First Horizon Corporation | 0,00 | 0,00 | 0,10 | 8,33 | 0,0325 | 0,0016 | |||
| QRVO / Qorvo, Inc. | 0,00 | 122,20 | 0,10 | 160,00 | 0,0324 | 0,0195 | |||
| ELF / e.l.f. Beauty, Inc. | 0,00 | -25,16 | 0,10 | 48,57 | 0,0322 | 0,0096 | |||
| CPA / Copa Holdings, S.A. | 0,00 | 0,00 | 0,10 | 18,39 | 0,0321 | 0,0041 | |||
| DKNG / DraftKings Inc. | 0,00 | 0,00 | 0,10 | 29,11 | 0,0318 | 0,0062 | |||
| GPK / Graphic Packaging Holding Company | 0,00 | -51,69 | 0,10 | -61,00 | 0,0315 | -0,0519 | |||
| DOCS / Doximity, Inc. | 0,00 | 0,00 | 0,10 | 6,38 | 0,0311 | 0,0005 | |||
| FMC / FMC Corporation | 0,00 | -37,04 | 0,10 | -37,97 | 0,0306 | -0,0204 | |||
| RLI / RLI Corp. | 0,00 | -30,78 | 0,10 | -38,06 | 0,0299 | -0,0200 | |||
| NJR / New Jersey Resources Corporation | 0,00 | 0,00 | 0,10 | -8,65 | 0,0295 | -0,0040 | |||
| KNSL / Kinsale Capital Group, Inc. | 0,00 | 0,00 | 0,09 | -1,05 | 0,0294 | -0,0013 | |||
| GAP / The Gap, Inc. | 0,00 | 0,00 | 0,09 | 5,68 | 0,0288 | 0,0005 | |||
| RHP / Ryman Hospitality Properties, Inc. | 0,00 | 0,00 | 0,09 | 8,24 | 0,0287 | 0,0011 | |||
| ARRY / Array Technologies, Inc. | 0,02 | 0,00 | 0,09 | 21,05 | 0,0285 | 0,0041 | |||
| XP / XP Inc. | 0,00 | 0,00 | 0,09 | 46,77 | 0,0282 | 0,0083 | |||
| PINS / Pinterest, Inc. | 0,00 | 0,00 | 0,09 | 16,67 | 0,0282 | 0,0029 | |||
| HL / Hecla Mining Company | 0,01 | 0,00 | 0,09 | 7,32 | 0,0274 | 0,0010 | |||
| LUMN / Lumen Technologies, Inc. | 0,02 | 0,00 | 0,09 | 11,54 | 0,0272 | 0,0019 | |||
| AFRM / Affirm Holdings, Inc. | 0,00 | 39,66 | 0,09 | 112,50 | 0,0266 | 0,0137 | |||
| BE / Bloom Energy Corporation | 0,00 | 0,00 | 0,08 | 21,74 | 0,0263 | 0,0038 | |||
| CALM / Cal-Maine Foods, Inc. | 0,00 | 0,00 | 0,08 | 10,53 | 0,0261 | 0,0014 | |||
| URBN / Urban Outfitters, Inc. | 0,00 | 0,00 | 0,08 | 38,33 | 0,0258 | 0,0064 | |||
| OLED / Universal Display Corporation | 0,00 | 0,00 | 0,08 | 11,11 | 0,0249 | 0,0015 | |||
| SMG / The Scotts Miracle-Gro Company | 0,00 | 0,00 | 0,08 | 19,70 | 0,0246 | 0,0033 | |||
| ANF / Abercrombie & Fitch Co. | 0,00 | -20,57 | 0,08 | -13,33 | 0,0243 | -0,0050 | |||
| HAE / Haemonetics Corporation | 0,00 | 0,00 | 0,08 | 16,67 | 0,0241 | 0,0028 | |||
| PSTG / Pure Storage, Inc. | 0,00 | 0,00 | 0,08 | 31,03 | 0,0235 | 0,0047 | |||
| ICUI / ICU Medical, Inc. | 0,00 | 0,00 | 0,08 | -5,06 | 0,0233 | -0,0021 | |||
| PZZA / Papa John's International, Inc. | 0,00 | -48,56 | 0,08 | -38,52 | 0,0233 | -0,0162 | |||
| SAIC / Science Applications International Corporation | 0,00 | -69,61 | 0,07 | -69,71 | 0,0228 | -0,0548 | |||
| NOG / Northern Oil and Gas, Inc. | 0,00 | 0,00 | 0,07 | -6,41 | 0,0227 | -0,0025 | |||
| HE / Hawaiian Electric Industries, Inc. | 0,01 | 0,00 | 0,07 | -2,70 | 0,0225 | -0,0016 | |||
| ALKS / Alkermes plc | 0,00 | 0,00 | 0,07 | -13,25 | 0,0224 | -0,0045 | |||
| EXAS / Exact Sciences Corporation | 0,00 | -23,03 | 0,07 | -5,26 | 0,0224 | -0,0022 | |||
| PFGC / Performance Food Group Company | 0,00 | 0,00 | 0,07 | 12,50 | 0,0224 | 0,0015 | |||
| ALLY / Ally Financial Inc. | 0,00 | 0,00 | 0,07 | 6,06 | 0,0219 | 0,0006 | |||
| AR / Antero Resources Corporation | 0,00 | 22,60 | 0,07 | 22,81 | 0,0218 | 0,0033 | |||
| TOST / Toast, Inc. | 0,00 | 0,00 | 0,07 | 34,62 | 0,0218 | 0,0048 | |||
| USM / United States Cellular Corporation | 0,00 | 0,00 | 0,07 | -8,00 | 0,0217 | -0,0027 | |||
| RIVN / Rivian Automotive, Inc. | 0,01 | 0,00 | 0,07 | 9,52 | 0,0216 | 0,0013 | |||
| BFAM / Bright Horizons Family Solutions Inc. | 0,00 | 0,00 | 0,07 | -2,86 | 0,0212 | -0,0014 | |||
| U / Unity Software Inc. | 0,00 | 0,00 | 0,07 | 24,53 | 0,0206 | 0,0033 | |||
| MTH / Meritage Homes Corporation | 0,00 | 0,00 | 0,07 | -5,80 | 0,0204 | -0,0020 | |||
| GEO / The GEO Group, Inc. | 0,00 | 0,00 | 0,07 | -18,75 | 0,0203 | -0,0054 | |||
| WIX / Wix.com Ltd. | 0,00 | 0,00 | 0,06 | -3,03 | 0,0201 | -0,0014 | |||
| BRBR / BellRing Brands, Inc. | 0,00 | -13,10 | 0,06 | -32,63 | 0,0200 | -0,0107 | |||
| OTTR / Otter Tail Corporation | 0,00 | 0,00 | 0,06 | -4,48 | 0,0200 | -0,0017 | |||
| BTU / Peabody Energy Corporation | 0,00 | -32,29 | 0,06 | -32,98 | 0,0196 | -0,0108 | |||
| LNTH / Lantheus Holdings, Inc. | 0,00 | -44,90 | 0,06 | -53,66 | 0,0177 | -0,0220 | |||
| NOV / NOV Inc. | 0,00 | 0,00 | 0,06 | -18,84 | 0,0176 | -0,0048 | |||
| ROKU / Roku, Inc. | 0,00 | 0,00 | 0,06 | 24,44 | 0,0174 | 0,0029 | |||
| BPMC / Blueprint Medicines Corporation | 0,00 | 0,00 | 0,06 | 44,74 | 0,0173 | 0,0049 | |||
| PEGA / Pegasystems Inc. | 0,00 | 267,86 | 0,06 | 189,47 | 0,0173 | 0,0110 | |||
| ACHR / Archer Aviation Inc. | 0,01 | 0,00 | 0,06 | 52,78 | 0,0172 | 0,0055 | |||
| UPST / Upstart Holdings, Inc. | 0,00 | 78,42 | 0,05 | 157,14 | 0,0167 | 0,0098 | |||
| QBTS / D-Wave Quantum Inc. | 0,00 | 0,00 | 0,05 | 96,30 | 0,0167 | 0,0077 | |||
| SLGN / Silgan Holdings Inc. | 0,00 | 0,00 | 0,05 | 6,12 | 0,0163 | 0,0003 | |||
| ARW / Arrow Electronics, Inc. | 0,00 | 0,00 | 0,05 | 24,39 | 0,0159 | 0,0024 | |||
| RUN / Sunrun Inc. | 0,01 | 0,00 | 0,05 | 40,00 | 0,0154 | 0,0039 | |||
| BOX / Box, Inc. | 0,00 | -30,09 | 0,05 | -22,58 | 0,0150 | -0,0051 | |||
| AGNC / AGNC Investment Corp. | 0,01 | -75,29 | 0,05 | -76,50 | 0,0147 | -0,0498 | |||
| CHX / ChampionX Corporation | 0,00 | 0,00 | 0,05 | -17,86 | 0,0145 | -0,0036 | |||
| ASO / Academy Sports and Outdoors, Inc. | 0,00 | 0,00 | 0,05 | -2,13 | 0,0144 | -0,0008 | |||
| RIG / Transocean Ltd. | 0,02 | 0,00 | 0,05 | -19,64 | 0,0142 | -0,0039 | |||
| GXO / GXO Logistics, Inc. | 0,00 | 0,00 | 0,05 | 25,00 | 0,0141 | 0,0023 | |||
| MAC / The Macerich Company | 0,00 | 0,00 | 0,05 | -4,26 | 0,0140 | -0,0014 | |||
| IRDM / Iridium Communications Inc. | 0,00 | 0,00 | 0,04 | 10,00 | 0,0138 | 0,0008 | |||
| TNL / Travel + Leisure Co. | 0,00 | 0,00 | 0,04 | 12,82 | 0,0137 | 0,0009 | |||
| FRPT / Freshpet, Inc. | 0,00 | 0,00 | 0,04 | -18,87 | 0,0136 | -0,0037 | |||
| PFSI / PennyMac Financial Services, Inc. | 0,00 | 0,00 | 0,04 | -2,27 | 0,0136 | -0,0006 | |||
| MARA / MARA Holdings, Inc. | 0,00 | -17,81 | 0,04 | 13,16 | 0,0135 | 0,0010 | |||
| ESTC / Elastic N.V. | 0,00 | 0,00 | 0,04 | -4,44 | 0,0134 | -0,0013 | |||
| PDD / PDD Holdings Inc. - Depositary Receipt (Common Stock) | 0,00 | -51,55 | 0,04 | -56,84 | 0,0127 | -0,0181 | |||
| VIRT / Virtu Financial, Inc. | 0,00 | 0,00 | 0,04 | 17,65 | 0,0126 | 0,0015 | |||
| CCOI / Cogent Communications Holdings, Inc. | 0,00 | 0,00 | 0,04 | -21,57 | 0,0125 | -0,0040 | |||
| STNE / StoneCo Ltd. | 0,00 | 0,00 | 0,04 | 50,00 | 0,0124 | 0,0040 | |||
| FN / Fabrinet | 0,00 | 49,43 | 0,04 | 123,53 | 0,0119 | 0,0063 | |||
| LBRT / Liberty Energy Inc. | 0,00 | 0,00 | 0,04 | -27,45 | 0,0116 | -0,0050 | |||
| TMDX / TransMedics Group, Inc. | 0,00 | 0,00 | 0,04 | 105,56 | 0,0116 | 0,0055 | |||
| TRNO / Terreno Realty Corporation | 0,00 | -59,70 | 0,03 | -64,58 | 0,0106 | -0,0203 | |||
| CLSK / CleanSpark, Inc. | 0,00 | 0,00 | 0,03 | 65,00 | 0,0102 | 0,0038 | |||
| SHAK / Shake Shack Inc. | 0,00 | 0,00 | 0,03 | 60,00 | 0,0102 | 0,0035 | |||
| DAR / Darling Ingredients Inc. | 0,00 | 0,00 | 0,03 | 23,08 | 0,0101 | 0,0015 | |||
| BBIO / BridgeBio Pharma, Inc. | 0,00 | -36,10 | 0,03 | -20,51 | 0,0098 | -0,0029 | |||
| OSCR / Oscar Health, Inc. | 0,00 | 0,00 | 0,03 | 63,16 | 0,0098 | 0,0036 | |||
| OLN / Olin Corporation | 0,00 | 0,00 | 0,03 | -16,22 | 0,0097 | -0,0025 | |||
| SMTC / Semtech Corporation | 0,00 | 0,00 | 0,03 | 34,78 | 0,0097 | 0,0020 | |||
| SLG / SL Green Realty Corp. | 0,00 | 0,00 | 0,03 | 7,14 | 0,0095 | 0,0003 | |||
| AI / C3.ai, Inc. | 0,00 | 0,00 | 0,03 | 15,38 | 0,0094 | 0,0010 | |||
| VRNS / Varonis Systems, Inc. | 0,00 | -74,64 | 0,03 | -68,48 | 0,0091 | -0,0206 | |||
| SMR / NuScale Power Corporation | 0,00 | 0,00 | 0,03 | 180,00 | 0,0089 | 0,0056 | |||
| GWRE / Guidewire Software, Inc. | 0,00 | -90,49 | 0,03 | -88,03 | 0,0087 | -0,0667 | |||
| RH / RH | 0,00 | 48,00 | 0,03 | 17,39 | 0,0087 | 0,0011 | |||
| IONS / Ionis Pharmaceuticals, Inc. | 0,00 | -58,31 | 0,03 | -46,00 | 0,0085 | -0,0077 | |||
| VSCO / Victoria's Secret & Co. | 0,00 | 0,00 | 0,03 | 0,00 | 0,0079 | -0,0003 | |||
| LECO / Lincoln Electric Holdings, Inc. | 0,00 | 0,00 | 0,03 | 13,64 | 0,0078 | 0,0004 | |||
| CDE / Coeur Mining, Inc. | 0,00 | 0,00 | 0,02 | 50,00 | 0,0076 | 0,0023 | |||
| IBP / Installed Building Products, Inc. | 0,00 | 0,00 | 0,02 | 4,35 | 0,0076 | 0,0001 | |||
| SOUN / SoundHound AI, Inc. | 0,00 | 221,16 | 0,02 | 380,00 | 0,0075 | 0,0057 | |||
| VKTX / Viking Therapeutics, Inc. | 0,00 | -54,93 | 0,02 | -52,17 | 0,0071 | -0,0078 | |||
| SHLS / Shoals Technologies Group, Inc. | 0,01 | 0,00 | 0,02 | 29,41 | 0,0071 | 0,0013 | |||
| SM / SM Energy Company | 0,00 | -76,16 | 0,02 | -80,53 | 0,0069 | -0,0295 | |||
| TDS / Telephone and Data Systems, Inc. | 0,00 | 0,00 | 0,02 | -8,70 | 0,0067 | -0,0009 | |||
| BLD / TopBuild Corp. | 0,00 | 0,00 | 0,02 | 5,26 | 0,0063 | 0,0001 | |||
| TDW / Tidewater Inc. | 0,00 | 0,00 | 0,02 | 11,76 | 0,0060 | 0,0003 | |||
| HOG / Harley-Davidson, Inc. | 0,00 | -68,35 | 0,02 | -70,49 | 0,0056 | -0,0142 | |||
| RGTI / Rigetti Computing, Inc. | 0,00 | 0,00 | 0,02 | 50,00 | 0,0056 | 0,0017 | |||
| AVT / Avnet, Inc. | 0,00 | 0,00 | 0,02 | 14,29 | 0,0051 | 0,0003 | |||
| PBF / PBF Energy Inc. | 0,00 | -46,15 | 0,02 | -38,46 | 0,0050 | -0,0035 | |||
| LLYVA / Liberty Live Group | 0,00 | 0,00 | 0,02 | 15,38 | 0,0049 | 0,0006 | |||
| WTFC / Wintrust Financial Corporation | 0,00 | 0,00 | 0,02 | 7,14 | 0,0048 | 0,0003 | |||
| SPR / Spirit AeroSystems Holdings, Inc. | 0,00 | 0,00 | 0,01 | 7,69 | 0,0046 | 0,0003 | |||
| GME / GameStop Corp. | 0,00 | -68,61 | 0,01 | -66,67 | 0,0045 | -0,0092 | |||
| BL / BlackLine, Inc. | 0,00 | -64,33 | 0,01 | -58,82 | 0,0045 | -0,0066 | |||
| PRVA / Privia Health Group, Inc. | 0,00 | 0,00 | 0,01 | 0,00 | 0,0042 | -0,0001 | |||
| MAT / Mattel, Inc. | 0,00 | -71,44 | 0,01 | -71,74 | 0,0042 | -0,0109 | |||
| S / SentinelOne, Inc. | 0,00 | -74,58 | 0,01 | -76,00 | 0,0040 | -0,0122 | |||
| TCBI / Texas Capital Bancshares, Inc. | 0,00 | 0,00 | 0,01 | 9,09 | 0,0039 | 0,0001 | |||
| MTSR / Metsera, Inc. | 0,00 | 0,00 | 0,01 | 0,00 | 0,0033 | 0,0000 | |||
| CRCT / Cricut, Inc. | 0,00 | 0,00 | 0,01 | 28,57 | 0,0030 | 0,0006 | |||
| JANX / Janux Therapeutics, Inc. | 0,00 | 0,00 | 0,01 | -22,22 | 0,0025 | -0,0005 | |||
| SWX / Southwest Gas Holdings, Inc. | 0,00 | 0,00 | 0,01 | 25,00 | 0,0016 | -0,0000 | |||
| MAGN / Magnera Corporation | 0,00 | 0,00 | 0,00 | -33,33 | 0,0013 | -0,0007 | |||
| HPP / Hudson Pacific Properties, Inc. | 0,00 | 0,00 | 0,00 | 0,00 | 0,0013 | -0,0002 | |||
| GRAL / GRAIL, Inc. | 0,00 | 0,00 | 0,00 | 200,00 | 0,0011 | 0,0005 | |||
| OPEN / Opendoor Technologies Inc. | 0,00 | 0,00 | 0,00 | -50,00 | 0,0008 | -0,0008 | |||
| MU / Micron Technology, Inc. - Depositary Receipt (Common Stock) | 0,00 | 0,0006 | 0,0006 | ||||||
| CLVT / Clarivate Plc | 0,00 | 0,00 | 0,00 | 0,00 | 0,0006 | 0,0000 | |||
| AMC / AMC Entertainment Holdings, Inc. | 0,00 | 0,00 | 0,00 | 0,0000 | 0,0000 | ||||
| IMVT / Immunovant, Inc. | 0,00 | -100,00 | 0,00 | -100,00 | -0,0068 | ||||
| NNE / NANO Nuclear Energy Inc. | 0,00 | -100,00 | 0,00 | -100,00 | -0,0029 | ||||
| COTY / Coty Inc. | 0,00 | -100,00 | 0,00 | -100,00 | -0,0185 | ||||
| ITCI / Intra-Cellular Therapies, Inc. | 0,00 | -100,00 | 0,00 | -100,00 | -0,0182 | ||||
| NVAX / Novavax, Inc. | 0,00 | -100,00 | 0,00 | -100,00 | -0,0060 | ||||
| ITRI / Itron, Inc. | 0,00 | -100,00 | 0,00 | -100,00 | -0,0196 | ||||
| APPF / AppFolio, Inc. | 0,00 | -100,00 | 0,00 | -100,00 | -0,0319 | ||||
| GERN / Geron Corporation | 0,00 | -100,00 | 0,00 | -100,00 | -0,0055 | ||||
| AAP / Advance Auto Parts, Inc. | 0,00 | -100,00 | 0,00 | -100,00 | -0,0263 | ||||
| PRCT / PROCEPT BioRobotics Corporation | 0,00 | -100,00 | 0,00 | -100,00 | -0,0118 | ||||
| FOUR / Shift4 Payments, Inc. | 0,00 | -100,00 | 0,00 | -100,00 | -0,0084 | ||||
| INSM / Insmed Incorporated | 0,00 | -100,00 | 0,00 | -100,00 | -0,0066 | ||||
| TGTX / TG Therapeutics, Inc. | 0,00 | -100,00 | 0,00 | -100,00 | -0,0107 | ||||
| AXSM / Axsome Therapeutics, Inc. | 0,00 | -100,00 | 0,00 | -100,00 | -0,0076 | ||||
| POWL / Powell Industries, Inc. | 0,00 | -100,00 | 0,00 | -100,00 | -0,0046 | ||||
| POWL / Powell Industries, Inc. | 0,00 | -100,00 | 0,00 | -100,00 | -0,0046 | ||||
| AAON / AAON, Inc. | 0,00 | -100,00 | 0,00 | -100,00 | -0,0073 | ||||
| NSIT / Insight Enterprises, Inc. | 0,00 | -100,00 | 0,00 | -100,00 | -0,0064 | ||||
| ALGM / Allegro MicroSystems, Inc. | 0,00 | -100,00 | 0,00 | -100,00 | -0,0046 | ||||
| SG / Sweetgreen, Inc. | 0,00 | -100,00 | 0,00 | -100,00 | -0,0060 | ||||
| NSIT / Insight Enterprises, Inc. | 0,00 | -100,00 | 0,00 | -100,00 | -0,0064 | ||||
| TFX / Teleflex Incorporated | 0,00 | -100,00 | 0,00 | -100,00 | -0,0857 | ||||
| IMVT / Immunovant, Inc. | 0,00 | -100,00 | 0,00 | -100,00 | -0,0068 | ||||
| SWTX / SpringWorks Therapeutics, Inc. | 0,00 | -100,00 | 0,00 | -100,00 | -0,0083 | ||||
| AUR / Aurora Innovation, Inc. | 0,00 | -100,00 | 0,00 | -100,00 | -0,0036 | ||||
| SPSC / SPS Commerce, Inc. | 0,00 | -100,00 | 0,00 | -100,00 | -0,0165 | ||||
| COLD / Americold Realty Trust, Inc. | 0,00 | -100,00 | 0,00 | -100,00 | -0,0457 | ||||
| CFLT / Confluent, Inc. | 0,00 | -100,00 | 0,00 | -100,00 | -0,0202 | ||||
| TNET / TriNet Group, Inc. | 0,00 | -100,00 | 0,00 | -100,00 | -0,0202 | ||||
| NSP / Insperity, Inc. | 0,00 | -100,00 | 0,00 | -100,00 | -0,0332 | ||||
| ORCL / Oracle Corporation - Depositary Receipt (Common Stock) | -0,03 | -0,0084 | -0,0084 | ||||||
| S&P 500 Index / DE (N/A) | -0,18 | -0,0543 | -0,0543 | ||||||
| S&P 500 Index / DE (N/A) | -0,25 | -0,0762 | -0,0762 | ||||||
| S&P 500 Index / DE (N/A) | -0,71 | -0,2191 | -0,2191 | ||||||
| S&P 500 Index / DE (N/A) | -5,22 | -1,6148 | -1,6148 |