Grundlæggende statistik
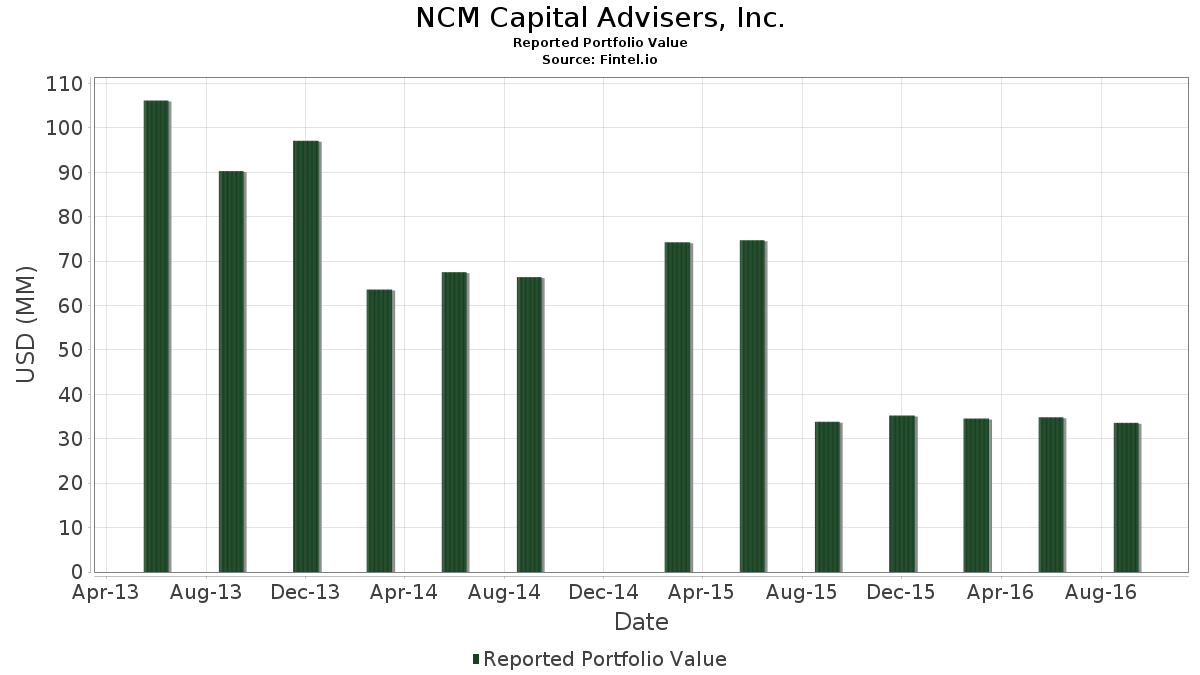
| Porteføljeværdi | $ 33.585.000 |
| Nuværende stillinger | 76 |
Seneste beholdninger, ydeevne, AUM (fra 13F, 13D)
NCM Capital Advisers, Inc. har afsløret 76 samlede besiddelser i deres seneste SEC-arkivering. Den seneste porteføljeværdi er beregnet til at være $ 33.585.000 USD. Faktiske aktiver under forvaltning (AUM) er denne værdi plus kontanter (som ikke er oplyst). NCM Capital Advisers, Inc.s største beholdninger er Skyworks Solutions, Inc. (US:SWKS) , Fortinet, Inc. (US:FTNT) , Masco Corporation (US:MAS) , Juniper Networks, Inc. (US:JNPR) , and Cardinal Health, Inc. (US:CAH) .
Top øger dette kvartal
Vi bruger ændringen i porteføljeallokeringen, fordi dette er den mest meningsfulde metrik. Ændringer kan skyldes handler eller ændringer i aktiekurser.
| Sikkerhed | Aktier (MM) |
Værdi (MM$) |
Portefølje % | ΔPortefølje % |
|---|---|---|---|---|
| 0,03 | 0,60 | 1,8014 | 1,8014 | |
| 0,01 | 0,54 | 1,6168 | 1,6168 | |
| 0,01 | 0,51 | 1,5066 | 1,5066 | |
| 0,00 | 0,43 | 1,2952 | 1,2952 | |
| 0,02 | 0,41 | 1,2357 | 1,2357 | |
| 0,03 | 0,41 | 1,2208 | 1,2208 | |
| 0,01 | 0,31 | 0,9111 | 0,9111 | |
| 0,02 | 0,27 | 0,7950 | 0,7950 | |
| 0,01 | 0,25 | 0,7325 | 0,7325 | |
| 0,02 | 1,62 | 4,8355 | 0,7211 |
Top falder i dette kvartal
Vi bruger ændringen i porteføljeallokeringen, fordi dette er den mest meningsfulde metrik. Ændringer kan skyldes handler eller ændringer i aktiekurser.
| Sikkerhed | Aktier (MM) |
Værdi (MM$) |
Portefølje % | ΔPortefølje % |
|---|---|---|---|---|
| 0,00 | 0,38 | 1,1285 | -0,7062 | |
| 0,00 | 0,55 | 1,6436 | -0,5672 | |
| 0,01 | 0,62 | 1,8520 | -0,3875 | |
| 0,00 | 0,00 | -0,3043 | ||
| 0,01 | 0,78 | 2,3284 | -0,2958 | |
| 0,01 | 0,69 | 2,0694 | -0,2649 | |
| 0,01 | 0,60 | 1,7954 | -0,2373 | |
| 0,00 | 0,29 | 0,8754 | -0,2013 | |
| 0,01 | 0,66 | 1,9562 | -0,1713 | |
| 0,01 | 0,40 | 1,1851 | -0,1644 |
13F og Fondsarkivering
Denne formular blev indsendt den 2016-11-07 for rapporteringsperioden 2016-09-30. Klik på linkikonet for at se den fulde transaktionshistorik.
Opgrader for at låse op for premium-data og eksportere til Excel ![]() .
.
| Sikkerhed | Type | Gennemsnitlig aktiekurs | Aktier (MM) |
Δ Aktier (%) |
Δ Aktier (%) |
Værdi ($MM) |
Portefølje (%) |
ΔPortefølje (%) |
|
|---|---|---|---|---|---|---|---|---|---|
| SWKS / Skyworks Solutions, Inc. | 0,02 | -5,82 | 1,62 | 13,33 | 4,8355 | 0,7211 | |||
| FTNT / Fortinet, Inc. | 0,04 | -6,12 | 1,36 | 9,78 | 4,0435 | 0,4918 | |||
| MAS / Masco Corporation | 0,02 | -6,11 | 0,84 | 4,08 | 2,5071 | 0,1843 | |||
| JNPR / Juniper Networks, Inc. | 0,03 | -6,64 | 0,82 | -0,12 | 2,4505 | 0,0847 | |||
| CAH / Cardinal Health, Inc. | 0,01 | -6,15 | 0,82 | -6,53 | 2,4297 | -0,0769 | |||
| UHS / Universal Health Services, Inc. | 0,01 | -6,86 | 0,78 | -14,44 | 2,3284 | -0,2958 | |||
| RHT / Red Hat, Inc. | 0,01 | -5,94 | 0,75 | 4,77 | 2,2242 | 0,1771 | |||
| EXPE / Expedia Group, Inc. | 0,01 | -7,07 | 0,74 | 2,06 | 2,2153 | 0,1222 | |||
| INTU / Intuit Inc. | 0,01 | -6,18 | 0,71 | -7,51 | 2,1259 | -0,0906 | |||
| ROST / Ross Stores, Inc. | 0,01 | -17,25 | 0,70 | -6,16 | 2,0872 | -0,0575 | |||
| ACC / American Campus Communities Inc. | 0,01 | -11,06 | 0,69 | -14,51 | 2,0694 | -0,2649 | |||
| IPG / The Interpublic Group of Companies, Inc. | 0,03 | -6,23 | 0,66 | -9,19 | 1,9711 | -0,1220 | |||
| SEIC / SEI Investments Company | 0,01 | -6,51 | 0,66 | -11,34 | 1,9562 | -0,1713 | |||
| CERN / Cerner Corp. | 0,01 | -7,17 | 0,64 | -2,13 | 1,9116 | 0,0281 | |||
| AMAT / Applied Materials, Inc. | 0,02 | -6,19 | 0,63 | 17,88 | 1,8848 | 0,3430 | |||
| PVH / PVH Corp. | 0,01 | -6,02 | 0,62 | 10,05 | 1,8580 | 0,2300 | |||
| MMC / Marsh & McLennan Companies, Inc. | 0,01 | -18,81 | 0,62 | -20,26 | 1,8520 | -0,3875 | |||
| ALB / Albemarle Corporation | 0,01 | -6,57 | 0,61 | 0,66 | 1,8074 | 0,0760 | |||
| SFM / Sprouts Farmers Market, Inc. | 0,03 | 46,19 | 0,60 | 31,81 | 1,8014 | 1,8014 | |||
| MAR / Marriott International, Inc. | 0,01 | -5,28 | 0,60 | -4,13 | 1,7984 | -0,0104 | |||
| H / Hyatt Hotels Corporation | 0,01 | -14,96 | 0,60 | -14,83 | 1,7954 | -0,2373 | |||
| DAL / Delta Air Lines, Inc. | 0,02 | -6,08 | 0,60 | 1,36 | 1,7806 | 0,0866 | |||
| MAN / ManpowerGroup Inc. | 0,01 | -6,65 | 0,58 | 4,84 | 1,7418 | 0,1397 | |||
| DISCA / Discovery Inc - Class A | 0,02 | -6,11 | 0,58 | 0,17 | 1,7240 | 0,0644 | |||
| AMG / Affiliated Managers Group, Inc. | 0,00 | -8,36 | 0,56 | -5,75 | 1,6585 | -0,0384 | |||
| AAP / Advance Auto Parts, Inc. | 0,00 | -22,29 | 0,55 | -28,31 | 1,6436 | -0,5672 | |||
| SCI / Service Corporation International | 0,02 | 18,30 | 0,55 | 16,21 | 1,6436 | 0,2798 | |||
| WSM / Williams-Sonoma, Inc. | 0,01 | -6,17 | 0,54 | -8,11 | 1,6198 | -0,0800 | |||
| LSI / Life Storage Inc - Registered Shares | 0,01 | 7,34 | 0,54 | -8,89 | 1,6168 | 1,6168 | |||
| THO / THOR Industries, Inc. | 0,01 | -18,18 | 0,53 | 7,23 | 1,5900 | 0,1602 | |||
| ROK / Rockwell Automation, Inc. | 0,00 | -5,17 | 0,53 | 0,95 | 1,5840 | 0,0709 | |||
| URI / United Rentals, Inc. | 0,01 | -6,62 | 0,52 | 9,28 | 1,5424 | 0,1814 | |||
| CAKE / The Cheesecake Factory Incorporated | 0,01 | 9,78 | 0,51 | 14,22 | 1,5066 | 1,5066 | |||
| REGN / Regeneron Pharmaceuticals, Inc. | 0,00 | -8,75 | 0,48 | 5,01 | 1,4352 | 0,1173 | |||
| CRS / Carpenter Technology Corporation | 0,01 | -7,25 | 0,47 | 16,21 | 1,3875 | 0,2362 | |||
| TSN / Tyson Foods, Inc. | 0,01 | -7,20 | 0,46 | 3,64 | 1,3548 | 0,0943 | |||
| VRSK / Verisk Analytics, Inc. | 0,01 | -5,22 | 0,44 | -4,94 | 1,3190 | -0,0189 | |||
| LUV / Southwest Airlines Co. | 0,01 | -6,53 | 0,44 | -7,23 | 1,2982 | -0,0513 | |||
| ISRG / Intuitive Surgical, Inc. | 0,00 | -0,66 | 0,43 | 9,02 | 1,2952 | 1,2952 | |||
| THC / Tenet Healthcare Corporation | 0,02 | -6,80 | 0,41 | -23,57 | 1,2357 | 1,2357 | |||
| US2243991054 / Crane Co. | 0,01 | -7,35 | 0,41 | 3,02 | 1,2208 | 0,0781 | |||
| TPH / Tri Pointe Homes, Inc. | 0,03 | -6,84 | 0,41 | 3,80 | 1,2208 | 1,2208 | |||
| MD / Pediatrix Medical Group, Inc. | 0,01 | -7,56 | 0,40 | -15,32 | 1,1851 | -0,1644 | |||
| SIG / Signet Jewelers Limited | 0,01 | -6,78 | 0,38 | -15,74 | 1,1315 | -0,1634 | |||
| MJN / Mead Johnson Nutrition Co. | 0,00 | -31,88 | 0,38 | -40,69 | 1,1285 | -0,7062 | |||
| TDC / Teradata Corporation | 0,01 | -6,57 | 0,35 | 15,28 | 1,0332 | 0,1690 | |||
| EMN / Eastman Chemical Company | 0,01 | -5,97 | 0,34 | -6,25 | 1,0272 | -0,0293 | |||
| J / Jacobs Solutions Inc. | 0,01 | -6,87 | 0,34 | -3,14 | 1,0094 | 0,0045 | |||
| PAYX / Paychex, Inc. | 0,01 | -5,81 | 0,33 | -8,19 | 0,9677 | -0,0487 | |||
| LVLT / Level 3 Financing Inc. - Corporate Bond/Note | 0,01 | -7,16 | 0,31 | -16,39 | 0,9111 | 0,9111 | |||
| DVA / DaVita Inc. | 0,00 | -8,13 | 0,29 | -21,60 | 0,8754 | -0,2013 | |||
| ROP / Roper Technologies, Inc. | 0,00 | -5,88 | 0,29 | 0,69 | 0,8694 | 0,0368 | |||
| CHD / Church & Dwight Co., Inc. | 0,01 | 86,43 | 0,29 | -13,35 | 0,8694 | -0,0981 | |||
| SCS / Steelcase Inc. | 0,02 | -6,08 | 0,27 | -3,61 | 0,7950 | 0,7950 | |||
| KDP / Keurig Dr Pepper Inc. | 0,00 | -7,53 | 0,27 | -12,54 | 0,7890 | -0,0809 | |||
| ARNC / Arconic Corporation | 0,03 | -6,66 | 0,26 | 2,37 | 0,7712 | 0,0448 | |||
| EXPD / Expeditors International of Washington, Inc. | 0,00 | -6,49 | 0,25 | -1,98 | 0,7354 | 0,0119 | |||
| HAIN / The Hain Celestial Group, Inc. | 0,01 | -6,72 | 0,25 | -33,15 | 0,7325 | 0,7325 | |||
| UTHR / United Therapeutics Corporation | 0,00 | -7,21 | 0,20 | 3,61 | 0,5985 | 0,0415 | |||
| IR / Ingersoll Rand Inc. | 0,00 | -6,78 | 0,19 | -0,53 | 0,5568 | 0,0170 | |||
| FTI / TechnipFMC plc | 0,01 | -6,23 | 0,17 | 4,17 | 0,5211 | 0,0387 | |||
| IP / International Paper Company | 0,00 | -8,38 | 0,15 | 3,42 | 0,4496 | 0,0304 | |||
| FAST / Fastenal Company | 0,00 | -5,26 | 0,15 | -11,24 | 0,4466 | -0,0386 | |||
| ARE / Alexandria Real Estate Equities, Inc. | 0,00 | 961,95 | 0,13 | 991,67 | 0,3901 | 0,3556 | |||
| IAC / IAC Inc. | 0,00 | -11,58 | 0,12 | -1,59 | 0,3692 | 0,0074 | |||
| US00C4U1L353 / Mylan N.V. | 0,00 | -7,30 | 0,12 | -18,12 | 0,3633 | -0,0645 | |||
| HFC / HollyFrontier Corp | 0,00 | -8,13 | 0,11 | -5,17 | 0,3275 | -0,0055 | |||
| CCK / Crown Holdings, Inc. | 0,00 | -13,75 | 0,09 | -3,19 | 0,2710 | 0,0011 | |||
| US74733V1008 / QEP Resources, Inc. | 0,00 | -6,25 | 0,09 | 3,53 | 0,2620 | 0,0180 | |||
| CF / CF Industries Holdings, Inc. | 0,00 | -7,08 | 0,08 | -6,02 | 0,2322 | -0,0061 | |||
| US6550441058 / Noble Energy, Inc. | 0,00 | -12,35 | 0,07 | -12,79 | 0,2233 | -0,0236 | |||
| OII / Oceaneering International, Inc. | 0,00 | -8,11 | 0,07 | -15,12 | 0,2174 | -0,0296 | |||
| ALLE / Allegion plc | 0,00 | -10,17 | 0,06 | -10,29 | 0,1816 | -0,0136 | |||
| TGH / Textainer Group Holdings Limited | 0,01 | -5,99 | 0,06 | -37,08 | 0,1667 | -0,0888 | |||
| AVGO / Broadcom Inc. | 0,00 | -0,93 | 0,04 | 8,82 | 0,1102 | 0,0125 | |||
| 465685105 / ITC Holdings Corp. | 0,00 | -20,00 | 0,04 | -21,28 | 0,1102 | -0,0248 | |||
| XEC / Cimarex Energy Co. | 0,00 | -100,00 | 0,00 | -100,00 | -0,0057 | ||||
| ATO / Atmos Energy Corporation | 0,00 | -100,00 | 0,00 | -100,00 | -0,0201 | ||||
| BDX / Becton, Dickinson and Company | 0,00 | -100,00 | 0,00 | 0,0000 | 0,0000 | ||||
| RRC / Range Resources Corporation | 0,00 | -100,00 | 0,00 | -100,00 | -0,0086 | ||||
| BHI / Baker Hughes Inc. | 0,00 | -100,00 | 0,00 | -100,00 | 0,0000 | ||||
| SRE / Sempra | 0,00 | -100,00 | 0,00 | -100,00 | -0,0230 | ||||
| STI / Solidion Technology, Inc. | 0,00 | -100,00 | 0,00 | -100,00 | -0,0287 | ||||
| WMB / The Williams Companies, Inc. | 0,00 | -100,00 | 0,00 | -100,00 | 0,0000 | ||||
| CMS / CMS Energy Corporation | 0,00 | -100,00 | 0,00 | -100,00 | -0,0201 | ||||
| HXL / Hexcel Corporation | 0,00 | -100,00 | 0,00 | -100,00 | -0,0115 | ||||
| CPN / Calpine Corp. | 0,00 | -100,00 | 0,00 | -100,00 | 0,0000 | ||||
| ETN / Eaton Corporation plc | 0,00 | -100,00 | 0,00 | -100,00 | -0,0057 | ||||
| UDR / UDR, Inc. | 0,00 | -100,00 | 0,00 | -100,00 | -0,0230 | ||||
| ACGL / Arch Capital Group Ltd. | 0,00 | -100,00 | 0,00 | -100,00 | -0,0172 | ||||
| PNW / Pinnacle West Capital Corporation | 0,00 | -100,00 | 0,00 | -100,00 | -0,0115 | ||||
| COG / Cabot Oil & Gas Corp. | 0,00 | -100,00 | 0,00 | -100,00 | -0,0057 | ||||
| L / Loews Corporation | 0,00 | -100,00 | 0,00 | -100,00 | -0,0287 | ||||
| WY / Weyerhaeuser Company | 0,00 | -100,00 | 0,00 | -100,00 | -0,3043 | ||||
| EWBC / East West Bancorp, Inc. | 0,00 | -100,00 | 0,00 | -100,00 | -0,0258 |