Grundlæggende statistik
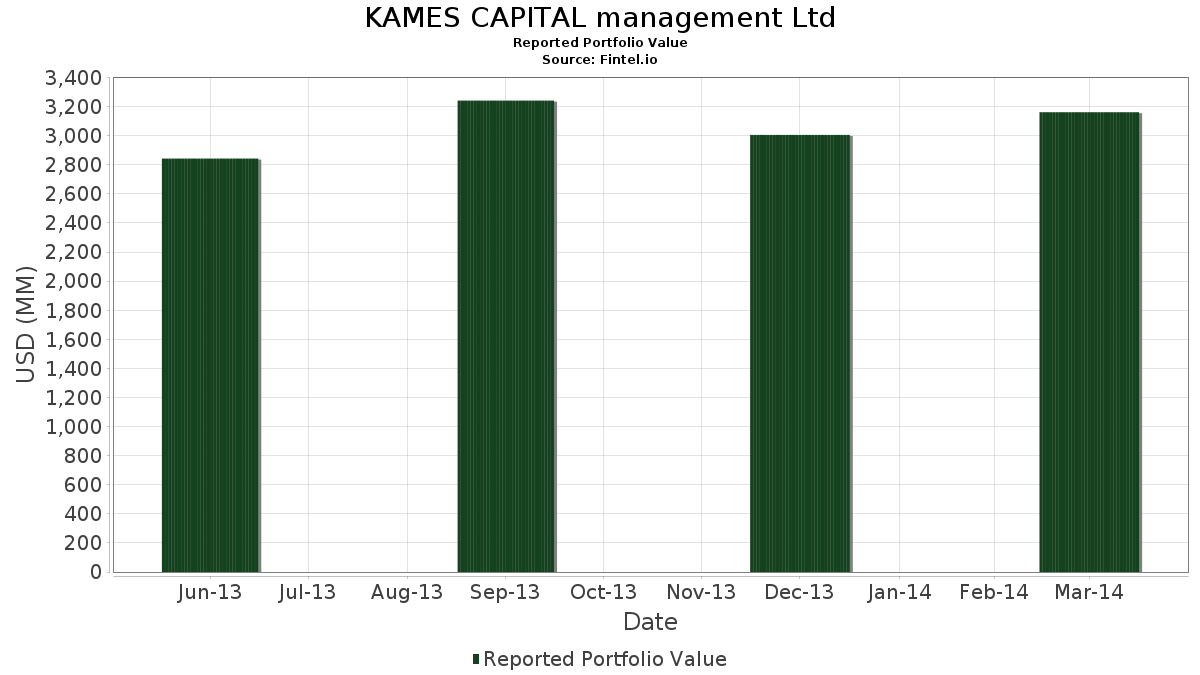
| Porteføljeværdi | $ 3.161.699.480 |
| Nuværende stillinger | 165 |
Seneste beholdninger, ydeevne, AUM (fra 13F, 13D)
KAMES CAPITAL management Ltd har afsløret 165 samlede besiddelser i deres seneste SEC-arkivering. Den seneste porteføljeværdi er beregnet til at være $ 3.161.699.480 USD. Faktiske aktiver under forvaltning (AUM) er denne værdi plus kontanter (som ikke er oplyst). KAMES CAPITAL management Ltds største beholdninger er Verizon Communications Inc. (US:VZ) , iShares, Inc. - iShares MSCI Emerging Markets ETF (US:EEM) , Alphabet Inc. (US:GOOGL) , AbbVie Inc. (US:ABBV) , and Merck & Co., Inc. (US:MRK) . KAMES CAPITAL management Ltds nye stillinger omfatter Cabot Oil & Gas Corp. (US:COG) , General Dynamics Corporation (US:GD) , Tata Motors Ltd. - ADR (US:TTM) , Meta Platforms, Inc. (US:META) , and Knowles Corporation (US:KN) .
Top øger dette kvartal
Vi bruger ændringen i porteføljeallokeringen, fordi dette er den mest meningsfulde metrik. Ændringer kan skyldes handler eller ændringer i aktiekurser.
| Sikkerhed | Aktier (MM) |
Værdi (MM$) |
Portefølje % | ΔPortefølje % |
|---|---|---|---|---|
| 3,12 | 148,82 | 4,7071 | 4,6458 | |
| 1,92 | 98,60 | 3,1186 | 2,0919 | |
| 0,68 | 53,99 | 1,7078 | 1,5606 | |
| 0,64 | 51,32 | 1,6232 | 1,5587 | |
| 0,56 | 39,75 | 1,2574 | 1,1697 | |
| 0,56 | 36,41 | 1,1517 | 1,1089 | |
| 0,62 | 21,13 | 0,6682 | 0,6682 | |
| 0,28 | 22,63 | 0,7157 | 0,6122 | |
| 0,10 | 13,43 | 0,4249 | 0,3814 | |
| 1,67 | 94,68 | 2,9945 | 0,3043 |
Top falder i dette kvartal
Vi bruger ændringen i porteføljeallokeringen, fordi dette er den mest meningsfulde metrik. Ændringer kan skyldes handler eller ændringer i aktiekurser.
| Sikkerhed | Aktier (MM) |
Værdi (MM$) |
Portefølje % | ΔPortefølje % |
|---|---|---|---|---|
| 1,06 | 34,02 | 1,0759 | -2,4732 | |
| 0,71 | 83,97 | 2,6558 | -1,1574 | |
| 0,00 | 0,00 | -1,0886 | ||
| 0,02 | 0,88 | 0,0279 | -0,7506 | |
| 0,03 | 2,01 | 0,0636 | -0,7460 | |
| 0,13 | 72,10 | 2,2803 | -0,6065 | |
| 2,76 | 61,76 | 1,9533 | -0,5332 | |
| 0,00 | 0,00 | -0,4425 | ||
| 0,96 | 78,56 | 2,4848 | -0,4076 | |
| 0,74 | 53,84 | 1,7028 | -0,3629 |
13F og Fondsarkivering
Denne formular blev indsendt den 2014-05-01 for rapporteringsperioden 2014-03-31. Klik på linkikonet for at se den fulde transaktionshistorik.
Opgrader for at låse op for premium-data og eksportere til Excel ![]() .
.
| Sikkerhed | Type | Gennemsnitlig aktiekurs | Aktier (MM) |
Δ Aktier (%) |
Δ Aktier (%) |
Værdi ($MM) |
Portefølje (%) |
ΔPortefølje (%) |
|
|---|---|---|---|---|---|---|---|---|---|
| VZ / Verizon Communications Inc. | 3,12 | 8.219,73 | 148,82 | 7.975,09 | 4,7071 | 4,6458 | |||
| EEM / iShares, Inc. - iShares MSCI Emerging Markets ETF | 3,21 | 0,00 | 131,83 | -1,89 | 4,1695 | -0,3010 | |||
| GOOGL / Alphabet Inc. | 0,11 | 0,88 | 117,11 | 0,38 | 3,7039 | -0,1774 | |||
| ABBV / AbbVie Inc. | 1,92 | 228,21 | 98,60 | 219,51 | 3,1186 | 2,0919 | |||
| MRK / Merck & Co., Inc. | 1,67 | 3,22 | 94,68 | 17,09 | 2,9945 | 0,3043 | |||
| CVX / Chevron Corporation | 0,71 | -23,03 | 83,97 | -26,74 | 2,6558 | -1,1574 | |||
| EMR / Emerson Electric Co. | 1,21 | -2,18 | 80,61 | -6,89 | 2,5496 | -0,3310 | |||
| PM / Philip Morris International Inc. | 0,96 | -3,84 | 78,56 | -9,63 | 2,4848 | -0,4076 | |||
| AAPL / Apple Inc. | 0,13 | -13,15 | 72,10 | -16,91 | 2,2803 | -0,6065 | |||
| RTX / RTX Corporation | 0,61 | -1,60 | 71,21 | 1,03 | 2,2522 | -0,0927 | |||
| SLB / Schlumberger Limited | 0,71 | 2,14 | 69,66 | 10,53 | 2,2032 | 0,1063 | |||
| AXP / American Express Company | 0,76 | 1,89 | 68,03 | 1,11 | 2,1516 | -0,0868 | |||
| CSCO / Cisco Systems, Inc. | 2,76 | -17,25 | 61,76 | -17,37 | 1,9533 | -0,5332 | |||
| COO / The Cooper Companies, Inc. | 0,42 | 1,45 | 57,15 | 12,56 | 1,8076 | 0,1183 | |||
| IBM / International Business Machines Corporation | 0,29 | -5,54 | 56,74 | -2,90 | 1,7947 | -0,1495 | |||
| CMCSA / Comcast Corporation | 1,12 | 1,61 | 56,21 | -2,19 | 1,7778 | -0,1341 | |||
| QCOM / QUALCOMM Incorporated | 0,68 | 1.049,22 | 53,99 | 1.120,76 | 1,7078 | 1,5606 | |||
| OMC / Omnicom Group Inc. | 0,74 | -11,16 | 53,84 | -13,29 | 1,7028 | -0,3629 | |||
| 61166W101 / Monsanto Co. | 0,46 | 25,91 | 52,33 | 22,91 | 1,6551 | 0,2385 | |||
| AFL / Aflac Incorporated | 0,82 | -0,01 | 51,82 | -5,62 | 1,6389 | -0,1878 | |||
| TJX / The TJX Companies, Inc. | 0,85 | 1,83 | 51,71 | -3,09 | 1,6355 | -0,1398 | |||
| DIS / The Walt Disney Company | 0,64 | 2.426,96 | 51,32 | 2.549,41 | 1,6232 | 1,5587 | |||
| AZO / AutoZone, Inc. | 0,09 | -0,01 | 47,19 | 12,31 | 1,4927 | 0,0946 | |||
| WMT / Walmart Inc. | 0,60 | -1,22 | 46,01 | -4,05 | 1,4551 | -0,1401 | |||
| HP / Helmerich & Payne, Inc. | 0,42 | -0,00 | 45,57 | 27,94 | 1,4415 | 0,2563 | |||
| PII / Polaris Inc. | 0,32 | -2,96 | 44,21 | -6,86 | 1,3984 | -0,1810 | |||
| ABT / Abbott Laboratories | 1,10 | -0,01 | 42,40 | 0,49 | 1,3410 | -0,0628 | |||
| JPM / JPMorgan Chase & Co. | 0,70 | -5,10 | 42,23 | -1,47 | 1,3356 | -0,0903 | |||
| AME / AMETEK, Inc. | 0,82 | -0,01 | 42,12 | -2,23 | 1,3323 | -0,1011 | |||
| CELG / Celgene Corp. | 0,30 | -0,01 | 41,76 | -17,34 | 1,3207 | -0,3600 | |||
| GILD / Gilead Sciences, Inc. | 0,56 | 1.499,27 | 39,75 | 1.408,12 | 1,2574 | 1,1697 | |||
| V / Visa Inc. | 0,18 | -0,00 | 38,20 | -3,12 | 1,2082 | -0,1037 | |||
| JNJ / Johnson & Johnson | 0,38 | -6,59 | 36,94 | 0,20 | 1,1684 | -0,0583 | |||
| CL / Colgate-Palmolive Company | 0,56 | 2.744,43 | 36,41 | 2.731,57 | 1,1517 | 1,1089 | |||
| MJN / Mead Johnson Nutrition Co. | 0,41 | 1,04 | 34,32 | 0,30 | 1,0856 | -0,0530 | |||
| PFE / Pfizer Inc. | 1,06 | -69,60 | 34,02 | -68,11 | 1,0759 | -2,4732 | |||
| UNP / Union Pacific Corporation | 0,18 | -21,43 | 33,14 | -12,22 | 1,0482 | -0,2079 | |||
| HBAN / Huntington Bancshares Incorporated | 3,20 | 2,02 | 31,86 | 5,51 | 1,0076 | 0,0030 | |||
| WDC / Western Digital Corporation | 0,34 | 8,32 | 31,48 | 18,54 | 0,9955 | 0,1121 | |||
| MSFT / Microsoft Corporation | 0,75 | 0,00 | 30,79 | 9,57 | 0,9738 | 0,0389 | |||
| MMC / Marsh & McLennan Companies, Inc. | 0,61 | -0,00 | 30,25 | 1,92 | 0,9569 | -0,0307 | |||
| LMT / Lockheed Martin Corporation | 0,18 | -7,24 | 30,09 | 1,87 | 0,9515 | -0,0310 | |||
| TUP / Tupperware Brands Corporation | 0,36 | -0,13 | 30,07 | -11,53 | 0,9509 | -0,1798 | |||
| DTV / DTE Energy Company | 0,37 | -27,91 | 28,46 | -20,26 | 0,9003 | -0,2874 | |||
| IT / Gartner, Inc. | 0,39 | 1,95 | 27,00 | -0,38 | 0,8541 | -0,0478 | |||
| ODFL / Old Dominion Freight Line, Inc. | 0,47 | -0,01 | 26,67 | 7,03 | 0,8435 | 0,0145 | |||
| SWKS / Skyworks Solutions, Inc. | 0,69 | -16,98 | 26,02 | 9,11 | 0,8231 | 0,0295 | |||
| CMI / Cummins Inc. | 0,16 | -21,34 | 23,32 | -16,86 | 0,7375 | -0,1956 | |||
| PG / The Procter & Gamble Company | 0,28 | 634,51 | 22,63 | 627,32 | 0,7157 | 0,6122 | |||
| AJG / Arthur J. Gallagher & Co. | 0,47 | 24,47 | 22,15 | 26,14 | 0,7007 | 0,1163 | |||
| COG / Cabot Oil & Gas Corp. | 0,62 | 21,13 | 0,6682 | 0,6682 | |||||
| WFC / Wells Fargo & Company | 0,38 | 0,00 | 19,06 | 9,58 | 0,6029 | 0,0242 | |||
| US0325111070 / Anadarko Petroleum Corp. | 0,22 | -0,01 | 18,99 | 6,88 | 0,6006 | 0,0095 | |||
| MPC / Marathon Petroleum Corporation | 0,21 | -28,78 | 18,66 | -32,42 | 0,5903 | -0,3286 | |||
| GHL / Greenhill & Co Inc | 0,36 | 1,64 | 18,66 | -8,81 | 0,5901 | -0,0906 | |||
| XOM / Exxon Mobil Corporation | 0,19 | 0,00 | 18,25 | -3,47 | 0,5773 | -0,0519 | |||
| MAT / Mattel, Inc. | 0,45 | -13,50 | 17,90 | -27,09 | 0,5661 | -0,2506 | |||
| DOV / Dover Corporation | 0,20 | -9,22 | 16,72 | -23,16 | 0,5287 | -0,1951 | |||
| LLTC / Linear Technology Corp. | 0,34 | 4,72 | 16,52 | 11,94 | 0,5226 | 0,0315 | |||
| 57772K101 / Maxim Integrated Products Inc. | 0,49 | -12,44 | 16,31 | 3,95 | 0,5158 | -0,0062 | |||
| T / AT&T Inc. | 0,43 | 0,00 | 15,04 | -0,20 | 0,4757 | -0,0257 | |||
| MCD / McDonald's Corporation | 0,15 | -9,39 | 14,76 | -8,44 | 0,4669 | -0,0695 | |||
| LHX / L3Harris Technologies, Inc. | 0,20 | -43,88 | 14,30 | -41,21 | 0,4522 | -0,3569 | |||
| MMM / 3M Company | 0,10 | 738,70 | 13,43 | 852,77 | 0,4249 | 0,3814 | |||
| MTD / Mettler-Toledo International Inc. | 0,06 | 0,00 | 13,35 | -2,85 | 0,4221 | -0,0350 | |||
| GPC / Genuine Parts Company | 0,14 | 32,83 | 12,42 | 38,68 | 0,3929 | 0,0948 | |||
| ADP / Automatic Data Processing, Inc. | 0,16 | 8,80 | 12,22 | 4,03 | 0,3866 | -0,0043 | |||
| ORCL / Oracle Corporation | 0,30 | 0,00 | 12,16 | 7,19 | 0,3845 | 0,0071 | |||
| TSM / Taiwan Semiconductor Manufacturing Company Limited - Depositary Receipt (Common Stock) | 0,54 | -18,89 | 10,73 | -6,89 | 0,3394 | -0,0440 | |||
| RAI / Reynolds American, Inc. | 0,20 | -50,54 | 10,70 | -47,12 | 0,3385 | -0,3349 | |||
| GD / General Dynamics Corporation | 0,09 | 9,37 | 0,2962 | 0,2962 | |||||
| CLX / The Clorox Company | 0,10 | 0,00 | 8,53 | -5,15 | 0,2699 | -0,0294 | |||
| TTM / Tata Motors Ltd. - ADR | 0,23 | 8,28 | 0,2618 | 0,2618 | |||||
| CTSH / Cognizant Technology Solutions Corporation | 0,12 | 200,16 | 6,19 | 50,40 | 0,1958 | 0,0588 | |||
| VIPS / Vipshop Holdings Limited - Depositary Receipt (Common Stock) | 0,04 | -57,36 | 5,97 | -23,96 | 0,1888 | -0,0724 | |||
| LEG / Leggett & Platt, Incorporated | 0,17 | 0,00 | 5,56 | 5,46 | 0,1758 | 0,0004 | |||
| ADS / Bread Financial Holdings Inc | 0,02 | -13,03 | 5,34 | -9,87 | 0,1690 | -0,0283 | |||
| INTU / Intuit Inc. | 0,07 | 0,00 | 5,28 | 1,85 | 0,1671 | -0,0055 | |||
| BKNG / Booking Holdings Inc. | 0,00 | -0,57 | 4,95 | 1,92 | 0,1565 | -0,0050 | |||
| FEIC / FEI Company | 0,05 | 0,00 | 4,91 | 15,30 | 0,1554 | 0,0136 | |||
| PEG / Public Service Enterprise Group Incorporated | 0,12 | 0,00 | 4,74 | 19,14 | 0,1499 | 0,0175 | |||
| APH / Amphenol Corporation | 0,05 | 0,00 | 4,51 | 2,78 | 0,1427 | -0,0034 | |||
| HDB / HDFC Bank Limited - Depositary Receipt (Common Stock) | 0,10 | 0,00 | 4,29 | 19,18 | 0,1358 | 0,0159 | |||
| META / Meta Platforms, Inc. | 0,07 | 4,04 | 0,1277 | 0,1277 | |||||
| GE / General Electric Company | 0,14 | -8,85 | 3,67 | -15,80 | 0,1162 | -0,0290 | |||
| KN / Knowles Corporation | 0,11 | 3,47 | 0,1097 | 0,1097 | |||||
| COP / ConocoPhillips | 0,05 | 136,87 | 3,46 | 135,81 | 0,1094 | 0,0606 | |||
| BAC / Bank of America Corporation | 0,20 | 94,92 | 3,39 | 115,52 | 0,1072 | 0,0548 | |||
| MSI / Motorola Solutions, Inc. | 0,05 | -0,58 | 3,34 | -5,33 | 0,1057 | -0,0117 | |||
| BA / The Boeing Company | 0,03 | 0,00 | 3,25 | -8,06 | 0,1029 | -0,0148 | |||
| MA / Mastercard Incorporated | 0,04 | 900,00 | 3,06 | -10,60 | 0,0969 | -0,0171 | |||
| BIIB / Biogen Inc. | 0,01 | 2,98 | 0,0942 | 0,0942 | |||||
| MDT / Medtronic plc | 0,05 | 0,00 | 2,93 | 7,21 | 0,0927 | 0,0018 | |||
| BRK.B / Berkshire Hathaway Inc. | 0,02 | -35,92 | 2,88 | -32,47 | 0,0912 | -0,0508 | |||
| CVS / CVS Health Corporation | 0,04 | 0,00 | 2,66 | 4,63 | 0,0843 | -0,0004 | |||
| 19041P105 / CBS Corp. | 0,04 | 0,00 | 2,37 | -2,99 | 0,0750 | -0,0063 | |||
| 018490100 / Allergan plc | 0,02 | 0,00 | 2,26 | 11,67 | 0,0714 | 0,0041 | |||
| SYK / Stryker Corporation | 0,03 | 0,00 | 2,26 | 8,47 | 0,0713 | 0,0022 | |||
| US00C4U1L353 / Mylan N.V. | 0,05 | 0,00 | 2,23 | 12,52 | 0,0705 | 0,0046 | |||
| SWN / Southwestern Energy Company | 0,05 | 0,00 | 2,22 | 16,99 | 0,0704 | 0,0071 | |||
| ECL / Ecolab Inc. | 0,02 | 0,00 | 2,20 | 3,53 | 0,0697 | -0,0011 | |||
| FFIV / F5, Inc. | 0,02 | -33,51 | 2,20 | -21,97 | 0,0697 | -0,0242 | |||
| TRV / The Travelers Companies, Inc. | 0,03 | 0,00 | 2,18 | -6,03 | 0,0691 | -0,0082 | |||
| ROK / Rockwell Automation, Inc. | 0,02 | 0,00 | 2,11 | 5,45 | 0,0667 | 0,0001 | |||
| ZBH / Zimmer Biomet Holdings, Inc. | 0,02 | 0,00 | 2,05 | 1,53 | 0,0649 | -0,0023 | |||
| MNST / Monster Beverage Corporation | 0,03 | -91,93 | 2,01 | -91,73 | 0,0636 | -0,7460 | |||
| WYNN / Wynn Resorts, Limited | 0,01 | -21,37 | 1,95 | -10,01 | 0,0617 | -0,0104 | |||
| US21871D1037 / Corelogic Inc | 0,06 | 0,00 | 1,94 | -15,45 | 0,0613 | -0,0150 | |||
| CLR / Continental Resources Inc (OKLA) | 0,02 | 0,00 | 1,92 | 10,42 | 0,0607 | 0,0029 | |||
| WAB / Westinghouse Air Brake Technologies Corporation | 0,02 | 0,00 | 1,91 | 4,43 | 0,0604 | -0,0004 | |||
| US9300591008 / Waddell & Reed Financial, Inc. | 0,02 | 0,00 | 1,82 | 13,03 | 0,0576 | 0,0040 | |||
| TSS / Total System Services, Inc. | 0,06 | 26,12 | 1,78 | 15,22 | 0,0563 | 0,0049 | |||
| GIL / Gildan Activewear Inc. | 0,03 | 1,72 | 0,0545 | 0,0545 | |||||
| BX / Blackstone Inc. | 0,05 | 55,84 | 1,72 | 64,56 | 0,0544 | 0,0196 | |||
| BF.B / Brown-Forman Corporation | 0,02 | 45,09 | 1,70 | 72,37 | 0,0539 | 0,0210 | |||
| MDU / MDU Resources Group, Inc. | 0,05 | 48,62 | 1,70 | 66,96 | 0,0537 | 0,0199 | |||
| VNTV / Vantiv, Inc. | 0,06 | 0,00 | 1,70 | -7,42 | 0,0537 | -0,0073 | |||
| HD / The Home Depot, Inc. | 0,02 | -30,90 | 1,69 | -33,58 | 0,0534 | -0,0312 | |||
| DOW / Dow Inc. | 0,03 | 1,69 | 0,0533 | 0,0533 | |||||
| UGI / UGI Corporation | 0,04 | 1,68 | 0,0532 | 0,0532 | |||||
| BWXT / BWX Technologies, Inc. | 0,05 | 0,00 | 1,68 | -2,94 | 0,0532 | -0,0044 | |||
| DPZ / Domino's Pizza, Inc. | 0,02 | 0,00 | 1,68 | 10,54 | 0,0531 | 0,0026 | |||
| KDP / Keurig Dr Pepper Inc. | 0,03 | 1,65 | 0,0522 | 0,0522 | |||||
| CAIAF / CA Immobilien Anlagen AG | 0,05 | 65,56 | 1,63 | 52,39 | 0,0514 | 0,0159 | |||
| WETF / Wisdomtree Investments Inc | 0,12 | 0,00 | 1,62 | -25,95 | 0,0512 | -0,0215 | |||
| SYNA / Synaptics Incorporated | 0,03 | 0,00 | 1,61 | 15,80 | 0,0510 | 0,0047 | |||
| MORN / Morningstar, Inc. | 0,02 | 0,00 | 1,61 | 1,00 | 0,0509 | -0,0021 | |||
| TTC / The Toro Company | 0,03 | 1,60 | 0,0507 | 0,0507 | |||||
| OCR / | 0,03 | 27,64 | 1,60 | 26,20 | 0,0506 | 0,0084 | |||
| NFG / National Fuel Gas Company | 0,02 | 0,00 | 1,57 | -1,88 | 0,0496 | -0,0036 | |||
| AES / The AES Corporation | 0,11 | 0,00 | 1,56 | -1,45 | 0,0493 | -0,0033 | |||
| C / Citigroup Inc. - Corporate Bond/Note | 0,03 | 0,00 | 1,54 | -8,65 | 0,0488 | -0,0074 | |||
| MSCI / MSCI Inc. | 0,04 | 1,51 | 0,0477 | 0,0477 | |||||
| TROW / T. Rowe Price Group, Inc. | 0,02 | -30,89 | 1,45 | -32,05 | 0,0458 | -0,0251 | |||
| KO / The Coca-Cola Company | 0,04 | 0,00 | 1,42 | -6,40 | 0,0449 | -0,0056 | |||
| BYI / | 0,02 | 0,00 | 1,40 | -15,54 | 0,0442 | -0,0108 | |||
| PBI / Pitney Bowes Inc. | 0,05 | -32,39 | 1,36 | -24,56 | 0,0431 | -0,0170 | |||
| COL / Rockwell Collins, Inc. | 0,02 | -23,63 | 1,35 | -17,69 | 0,0428 | -0,0119 | |||
| BLL / Ball Corp. | 0,02 | 1,34 | 0,0423 | 0,0423 | |||||
| HSY / The Hershey Company | 0,01 | -24,40 | 1,32 | -18,85 | 0,0417 | -0,0123 | |||
| SM / SM Energy Company | 0,02 | 1,32 | 0,0417 | 0,0417 | |||||
| VRSN / VeriSign, Inc. | 0,02 | 1,31 | 0,0414 | 0,0414 | |||||
| SYNT / Syntel, Inc. | 0,01 | 1,25 | 0,0394 | 0,0394 | |||||
| CRK / Comstock Resources, Inc. | 0,05 | 1,19 | 0,0378 | 0,0378 | |||||
| NUS / Nu Skin Enterprises, Inc. | 0,01 | -1,23 | 1,17 | -40,81 | 0,0371 | -0,0288 | |||
| ATRO / Astronics Corporation | 0,02 | 1,15 | 0,0364 | 0,0364 | |||||
| US0153511094 / Alexion Pharmaceuticals, Inc. | 0,01 | -24,17 | 1,14 | -13,29 | 0,0361 | -0,0077 | |||
| IFF / International Flavors & Fragrances Inc. | 0,01 | 0,00 | 1,14 | 11,23 | 0,0361 | 0,0020 | |||
| ILG / Interior Logic Group Holdings Inc | 0,04 | 1,12 | 0,0354 | 0,0354 | |||||
| GLW / Corning Incorporated | 0,05 | 1,09 | 0,0346 | 0,0346 | |||||
| MX / Magnachip Semiconductor Corporation | 0,02 | 0,00 | 1,09 | 8,15 | 0,0344 | 0,0009 | |||
| SNI / Scripps Networks Interactive, Inc. | 0,01 | 1,07 | 0,0338 | 0,0338 | |||||
| TXN / Texas Instruments Incorporated | 0,02 | 1,06 | 0,0334 | 0,0334 | |||||
| EOG / EOG Resources, Inc. | 0,01 | 1,05 | 0,0331 | 0,0331 | |||||
| RHI / Robert Half Inc. | 0,02 | 1,04 | 0,0329 | 0,0329 | |||||
| AMZN / Amazon.com, Inc. | 0,00 | 0,00 | 1,04 | -15,57 | 0,0328 | -0,0080 | |||
| USNA / USANA Health Sciences, Inc. | 0,01 | -40,71 | 1,02 | -40,96 | 0,0323 | -0,0252 | |||
| INTC / Intel Corporation | 0,04 | 0,00 | 0,98 | -0,51 | 0,0309 | -0,0018 | |||
| EVR / Evercore Inc. | 0,02 | 0,00 | 0,97 | -7,53 | 0,0307 | -0,0042 | |||
| KAR / OPENLANE, Inc. | 0,03 | 0,96 | 0,0303 | 0,0303 | |||||
| EL / The Estée Lauder Companies Inc. | 0,01 | -41,93 | 0,96 | -48,44 | 0,0303 | -0,0315 | |||
| GPS / The Gap, Inc. | 0,02 | -36,76 | 0,92 | -35,20 | 0,0292 | -0,0182 | |||
| PEP / PepsiCo, Inc. | 0,01 | 0,00 | 0,90 | 0,67 | 0,0284 | -0,0013 | |||
| CTCT / Constant Contact, Inc. | 0,04 | 0,00 | 0,89 | -21,23 | 0,0283 | -0,0095 | |||
| NTAP / NetApp, Inc. | 0,02 | -95,79 | 0,88 | -96,23 | 0,0279 | -0,7506 | |||
| PEAK / Healthpeak Properties, Inc. | 0,00 | -100,00 | 0,00 | -100,00 | -0,0994 | ||||
| TWX / Warner Media LLC | 0,00 | -100,00 | 0,00 | -100,00 | -1,0886 | ||||
| GS / The Goldman Sachs Group, Inc. | 0,00 | -100,00 | 0,00 | -100,00 | -0,1030 | ||||
| GNRC / Generac Holdings Inc. | 0,00 | -100,00 | 0,00 | -100,00 | -0,0603 | ||||
| US3024451011 / FLIR Systems, Inc. | 0,00 | -100,00 | 0,00 | -100,00 | -0,0217 | ||||
| BIDU / Baidu, Inc. - Depositary Receipt (Common Stock) | 0,00 | -100,00 | 0,00 | -100,00 | -0,3615 | ||||
| AVY / Avery Dennison Corporation | 0,00 | -100,00 | 0,00 | -100,00 | -0,0593 | ||||
| HRB / H&R Block, Inc. | 0,00 | -100,00 | 0,00 | -100,00 | -0,0442 | ||||
| MO / Altria Group, Inc. | 0,00 | -100,00 | 0,00 | -100,00 | -0,4425 | ||||
| US6550441058 / Noble Energy, Inc. | 0,00 | -100,00 | 0,00 | -100,00 | -0,0642 | ||||
| HES / Hess Corporation | 0,00 | -100,00 | 0,00 | -100,00 | -0,0703 |