Grundlæggende statistik
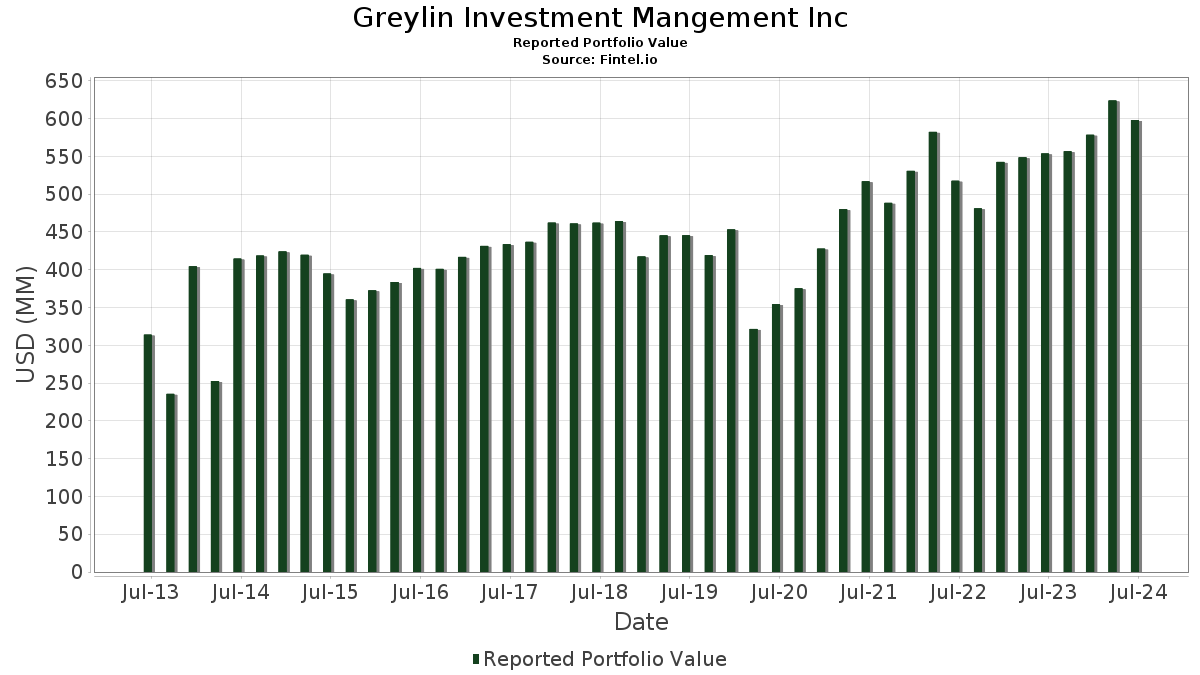
| Porteføljeværdi | $ 597.893.421 |
| Nuværende stillinger | 82 |
Seneste beholdninger, ydeevne, AUM (fra 13F, 13D)
Greylin Investment Mangement Inc har afsløret 82 samlede besiddelser i deres seneste SEC-arkivering. Den seneste porteføljeværdi er beregnet til at være $ 597.893.421 USD. Faktiske aktiver under forvaltning (AUM) er denne værdi plus kontanter (som ikke er oplyst). Greylin Investment Mangement Incs største beholdninger er Berkshire Hathaway Inc. (US:BRK.A) , Exxon Mobil Corporation (US:XOM) , QUALCOMM Incorporated (US:QCOM) , Occidental Petroleum Corporation - Equity Warrant (US:OXY.WS) , and Intel Corporation (US:INTC) . Greylin Investment Mangement Incs nye stillinger omfatter NuScale Power Corporation (US:SMR) , Comcast Corporation (US:CMCSA) , Immersion Corporation (US:IMMR) , .
Top øger dette kvartal
Vi bruger ændringen i porteføljeallokeringen, fordi dette er den mest meningsfulde metrik. Ændringer kan skyldes handler eller ændringer i aktiekurser.
| Sikkerhed | Aktier (MM) |
Værdi (MM$) |
Portefølje % | ΔPortefølje % |
|---|---|---|---|---|
| 0,17 | 33,04 | 5,5259 | 0,6674 | |
| 0,34 | 9,48 | 1,5860 | 0,4751 | |
| 0,81 | 16,75 | 2,8013 | 0,4082 | |
| 0,10 | 7,52 | 1,2586 | 0,3958 | |
| 0,36 | 4,88 | 0,8154 | 0,2454 | |
| 0,21 | 9,78 | 1,6358 | 0,1678 | |
| 0,01 | 0,97 | 0,1616 | 0,1616 | |
| 0,16 | 5,01 | 0,8374 | 0,1449 | |
| 0,25 | 10,01 | 1,6748 | 0,1421 | |
| 0,02 | 3,55 | 0,5939 | 0,1344 |
Top falder i dette kvartal
Vi bruger ændringen i porteføljeallokeringen, fordi dette er den mest meningsfulde metrik. Ændringer kan skyldes handler eller ændringer i aktiekurser.
| Sikkerhed | Aktier (MM) |
Værdi (MM$) |
Portefølje % | ΔPortefølje % |
|---|---|---|---|---|
| 1,02 | 31,61 | 5,2868 | -1,5495 | |
| 0,70 | 8,52 | 1,4253 | -0,5415 | |
| 0,53 | 214,93 | 35,9485 | -0,4151 | |
| 0,08 | 8,94 | 1,4958 | -0,1750 | |
| 0,25 | 9,99 | 1,6717 | -0,1510 | |
| 0,05 | 3,73 | 0,6236 | -0,1324 | |
| 0,02 | 1,76 | 0,2941 | -0,1316 | |
| 0,16 | 6,17 | 1,0320 | -0,1131 | |
| 0,68 | 7,18 | 1,2012 | -0,1026 | |
| 0,08 | 11,15 | 1,8655 | -0,0740 |
13F og Fondsarkivering
Denne formular blev indsendt den 2024-07-19 for rapporteringsperioden 2024-06-30. Klik på linkikonet for at se den fulde transaktionshistorik.
Opgrader for at låse op for premium-data og eksportere til Excel ![]() .
.
| Sikkerhed | Type | Gennemsnitlig aktiekurs | Aktier (MM) |
Δ Aktier (%) |
Δ Aktier (%) |
Værdi ($MM) |
Portefølje (%) |
ΔPortefølje (%) |
|
|---|---|---|---|---|---|---|---|---|---|
| BRK.A / Berkshire Hathaway Inc. | 0,53 | -2,03 | 214,93 | -5,22 | 35,9485 | -0,4151 | |||
| XOM / Exxon Mobil Corporation | 0,50 | -3,37 | 57,75 | -4,30 | 9,6586 | -0,0176 | |||
| QCOM / QUALCOMM Incorporated | 0,17 | -7,32 | 33,04 | 9,04 | 5,5259 | 0,6674 | |||
| OXY.WS / Occidental Petroleum Corporation - Equity Warrant | 0,77 | -0,78 | 31,87 | -5,24 | 5,3309 | -0,0627 | |||
| INTC / Intel Corporation | 1,02 | 5,74 | 31,61 | -25,86 | 5,2868 | -1,5495 | |||
| OGN / Organon & Co. | 0,81 | 1,92 | 16,75 | 12,22 | 2,8013 | 0,4082 | |||
| JNJ / Johnson & Johnson | 0,08 | -0,20 | 11,15 | -7,79 | 1,8655 | -0,0740 | |||
| BAC / Bank of America Corporation | 0,25 | -0,11 | 10,01 | 4,76 | 1,6748 | 0,1421 | |||
| ALLY / Ally Financial Inc. | 0,25 | -10,03 | 9,99 | -12,07 | 1,6717 | -0,1510 | |||
| MO / Altria Group, Inc. | 0,21 | 2,31 | 9,78 | 6,84 | 1,6358 | 0,1678 | |||
| PFE / Pfizer Inc. | 0,34 | 35,74 | 9,48 | 36,86 | 1,5860 | 0,4751 | |||
| COP / ConocoPhillips | 0,08 | -4,49 | 8,94 | -14,17 | 1,4958 | -0,1750 | |||
| WBA / Walgreens Boots Alliance, Inc. | 0,70 | 24,59 | 8,52 | -30,53 | 1,4253 | -0,5415 | |||
| OXY / Occidental Petroleum Corporation | 0,12 | -0,62 | 7,73 | -3,62 | 1,2928 | 0,0069 | |||
| FDX / FedEx Corporation | 0,03 | 0,00 | 7,71 | 3,49 | 1,2899 | 0,0949 | |||
| BABA / Alibaba Group Holding Limited - Depositary Receipt (Common Stock) | 0,10 | 40,55 | 7,52 | 39,85 | 1,2586 | 0,3958 | |||
| VTRS / Viatris Inc. | 0,68 | -0,79 | 7,18 | -11,67 | 1,2012 | -0,1026 | |||
| LLY / Eli Lilly and Company | 0,01 | -6,46 | 6,29 | 8,85 | 1,0517 | 0,1254 | |||
| USB / U.S. Bancorp | 0,16 | -2,72 | 6,17 | -13,60 | 1,0320 | -0,1131 | |||
| CVX / Chevron Corporation | 0,04 | -2,39 | 6,10 | -3,21 | 1,0199 | 0,0097 | |||
| MRK / Merck & Co., Inc. | 0,04 | -1,17 | 5,47 | -7,27 | 0,9148 | -0,0310 | |||
| MMM / 3M Company | 0,05 | -0,16 | 5,39 | -3,82 | 0,9023 | 0,0029 | |||
| KHC / The Kraft Heinz Company | 0,16 | 4,65 | 5,29 | -8,63 | 0,8851 | -0,0435 | |||
| BTI / British American Tobacco p.l.c. - Depositary Receipt (Common Stock) | 0,16 | 14,32 | 5,01 | 15,93 | 0,8374 | 0,1449 | |||
| RKT / Rocket Companies, Inc. | 0,36 | 45,67 | 4,88 | 37,17 | 0,8154 | 0,2454 | |||
| AMGN / Amgen Inc. | 0,01 | -5,61 | 4,68 | 3,73 | 0,7824 | 0,0593 | |||
| KO / The Coca-Cola Company | 0,07 | -1,24 | 4,62 | 2,76 | 0,7726 | 0,0517 | |||
| IBM / International Business Machines Corporation | 0,03 | -1,35 | 4,49 | -10,66 | 0,7503 | -0,0548 | |||
| HD / The Home Depot, Inc. | 0,01 | -1,49 | 4,43 | -11,60 | 0,7405 | -0,0626 | |||
| NAT / Nordic American Tankers Limited | 1,09 | 1,78 | 4,33 | 3,34 | 0,7236 | 0,0523 | |||
| GILD / Gilead Sciences, Inc. | 0,05 | -15,57 | 3,73 | -20,92 | 0,6236 | -0,1324 | |||
| LOW / Lowe's Companies, Inc. | 0,02 | -0,53 | 3,73 | -13,93 | 0,6233 | -0,0708 | |||
| AAPL / Apple Inc. | 0,02 | 0,89 | 3,55 | 23,94 | 0,5939 | 0,1344 | |||
| CSCO / Cisco Systems, Inc. | 0,06 | -6,34 | 2,65 | -10,83 | 0,4434 | -0,0334 | |||
| NTAP / NetApp, Inc. | 0,02 | -0,57 | 2,24 | 21,96 | 0,3745 | 0,0802 | |||
| NXPI / NXP Semiconductors N.V. | 0,01 | -7,94 | 2,10 | -0,05 | 0,3520 | 0,0145 | |||
| CHKP / Check Point Software Technologies Ltd. | 0,01 | 17,06 | 1,93 | 17,79 | 0,3223 | 0,0599 | |||
| CAH / Cardinal Health, Inc. | 0,02 | -24,62 | 1,76 | -33,76 | 0,2941 | -0,1316 | |||
| RTX / RTX Corporation | 0,02 | -5,17 | 1,63 | -2,34 | 0,2728 | 0,0049 | |||
| GNRC / Generac Holdings Inc. | 0,01 | 2,19 | 1,54 | 7,08 | 0,2582 | 0,0271 | |||
| TSLA / Tesla, Inc. | 0,01 | -1,30 | 1,51 | 11,14 | 0,2520 | 0,0345 | |||
| PEP / PepsiCo, Inc. | 0,01 | -2,84 | 1,27 | -8,45 | 0,2120 | -0,0100 | |||
| JPM / JPMorgan Chase & Co. | 0,01 | -5,06 | 1,14 | -4,13 | 0,1903 | -0,0000 | |||
| RIO / Rio Tinto Group - Depositary Receipt (Common Stock) | 0,01 | 64,56 | 0,99 | 70,29 | 0,1651 | 0,0721 | |||
| QSR / Restaurant Brands International Inc. | 0,01 | -6,40 | 0,97 | -17,05 | 0,1619 | -0,0253 | |||
| JAZZ / Jazz Pharmaceuticals plc | 0,01 | 0,97 | 0,1616 | 0,1616 | |||||
| PSX / Phillips 66 | 0,01 | -3,14 | 0,95 | -16,28 | 0,1583 | -0,0230 | |||
| HP / Helmerich & Payne, Inc. | 0,03 | -9,29 | 0,93 | -22,06 | 0,1554 | -0,0357 | |||
| TXN / Texas Instruments Incorporated | 0,00 | -1,23 | 0,78 | 10,35 | 0,1301 | 0,0170 | |||
| MTB / M&T Bank Corporation | 0,00 | 0,00 | 0,74 | 4,07 | 0,1240 | 0,0098 | |||
| HON / Honeywell International Inc. | 0,00 | 0,00 | 0,74 | 3,95 | 0,1232 | 0,0097 | |||
| DVN / Devon Energy Corporation | 0,01 | 0,00 | 0,68 | -5,59 | 0,1132 | -0,0017 | |||
| SBR / Sabine Royalty Trust | 0,01 | 0,02 | 0,59 | 2,09 | 0,0982 | 0,0060 | |||
| ITW / Illinois Tool Works Inc. | 0,00 | 0,00 | 0,56 | -11,65 | 0,0939 | -0,0080 | |||
| COF / Capital One Financial Corporation | 0,00 | -16,42 | 0,55 | -22,22 | 0,0914 | -0,0213 | |||
| CSX / CSX Corporation | 0,01 | 0,00 | 0,50 | -9,75 | 0,0837 | -0,0052 | |||
| AXP / American Express Company | 0,00 | -2,33 | 0,49 | -0,61 | 0,0813 | 0,0028 | |||
| IPG / The Interpublic Group of Companies, Inc. | 0,02 | 88,76 | 0,48 | 68,31 | 0,0801 | 0,0345 | |||
| ABT / Abbott Laboratories | 0,00 | 0,00 | 0,45 | -8,65 | 0,0760 | -0,0037 | |||
| GJR / Strats Trust For Procter & Gambel Security - Preferred Security | 0,00 | -4,42 | 0,45 | -2,84 | 0,0745 | 0,0010 | |||
| CAG / Conagra Brands, Inc. | 0,02 | 0,44 | 0,0739 | 0,0739 | |||||
| UTHR / United Therapeutics Corporation | 0,00 | -5,26 | 0,43 | 31,50 | 0,0719 | 0,0194 | |||
| MCK / McKesson Corporation | 0,00 | -2,36 | 0,41 | 6,22 | 0,0687 | 0,0067 | |||
| SMR / NuScale Power Corporation | 0,04 | 0,41 | 0,0686 | 0,0686 | |||||
| SO / The Southern Company | 0,00 | -3,64 | 0,38 | 4,40 | 0,0636 | 0,0051 | |||
| CAT / Caterpillar Inc. | 0,00 | 0,00 | 0,35 | -9,11 | 0,0585 | -0,0032 | |||
| SYF / Synchrony Financial | 0,01 | -0,76 | 0,31 | 8,51 | 0,0513 | 0,0060 | |||
| PM / Philip Morris International Inc. | 0,00 | -4,88 | 0,30 | 5,34 | 0,0496 | 0,0044 | |||
| CMCSA / Comcast Corporation | 0,01 | 0,27 | 0,0460 | 0,0460 | |||||
| EFA / iShares Trust - iShares MSCI EAFE ETF | 0,00 | 0,00 | 0,27 | -1,84 | 0,0447 | 0,0010 | |||
| MCD / McDonald's Corporation | 0,00 | 0,00 | 0,26 | -9,51 | 0,0430 | -0,0026 | |||
| SJM / The J. M. Smucker Company | 0,00 | 0,24 | 0,0407 | 0,0407 | |||||
| TSN / Tyson Foods, Inc. | 0,00 | -13,33 | 0,24 | -15,66 | 0,0398 | -0,0054 | |||
| MSFT / Microsoft Corporation | 0,00 | -8,70 | 0,23 | -2,90 | 0,0392 | 0,0005 | |||
| DWM / WisdomTree Trust - WisdomTree International Equity Fund | 0,00 | 0,00 | 0,23 | -1,69 | 0,0388 | 0,0009 | |||
| GIS / General Mills, Inc. | 0,00 | 4,44 | 0,23 | -5,81 | 0,0381 | -0,0006 | |||
| ZBH / Zimmer Biomet Holdings, Inc. | 0,00 | 0,00 | 0,22 | -17,67 | 0,0367 | -0,0061 | |||
| WSBC / WesBanco, Inc. | 0,01 | 0,00 | 0,22 | -6,44 | 0,0366 | -0,0009 | |||
| SWKS / Skyworks Solutions, Inc. | 0,00 | -6,41 | 0,21 | -7,89 | 0,0352 | -0,0014 | |||
| EPD / Enterprise Products Partners L.P. - Limited Partnership | 0,01 | 0,00 | 0,21 | -0,95 | 0,0351 | 0,0012 | |||
| T / AT&T Inc. | 0,01 | 0,00 | 0,20 | 8,24 | 0,0331 | 0,0039 | |||
| IMMR / Immersion Corporation | 0,02 | 0,15 | 0,0255 | 0,0255 | |||||
| WMB / The Williams Companies, Inc. | 0,00 | -100,00 | 0,00 | 0,0000 | |||||
| BMY / Bristol-Myers Squibb Company | 0,00 | -100,00 | 0,00 | 0,0000 | |||||
| MPC / Marathon Petroleum Corporation | 0,00 | -100,00 | 0,00 | 0,0000 |