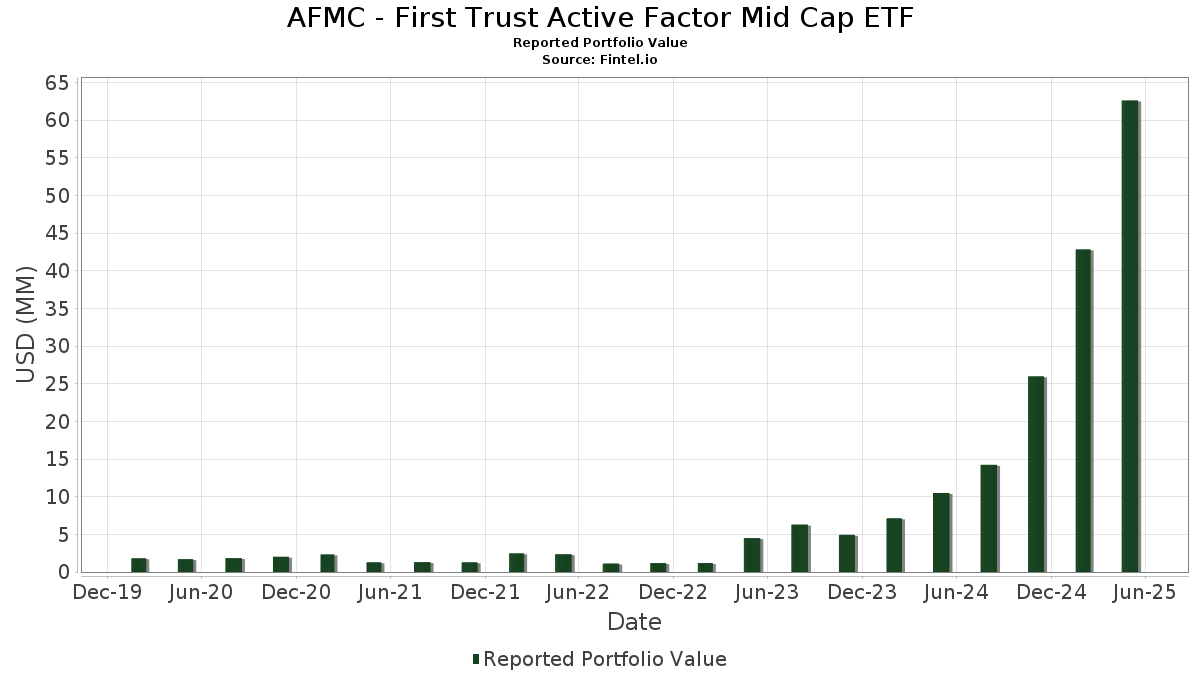
Grundlæggende statistik
| Porteføljeværdi | $ 62.597.002 |
| Nuværende stillinger | 259 |
Seneste beholdninger, ydeevne, AUM (fra 13F, 13D)
AFMC - First Trust Active Factor Mid Cap ETF har afsløret 259 samlede besiddelser i deres seneste SEC-arkivering. Den seneste porteføljeværdi er beregnet til at være $ 62.597.002 USD. Faktiske aktiver under forvaltning (AUM) er denne værdi plus kontanter (som ikke er oplyst). AFMC - First Trust Active Factor Mid Cap ETFs største beholdninger er Unum Group (US:UNM) , Sprouts Farmers Market, Inc. (US:SFM) , Exelixis, Inc. (US:EXEL) , United Therapeutics Corporation (US:UTHR) , and Old Republic International Corporation (US:ORI) . AFMC - First Trust Active Factor Mid Cap ETFs nye stillinger omfatter RBC Bearings Incorporated (US:RBC) , DT Midstream, Inc. (US:DTM) , DocuSign, Inc. (US:DOCU) , American Healthcare REIT, Inc. (US:AHR) , and Axalta Coating Systems Ltd. (GB:0U6C) .
Top øger dette kvartal
Vi bruger ændringen i porteføljeallokeringen, fordi dette er den mest meningsfulde metrik. Ændringer kan skyldes handler eller ændringer i aktiekurser.
| Sikkerhed | Aktier (MM) |
Værdi (MM$) |
Portefølje % | ΔPortefølje % |
|---|---|---|---|---|
| 0,01 | 0,76 | 1,2110 | 0,4391 | |
| 0,02 | 0,75 | 1,2045 | 0,4084 | |
| 0,00 | 0,46 | 0,7362 | 0,3874 | |
| 0,00 | 0,24 | 0,3763 | 0,3763 | |
| 0,00 | 0,23 | 0,3750 | 0,3750 | |
| 0,01 | 0,46 | 0,7402 | 0,3363 | |
| 0,02 | 0,95 | 1,5119 | 0,3217 | |
| 0,03 | 0,61 | 0,9791 | 0,3215 | |
| 0,00 | 0,26 | 0,4098 | 0,3151 | |
| 0,00 | 0,19 | 0,3099 | 0,3099 |
Top falder i dette kvartal
Vi bruger ændringen i porteføljeallokeringen, fordi dette er den mest meningsfulde metrik. Ændringer kan skyldes handler eller ændringer i aktiekurser.
| Sikkerhed | Aktier (MM) |
Værdi (MM$) |
Portefølje % | ΔPortefølje % |
|---|---|---|---|---|
| 0,00 | 0,00 | -0,4017 | ||
| 0,00 | 0,45 | 0,7204 | -0,3548 | |
| 0,00 | 0,15 | 0,2441 | -0,3533 | |
| 0,00 | 0,06 | 0,0933 | -0,3514 | |
| 0,00 | 0,10 | 0,1629 | -0,3442 | |
| 0,00 | 0,00 | -0,3410 | ||
| 0,00 | 0,05 | 0,0847 | -0,3213 | |
| 0,01 | 0,30 | 0,4819 | -0,3209 | |
| 0,00 | 0,17 | 0,2656 | -0,3181 | |
| 0,00 | 0,45 | 0,7130 | -0,2885 |
13F og Fondsarkivering
Denne formular blev indsendt den 2025-07-25 for rapporteringsperioden 2025-05-31. Klik på linkikonet for at se den fulde transaktionshistorik.
Opgrader for at låse op for premium-data og eksportere til Excel ![]() .
.
| Sikkerhed | Type | Gennemsnitlig aktiekurs | Aktier (MM) |
Δ Aktier (%) |
Δ Aktier (%) |
Værdi ($MM) |
Portefølje (%) |
ΔPortefølje (%) |
|
|---|---|---|---|---|---|---|---|---|---|
| UNM / Unum Group | 0,01 | 73,65 | 1,07 | 72,54 | 1,7058 | 0,2599 | |||
| SFM / Sprouts Farmers Market, Inc. | 0,01 | 32,34 | 1,00 | 54,22 | 1,6042 | 0,0832 | |||
| EXEL / Exelixis, Inc. | 0,02 | 66,89 | 0,95 | 85,85 | 1,5119 | 0,3217 | |||
| UTHR / United Therapeutics Corporation | 0,00 | 39,55 | 0,88 | 38,99 | 1,4014 | -0,0718 | |||
| ORI / Old Republic International Corporation | 0,02 | 49,14 | 0,81 | 46,39 | 1,2964 | 0,0021 | |||
| NFG / National Fuel Gas Company | 0,01 | 108,89 | 0,76 | 129,70 | 1,2110 | 0,4391 | |||
| UGI / UGI Corporation | 0,02 | 109,49 | 0,75 | 121,11 | 1,2045 | 0,4084 | |||
| FFIV / F5, Inc. | 0,00 | 91,42 | 0,75 | 86,82 | 1,2005 | 0,2613 | |||
| MTG / MGIC Investment Corporation | 0,03 | 37,96 | 0,71 | 48,13 | 1,1419 | 0,0163 | |||
| IDCC / InterDigital, Inc. | 0,00 | 49,55 | 0,69 | 52,31 | 1,1068 | 0,0432 | |||
| EME / EMCOR Group, Inc. | 0,00 | 30,58 | 0,68 | 50,89 | 1,0844 | 0,0326 | |||
| ALSN / Allison Transmission Holdings, Inc. | 0,01 | 38,55 | 0,65 | 41,04 | 1,0429 | -0,0385 | |||
| TPR / Tapestry, Inc. | 0,01 | 101,60 | 0,65 | 85,23 | 1,0427 | 0,2207 | |||
| G / Genpact Limited | 0,02 | 104,21 | 0,65 | 65,14 | 1,0370 | 0,1195 | |||
| INGR / Ingredion Incorporated | 0,00 | 48,37 | 0,63 | 58,25 | 1,0114 | 0,0760 | |||
| MLI / Mueller Industries, Inc. | 0,01 | 52,97 | 0,62 | 48,79 | 0,9841 | 0,0159 | |||
| FHN / First Horizon Corporation | 0,03 | 135,77 | 0,61 | 118,15 | 0,9791 | 0,3215 | |||
| GDDY / GoDaddy Inc. | 0,00 | 37,99 | 0,59 | 40,14 | 0,9425 | -0,0413 | |||
| WPC / W. P. Carey Inc. | 0,01 | 71,17 | 0,59 | 67,24 | 0,9385 | 0,1186 | |||
| NRG / NRG Energy, Inc. | 0,00 | -11,74 | 0,58 | 30,09 | 0,9195 | -0,1129 | |||
| CW / Curtiss-Wright Corporation | 0,00 | 29,95 | 0,56 | 77,96 | 0,8905 | 0,1585 | |||
| ACT / Enact Holdings, Inc. | 0,02 | 38,20 | 0,56 | 42,20 | 0,8891 | -0,0241 | |||
| PPC / Pilgrim's Pride Corporation | 0,01 | 49,24 | 0,52 | 34,81 | 0,8299 | -0,0693 | |||
| FIX / Comfort Systems USA, Inc. | 0,00 | 27,59 | 0,51 | 68,20 | 0,8195 | 0,1063 | |||
| JAZZ / Jazz Pharmaceuticals plc | 0,00 | 118,50 | 0,51 | 64,52 | 0,8153 | 0,0910 | |||
| CRS / Carpenter Technology Corporation | 0,00 | 58,32 | 0,51 | 79,86 | 0,8140 | 0,1519 | |||
| VMI / Valmont Industries, Inc. | 0,00 | 139,94 | 0,50 | 119,47 | 0,7934 | 0,2640 | |||
| FHI / Federated Hermes, Inc. | 0,01 | 44,38 | 0,48 | 57,14 | 0,7740 | 0,0545 | |||
| HRB / H&R Block, Inc. | 0,01 | 35,25 | 0,48 | 41,12 | 0,7633 | -0,0262 | |||
| DBX / Dropbox, Inc. | 0,02 | 60,65 | 0,48 | 78,65 | 0,7631 | 0,1381 | |||
| RDN / Radian Group Inc. | 0,01 | 43,11 | 0,48 | 48,44 | 0,7592 | 0,0120 | |||
| HALO / Halozyme Therapeutics, Inc. | 0,01 | 46,87 | 0,48 | 39,30 | 0,7587 | -0,0378 | |||
| EPR / EPR Properties | 0,01 | 155,23 | 0,46 | 167,63 | 0,7402 | 0,3363 | |||
| TKO / TKO Group Holdings, Inc. | 0,00 | 194,46 | 0,46 | 208,72 | 0,7362 | 0,3874 | |||
| TMHC / Taylor Morrison Home Corporation | 0,01 | 47,44 | 0,46 | 34,71 | 0,7327 | -0,0628 | |||
| SNX / TD SYNNEX Corporation | 0,00 | 166,88 | 0,46 | 135,75 | 0,7277 | 0,2761 | |||
| GLPI / Gaming and Leisure Properties, Inc. | 0,01 | 48,33 | 0,46 | 38,30 | 0,7270 | -0,0422 | |||
| TOL / Toll Brothers, Inc. | 0,00 | 4,87 | 0,45 | -1,96 | 0,7204 | -0,3548 | |||
| AYI / Acuity Inc. | 0,00 | 35,62 | 0,45 | 18,57 | 0,7143 | -0,1658 | |||
| WSM / Williams-Sonoma, Inc. | 0,00 | 25,17 | 0,45 | 3,96 | 0,7130 | -0,2885 | |||
| CHE / Chemed Corporation | 0,00 | 35,59 | 0,44 | 29,97 | 0,6996 | -0,0886 | |||
| TPL / Texas Pacific Land Corporation | 0,00 | 32,88 | 0,44 | 3,56 | 0,6974 | -0,2858 | |||
| JBL / Jabil Inc. | 0,00 | 48,18 | 0,42 | 61,00 | 0,6660 | 0,0603 | |||
| SNA / Snap-on Incorporated | 0,00 | 46,02 | 0,39 | 37,41 | 0,6290 | -0,0407 | |||
| EXLS / ExlService Holdings, Inc. | 0,01 | 201,70 | 0,39 | 187,50 | 0,6260 | 0,3065 | |||
| RL / Ralph Lauren Corporation | 0,00 | 49,47 | 0,39 | 52,76 | 0,6198 | 0,0261 | |||
| CVLT / Commvault Systems, Inc. | 0,00 | 28,26 | 0,38 | 38,04 | 0,6093 | -0,0373 | |||
| AMG / Affiliated Managers Group, Inc. | 0,00 | 48,05 | 0,38 | 53,01 | 0,6088 | 0,0254 | |||
| SAIC / Science Applications International Corporation | 0,00 | 48,13 | 0,37 | 73,71 | 0,5912 | 0,0924 | |||
| FLEX / Flex Ltd. | 0,01 | 99,02 | 0,37 | 122,89 | 0,5910 | 0,2022 | |||
| PBH / Prestige Consumer Healthcare Inc. | 0,00 | 48,33 | 0,37 | 50,00 | 0,5900 | 0,0149 | |||
| EAT / Brinker International, Inc. | 0,00 | 154,72 | 0,36 | 167,16 | 0,5723 | 0,2588 | |||
| PINC / Premier, Inc. | 0,02 | 48,18 | 0,35 | 87,63 | 0,5582 | 0,1226 | |||
| MSM / MSC Industrial Direct Co., Inc. | 0,00 | 48,15 | 0,34 | 49,57 | 0,5502 | 0,0130 | |||
| TGNA / TEGNA Inc. | 0,02 | 48,27 | 0,34 | 36,25 | 0,5477 | -0,0400 | |||
| OHI / Omega Healthcare Investors, Inc. | 0,01 | 28,69 | 0,34 | 29,17 | 0,5460 | -0,0714 | |||
| SANM / Sanmina Corporation | 0,00 | 66,17 | 0,34 | 71,57 | 0,5407 | 0,0807 | |||
| NTCT / NetScout Systems, Inc. | 0,01 | 48,17 | 0,34 | 50,89 | 0,5402 | 0,0155 | |||
| CRUS / Cirrus Logic, Inc. | 0,00 | 34,20 | 0,34 | 26,89 | 0,5350 | -0,0823 | |||
| HNI / HNI Corporation | 0,01 | 34,03 | 0,33 | 34,01 | 0,5289 | -0,0486 | |||
| MAIN / Main Street Capital Corporation | 0,01 | 199,38 | 0,33 | 181,90 | 0,5230 | 0,2501 | |||
| LLYVK / Liberty Live Group | 0,00 | 212,40 | 0,33 | 211,43 | 0,5223 | 0,2765 | |||
| BRBR / BellRing Brands, Inc. | 0,01 | 27,96 | 0,33 | 9,80 | 0,5199 | -0,1713 | |||
| AWI / Armstrong World Industries, Inc. | 0,00 | 219,42 | 0,33 | 225,00 | 0,5192 | 0,2846 | |||
| LOPE / Grand Canyon Education, Inc. | 0,00 | 164,25 | 0,32 | 191,89 | 0,5185 | 0,2578 | |||
| ENS / EnerSys | 0,00 | 48,30 | 0,32 | 22,14 | 0,5122 | -0,1004 | |||
| UFPI / UFP Industries, Inc. | 0,00 | 48,13 | 0,32 | 35,02 | 0,5117 | -0,0420 | |||
| COKE / Coca-Cola Consolidated, Inc. | 0,00 | 1.203,74 | 0,32 | 5,28 | 0,5109 | -0,1970 | |||
| PHM / PulteGroup, Inc. | 0,00 | 21,12 | 0,31 | 15,04 | 0,4902 | -0,1330 | |||
| MOH / Molina Healthcare, Inc. | 0,00 | 48,36 | 0,30 | 50,50 | 0,4857 | 0,0134 | |||
| UHS / Universal Health Services, Inc. | 0,00 | 16,16 | 0,30 | 26,25 | 0,4852 | -0,0769 | |||
| COLB / Columbia Banking System, Inc. | 0,01 | 48,29 | 0,30 | 29,61 | 0,4835 | -0,0613 | |||
| KBH / KB Home | 0,01 | 3,76 | 0,30 | -12,24 | 0,4819 | -0,3209 | |||
| BWA / BorgWarner Inc. | 0,01 | 48,27 | 0,30 | 65,38 | 0,4816 | 0,0545 | |||
| VST / Vistra Corp. | 0,00 | 22,58 | 0,30 | 47,55 | 0,4816 | 0,0036 | |||
| GAP / The Gap, Inc. | 0,01 | 35,21 | 0,29 | 33,79 | 0,4686 | -0,0448 | |||
| LII / Lennox International Inc. | 0,00 | 6,57 | 0,29 | 0,00 | 0,4679 | -0,2154 | |||
| ESNT / Essent Group Ltd. | 0,01 | 39,13 | 0,29 | 39,90 | 0,4660 | -0,0203 | |||
| FICO / Fair Isaac Corporation | 0,00 | 27,07 | 0,29 | 16,40 | 0,4659 | -0,1197 | |||
| RPM / RPM International Inc. | 0,00 | 81,66 | 0,29 | 66,67 | 0,4647 | 0,0578 | |||
| HIW / Highwoods Properties, Inc. | 0,01 | -4,96 | 0,29 | -3,05 | 0,4568 | -0,2322 | |||
| DDS / Dillard's, Inc. | 0,00 | 48,85 | 0,28 | 51,61 | 0,4509 | 0,0159 | |||
| PRI / Primerica, Inc. | 0,00 | 25,69 | 0,28 | 17,08 | 0,4503 | -0,1108 | |||
| NYT / The New York Times Company | 0,00 | 24,16 | 0,28 | 47,89 | 0,4491 | 0,0040 | |||
| NTAP / NetApp, Inc. | 0,00 | 34,43 | 0,28 | 33,33 | 0,4483 | -0,0423 | |||
| PVH / PVH Corp. | 0,00 | 6,59 | 0,27 | 19,21 | 0,4373 | -0,0984 | |||
| HST / Host Hotels & Resorts, Inc. | 0,02 | 48,28 | 0,27 | 42,19 | 0,4371 | -0,0115 | |||
| NXST / Nexstar Media Group, Inc. | 0,00 | 48,06 | 0,27 | 49,18 | 0,4368 | 0,0088 | |||
| ACIW / ACI Worldwide, Inc. | 0,01 | 54,10 | 0,26 | 24,17 | 0,4194 | -0,0737 | |||
| SNV / Synovus Financial Corp. | 0,01 | 48,35 | 0,26 | 37,04 | 0,4149 | -0,0285 | |||
| KMT / Kennametal Inc. | 0,01 | 48,32 | 0,26 | 44,13 | 0,4135 | -0,0053 | |||
| EQH / Equitable Holdings, Inc. | 0,00 | 851,57 | 0,26 | 966,67 | 0,4098 | 0,3151 | |||
| BOX / Box, Inc. | 0,01 | 48,22 | 0,25 | 72,22 | 0,3962 | 0,0584 | |||
| IBOC / International Bancshares Corporation | 0,00 | 27,36 | 0,25 | 19,32 | 0,3948 | -0,0899 | |||
| EHC / Encompass Health Corporation | 0,00 | 48,47 | 0,25 | 78,83 | 0,3927 | 0,0725 | |||
| SBRA / Sabra Health Care REIT, Inc. | 0,01 | 23,83 | 0,25 | 30,32 | 0,3917 | -0,0476 | |||
| SEIC / SEI Investments Company | 0,00 | 84,51 | 0,24 | 96,75 | 0,3877 | 0,0993 | |||
| BYD / Boyd Gaming Corporation | 0,00 | 48,39 | 0,24 | 45,78 | 0,3870 | -0,0007 | |||
| CBSH / Commerce Bancshares, Inc. | 0,00 | 21,44 | 0,24 | 17,56 | 0,3864 | -0,0937 | |||
| TEX / Terex Corporation | 0,01 | 48,29 | 0,24 | 64,34 | 0,3764 | 0,0409 | |||
| RBC / RBC Bearings Incorporated | 0,00 | 0,24 | 0,3763 | 0,3763 | |||||
| DTM / DT Midstream, Inc. | 0,00 | 0,23 | 0,3750 | 0,3750 | |||||
| AIT / Applied Industrial Technologies, Inc. | 0,00 | 37,60 | 0,23 | 24,60 | 0,3733 | -0,0653 | |||
| WBS / Webster Financial Corporation | 0,00 | 48,31 | 0,22 | 36,20 | 0,3546 | -0,0277 | |||
| ALV / Autoliv, Inc. | 0,00 | 48,32 | 0,22 | 56,74 | 0,3544 | 0,0237 | |||
| CRVL / CorVel Corporation | 0,00 | 34,10 | 0,22 | 35,58 | 0,3543 | -0,0284 | |||
| CORT / Corcept Therapeutics Incorporated | 0,00 | 701,71 | 0,22 | 933,33 | 0,3476 | 0,2981 | |||
| MIDD / The Middleby Corporation | 0,00 | 47,96 | 0,22 | 30,72 | 0,3470 | -0,0410 | |||
| BRX / Brixmor Property Group Inc. | 0,01 | 46,46 | 0,21 | 32,92 | 0,3429 | -0,0336 | |||
| AM / Antero Midstream Corporation | 0,01 | 4.826,75 | 0,21 | 10.400,00 | 0,3369 | 0,1627 | |||
| NNN / NNN REIT, Inc. | 0,00 | 48,28 | 0,21 | 46,48 | 0,3331 | -0,0007 | |||
| THG / The Hanover Insurance Group, Inc. | 0,00 | 11.550,00 | 0,21 | 20.400,00 | 0,3274 | 0,2650 | |||
| INCY / Incyte Corporation | 0,00 | 48,15 | 0,20 | 31,82 | 0,3245 | -0,0372 | |||
| AVT / Avnet, Inc. | 0,00 | 48,11 | 0,20 | 46,38 | 0,3231 | 0,0009 | |||
| MEDP / Medpace Holdings, Inc. | 0,00 | 28,14 | 0,20 | 15,52 | 0,3217 | -0,0856 | |||
| BCC / Boise Cascade Company | 0,00 | 48,30 | 0,20 | 24,07 | 0,3216 | -0,0566 | |||
| JHG / Janus Henderson Group plc | 0,01 | 37,73 | 0,19 | 19,02 | 0,3105 | -0,0722 | |||
| MASI / Masimo Corporation | 0,00 | 6.544,44 | 0,19 | 9.600,00 | 0,3104 | 0,1955 | |||
| HLI / Houlihan Lokey, Inc. | 0,00 | 14,76 | 0,19 | 16,17 | 0,3102 | -0,0819 | |||
| DOCU / DocuSign, Inc. | 0,00 | 0,19 | 0,3099 | 0,3099 | |||||
| AHR / American Healthcare REIT, Inc. | 0,01 | 0,19 | 0,3075 | 0,3075 | |||||
| GHC / Graham Holdings Company | 0,00 | 51,13 | 0,19 | 46,92 | 0,3064 | 0,0010 | |||
| ZD / Ziff Davis, Inc. | 0,01 | 48,32 | 0,19 | 17,18 | 0,3063 | -0,0757 | |||
| TAP / Molson Coors Beverage Company | 0,00 | 48,15 | 0,19 | 29,25 | 0,3049 | -0,0391 | |||
| BTU / Peabody Energy Corporation | 0,01 | 48,25 | 0,19 | 41,35 | 0,3008 | -0,0099 | |||
| OC / Owens Corning | 0,00 | 48,46 | 0,19 | 29,17 | 0,2982 | -0,0394 | |||
| ARW / Arrow Electronics, Inc. | 0,00 | 47,97 | 0,19 | 62,28 | 0,2963 | 0,0291 | |||
| OZK / Bank OZK | 0,00 | 48,27 | 0,18 | 37,31 | 0,2942 | -0,0199 | |||
| DRS / Leonardo DRS, Inc. | 0,00 | 48,28 | 0,18 | 106,74 | 0,2942 | 0,0855 | |||
| DLB / Dolby Laboratories, Inc. | 0,00 | 48,41 | 0,18 | 34,56 | 0,2934 | -0,0241 | |||
| WSO / Watsco, Inc. | 0,00 | 48,19 | 0,18 | 30,22 | 0,2897 | -0,0352 | |||
| 0U6C / Axalta Coating Systems Ltd. | 0,01 | 0,18 | 0,2897 | 0,2897 | |||||
| BLDR / Builders FirstSource, Inc. | 0,00 | 48,19 | 0,18 | 15,29 | 0,2893 | -0,0790 | |||
| SF / Stifel Financial Corp. | 0,00 | 24,14 | 0,18 | 10,63 | 0,2832 | -0,0926 | |||
| CALM / Cal-Maine Foods, Inc. | 0,00 | 0,18 | 0,2801 | 0,2801 | |||||
| CNO / CNO Financial Group, Inc. | 0,00 | 0,18 | 0,2797 | 0,2797 | |||||
| SON / Sonoco Products Company | 0,00 | 48,15 | 0,18 | 41,13 | 0,2795 | -0,0100 | |||
| VOYA / Voya Financial, Inc. | 0,00 | 48,04 | 0,17 | 36,22 | 0,2770 | -0,0201 | |||
| NVST / Envista Holdings Corporation | 0,01 | 48,26 | 0,17 | 34,92 | 0,2730 | -0,0213 | |||
| AOS / A. O. Smith Corporation | 0,00 | 22,27 | 0,17 | 18,18 | 0,2712 | -0,0639 | |||
| MTSI / MACOM Technology Solutions Holdings, Inc. | 0,00 | 48,40 | 0,17 | 56,48 | 0,2709 | 0,0172 | |||
| LEA / Lear Corporation | 0,00 | 48,07 | 0,17 | 41,88 | 0,2664 | -0,0069 | |||
| PRMB / Primo Brands Corporation | 0,01 | 0,17 | 0,2658 | 0,2658 | |||||
| IRT / Independence Realty Trust, Inc. | 0,01 | 3.756,47 | 0,17 | 3.220,00 | 0,2656 | 0,0336 | |||
| JXN / Jackson Financial Inc. | 0,00 | -25,61 | 0,17 | -33,60 | 0,2656 | -0,3181 | |||
| URBN / Urban Outfitters, Inc. | 0,00 | 0,17 | 0,2648 | 0,2648 | |||||
| MAT / Mattel, Inc. | 0,01 | 48,19 | 0,17 | 32,00 | 0,2639 | -0,0288 | |||
| CNA / CNA Financial Corporation | 0,00 | 48,32 | 0,16 | 45,13 | 0,2628 | -0,0019 | |||
| OPCH / Option Care Health, Inc. | 0,00 | 44,33 | 0,16 | 41,59 | 0,2563 | -0,0098 | |||
| DECK / Deckers Outdoor Corporation | 0,00 | 27,66 | 0,16 | -3,64 | 0,2551 | -0,1307 | |||
| FSS / Federal Signal Corporation | 0,00 | 20,86 | 0,16 | 39,82 | 0,2533 | -0,0114 | |||
| LIVN / LivaNova PLC | 0,00 | 48,11 | 0,16 | 53,92 | 0,2518 | 0,0126 | |||
| MTCH / Match Group, Inc. | 0,01 | 48,27 | 0,16 | 40,54 | 0,2504 | -0,0110 | |||
| THC / Tenet Healthcare Corporation | 0,00 | -47,18 | 0,16 | -29,73 | 0,2499 | -0,2687 | |||
| CMC / Commercial Metals Company | 0,00 | 48,28 | 0,16 | 43,12 | 0,2498 | -0,0062 | |||
| CNX / CNX Resources Corporation | 0,00 | 48,21 | 0,16 | 65,96 | 0,2496 | 0,0292 | |||
| CNM / Core & Main, Inc. | 0,00 | 13,28 | 0,16 | 21,88 | 0,2494 | -0,0501 | |||
| HLNE / Hamilton Lane Incorporated | 0,00 | 48,63 | 0,15 | 41,67 | 0,2458 | -0,0078 | |||
| CSL / Carlisle Companies Incorporated | 0,00 | -46,47 | 0,15 | -40,39 | 0,2441 | -0,3533 | |||
| WCC / WESCO International, Inc. | 0,00 | 47,75 | 0,15 | 37,04 | 0,2373 | -0,0150 | |||
| OFC / Corporate Office Properties Trust | 0,01 | 0,88 | 0,15 | 2,78 | 0,2369 | -0,1011 | |||
| MWA / Mueller Water Products, Inc. | 0,01 | 0,14 | 0,2304 | 0,2304 | |||||
| CATY / Cathay General Bancorp | 0,00 | 48,17 | 0,14 | 35,24 | 0,2274 | -0,0183 | |||
| STAG / STAG Industrial, Inc. | 0,00 | 48,29 | 0,14 | 47,92 | 0,2270 | 0,0008 | |||
| CBT / Cabot Corporation | 0,00 | 4.152,27 | 0,14 | 4.533,33 | 0,2232 | -0,0621 | |||
| INTA / Intapp, Inc. | 0,00 | 695,28 | 0,14 | 595,00 | 0,2226 | 0,1737 | |||
| TKR / The Timken Company | 0,00 | 48,47 | 0,14 | 25,93 | 0,2181 | -0,0358 | |||
| CACI / CACI International Inc | 0,00 | -41,54 | 0,14 | -25,27 | 0,2174 | -0,2078 | |||
| COLM / Columbia Sportswear Company | 0,00 | 48,25 | 0,14 | 8,87 | 0,2159 | -0,0739 | |||
| LRN / Stride, Inc. | 0,00 | 0,13 | 0,2118 | 0,2118 | |||||
| GL / Globe Life Inc. | 0,00 | 96,87 | 0,13 | 88,41 | 0,2081 | 0,0465 | |||
| CHRD / Chord Energy Corporation | 0,00 | 48,15 | 0,13 | 16,22 | 0,2070 | -0,0523 | |||
| US4039491000 / HF Sinclair Corp. | 0,00 | 48,23 | 0,13 | 52,38 | 0,2054 | 0,0077 | |||
| HWC / Hancock Whitney Corporation | 0,00 | 48,00 | 0,13 | 42,70 | 0,2033 | -0,0065 | |||
| MATX / Matson, Inc. | 0,00 | 48,08 | 0,13 | 15,60 | 0,2020 | -0,0525 | |||
| AMR / Alpha Metallurgical Resources, Inc. | 0,00 | 47,77 | 0,13 | 21,15 | 0,2015 | -0,0431 | |||
| ANF / Abercrombie & Fitch Co. | 0,00 | 48,20 | 0,13 | 12,61 | 0,2008 | -0,0591 | |||
| HOMB / Home Bancshares, Inc. (Conway, AR) | 0,00 | 99,46 | 0,13 | 89,39 | 0,2001 | 0,0449 | |||
| HOG / Harley-Davidson, Inc. | 0,01 | 48,29 | 0,12 | 39,77 | 0,1978 | -0,0096 | |||
| APLE / Apple Hospitality REIT, Inc. | 0,01 | 48,24 | 0,12 | 16,04 | 0,1977 | -0,0514 | |||
| CHRW / C.H. Robinson Worldwide, Inc. | 0,00 | 13,24 | 0,12 | 6,96 | 0,1966 | -0,0721 | |||
| ASO / Academy Sports and Outdoors, Inc. | 0,00 | 48,10 | 0,12 | 22,00 | 0,1963 | -0,0385 | |||
| CNS / Cohen & Steers, Inc. | 0,00 | 48,57 | 0,12 | 30,77 | 0,1907 | -0,0227 | |||
| MAN / ManpowerGroup Inc. | 0,00 | 48,18 | 0,12 | 8,18 | 0,1904 | -0,0676 | |||
| ESAB / ESAB Corporation | 0,00 | 48,30 | 0,12 | 46,25 | 0,1882 | -0,0008 | |||
| GEF / Greif, Inc. | 0,00 | 48,35 | 0,12 | 44,44 | 0,1880 | -0,0027 | |||
| ADNT / Adient plc | 0,01 | 48,18 | 0,12 | 46,25 | 0,1874 | -0,0003 | |||
| TDC / Teradata Corporation | 0,01 | 48,16 | 0,12 | 36,47 | 0,1868 | -0,0132 | |||
| NUS / Nu Skin Enterprises, Inc. | 0,01 | 48,23 | 0,12 | 61,11 | 0,1858 | 0,0177 | |||
| MUR / Murphy Oil Corporation | 0,01 | 48,36 | 0,12 | 17,17 | 0,1855 | -0,0458 | |||
| MAGN / Magnera Corporation | 0,01 | 48,23 | 0,12 | -14,18 | 0,1850 | -0,1278 | |||
| LNTH / Lantheus Holdings, Inc. | 0,00 | 48,43 | 0,11 | 20,00 | 0,1831 | -0,0407 | |||
| CSW / CSW Industrials, Inc. | 0,00 | -39,41 | 0,11 | -39,57 | 0,1817 | -0,2570 | |||
| OLN / Olin Corporation | 0,01 | 48,17 | 0,11 | 13,00 | 0,1812 | -0,0526 | |||
| CUZ / Cousins Properties Incorporated | 0,00 | 48,13 | 0,11 | 37,04 | 0,1777 | -0,0117 | |||
| PK / Park Hotels & Resorts Inc. | 0,01 | 48,16 | 0,11 | 25,00 | 0,1769 | -0,0300 | |||
| M / Macy's, Inc. | 0,01 | 48,19 | 0,11 | 23,26 | 0,1695 | -0,0323 | |||
| HIMS / Hims & Hers Health, Inc. | 0,00 | 196,95 | 0,10 | 271,43 | 0,1668 | 0,1014 | |||
| MUSA / Murphy USA Inc. | 0,00 | -48,38 | 0,10 | -53,00 | 0,1629 | -0,3442 | |||
| REG / Regency Centers Corporation | 0,00 | 0,10 | 0,1627 | 0,1627 | |||||
| NEU / NewMarket Corporation | 0,00 | 79,55 | 0,10 | 119,57 | 0,1625 | -0,0183 | |||
| CCK / Crown Holdings, Inc. | 0,00 | 0,10 | 0,1611 | 0,1611 | |||||
| LPX / Louisiana-Pacific Corporation | 0,00 | 48,34 | 0,10 | 33,33 | 0,1607 | -0,0145 | |||
| MBC / MasterBrand, Inc. | 0,01 | 48,17 | 0,10 | 7,87 | 0,1545 | -0,0545 | |||
| RS / Reliance, Inc. | 0,00 | 46,64 | 0,10 | 43,94 | 0,1529 | -0,0018 | |||
| US61747C5821 / Morgan Stanley Institutional Liquidity Funds - Treasury Portfolio | 0,10 | 24,46 | 0,10 | 25,00 | 0,1529 | -0,0267 | |||
| CIVI / Civitas Resources, Inc. | 0,00 | 48,34 | 0,09 | 5,75 | 0,1484 | -0,0564 | |||
| AEO / American Eagle Outfitters, Inc. | 0,01 | 48,26 | 0,09 | 24,66 | 0,1463 | -0,0259 | |||
| ATKR / Atkore Inc. | 0,00 | 48,15 | 0,09 | 56,90 | 0,1456 | 0,0099 | |||
| STRL / Sterling Infrastructure, Inc. | 0,00 | 48,75 | 0,09 | 122,50 | 0,1429 | 0,0479 | |||
| DXC / DXC Technology Company | 0,01 | 48,14 | 0,09 | 21,92 | 0,1429 | -0,0275 | |||
| TGTX / TG Therapeutics, Inc. | 0,00 | 905,42 | 0,08 | 4.100,00 | 0,1353 | 0,0953 | |||
| BBWI / Bath & Body Works, Inc. | 0,00 | 48,29 | 0,08 | 15,07 | 0,1346 | -0,0363 | |||
| SM / SM Energy Company | 0,00 | 48,07 | 0,08 | 5,33 | 0,1274 | -0,0483 | |||
| ITRI / Itron, Inc. | 0,00 | 171,20 | 0,08 | 188,89 | 0,1252 | 0,0616 | |||
| BMI / Badger Meter, Inc. | 0,00 | 207,84 | 0,08 | 266,67 | 0,1245 | 0,0744 | |||
| DOCS / Doximity, Inc. | 0,00 | 42,00 | 0,08 | 4,05 | 0,1240 | -0,0488 | |||
| QTWO / Q2 Holdings, Inc. | 0,00 | 47,67 | 0,08 | 48,08 | 0,1238 | 0,0015 | |||
| AIZ / Assurant, Inc. | 0,00 | -49,80 | 0,07 | -51,32 | 0,1196 | -0,2370 | |||
| GMED / Globus Medical, Inc. | 0,00 | 48,15 | 0,07 | 8,96 | 0,1172 | -0,0397 | |||
| EXP / Eagle Materials Inc. | 0,00 | -52,43 | 0,07 | -57,56 | 0,1169 | -0,2849 | |||
| GEN / Gen Digital Inc. | 0,00 | 48,38 | 0,07 | 55,56 | 0,1126 | 0,0062 | |||
| HSIC / Henry Schein, Inc. | 0,00 | 47,79 | 0,07 | 42,86 | 0,1123 | -0,0022 | |||
| APPF / AppFolio, Inc. | 0,00 | -39,96 | 0,07 | -41,23 | 0,1079 | -0,1589 | |||
| AGCO / AGCO Corporation | 0,00 | -43,22 | 0,07 | -42,61 | 0,1055 | -0,1632 | |||
| NSIT / Insight Enterprises, Inc. | 0,00 | 47,27 | 0,06 | 26,00 | 0,1012 | -0,0173 | |||
| VNT / Vontier Corporation | 0,00 | 48,03 | 0,06 | 43,18 | 0,1008 | -0,0032 | |||
| NBIX / Neurocrine Biosciences, Inc. | 0,00 | -32,23 | 0,06 | -30,34 | 0,1004 | -0,1085 | |||
| CPT / Camden Property Trust | 0,00 | 41,78 | 0,06 | 32,61 | 0,0987 | -0,0087 | |||
| MANH / Manhattan Associates, Inc. | 0,00 | -32,61 | 0,06 | -28,40 | 0,0935 | -0,0965 | |||
| RGLD / Royal Gold, Inc. | 0,00 | -74,69 | 0,06 | -69,47 | 0,0933 | -0,3514 | |||
| LAMR / Lamar Advertising Company | 0,00 | -68,57 | 0,05 | -69,36 | 0,0847 | -0,3213 | |||
| WWD / Woodward, Inc. | 0,00 | -34,14 | 0,05 | -20,90 | 0,0846 | -0,1736 | |||
| WU / The Western Union Company | 0,01 | 48,32 | 0,05 | 27,50 | 0,0829 | -0,0124 | |||
| CAH / Cardinal Health, Inc. | 0,00 | 12,37 | 0,05 | 35,14 | 0,0807 | -0,0073 | |||
| ST / Sensata Technologies Holding plc | 0,00 | 0,05 | 0,0777 | 0,0777 | |||||
| DCI / Donaldson Company, Inc. | 0,00 | 40,37 | 0,05 | 42,42 | 0,0761 | -0,0026 | |||
| APA / APA Corporation | 0,00 | 48,27 | 0,04 | 23,53 | 0,0673 | -0,0134 | |||
| WTS / Watts Water Technologies, Inc. | 0,00 | 0,04 | 0,0615 | 0,0615 | |||||
| QRVO / Qorvo, Inc. | 0,00 | 47,42 | 0,04 | 56,52 | 0,0589 | 0,0031 | |||
| ASGN / ASGN Incorporated | 0,00 | 47,94 | 0,04 | 16,13 | 0,0575 | -0,0150 | |||
| LKQ / LKQ Corporation | 0,00 | 48,47 | 0,04 | 45,83 | 0,0566 | -0,0015 | |||
| MMS / Maximus, Inc. | 0,00 | 49,21 | 0,03 | 70,00 | 0,0548 | 0,0065 | |||
| ADMA / ADMA Biologics, Inc. | 0,00 | 0,03 | 0,0542 | 0,0542 | |||||
| OGN / Organon & Co. | 0,00 | 48,31 | 0,03 | -8,33 | 0,0541 | -0,0321 | |||
| CRI / Carter's, Inc. | 0,00 | 48,35 | 0,03 | 13,79 | 0,0540 | -0,0160 | |||
| SWKS / Skyworks Solutions, Inc. | 0,00 | 47,71 | 0,03 | 57,14 | 0,0532 | 0,0024 | |||
| CROX / Crocs, Inc. | 0,00 | 46,85 | 0,03 | 50,00 | 0,0531 | 0,0015 | |||
| SMTC / Semtech Corporation | 0,00 | 47,73 | 0,03 | 47,62 | 0,0504 | -0,0006 | |||
| MMSI / Merit Medical Systems, Inc. | 0,00 | 49,06 | 0,03 | 42,86 | 0,0480 | -0,0025 | |||
| CAG / Conagra Brands, Inc. | 0,00 | 47,75 | 0,03 | 33,33 | 0,0456 | -0,0047 | |||
| CXT / Crane NXT, Co. | 0,00 | 47,74 | 0,03 | 47,37 | 0,0448 | -0,0013 | |||
| DVA / DaVita Inc. | 0,00 | 49,24 | 0,03 | 36,84 | 0,0429 | -0,0027 | |||
| HPP / Hudson Pacific Properties, Inc. | 0,01 | 48,18 | 0,03 | -16,13 | 0,0428 | -0,0317 | |||
| ACLS / Axcelis Technologies, Inc. | 0,00 | 47,35 | 0,03 | 56,25 | 0,0400 | 0,0014 | |||
| TPH / Tri Pointe Homes, Inc. | 0,00 | -24,58 | 0,02 | -32,35 | 0,0383 | -0,0414 | |||
| NAVI / Navient Corporation | 0,00 | 48,46 | 0,02 | 40,00 | 0,0351 | -0,0017 | |||
| JLL / Jones Lang LaSalle Incorporated | 0,00 | 44,83 | 0,02 | 20,00 | 0,0299 | -0,0069 | |||
| AMN / AMN Healthcare Services, Inc. | 0,00 | 47,61 | 0,01 | 37,50 | 0,0177 | -0,0033 | |||
| ZETA / Zeta Global Holdings Corp. | 0,00 | -100,00 | 0,00 | -100,00 | -0,0389 | ||||
| PSN / Parsons Corporation | 0,00 | -100,00 | 0,00 | -100,00 | -0,3410 | ||||
| CTRE / CareTrust REIT, Inc. | 0,00 | -100,00 | 0,00 | -100,00 | -0,2396 | ||||
| SPSC / SPS Commerce, Inc. | 0,00 | -100,00 | 0,00 | -100,00 | -0,0345 | ||||
| ERIE / Erie Indemnity Company | 0,00 | -100,00 | 0,00 | -100,00 | -0,4017 | ||||
| CUBE / CubeSmart | 0,00 | -100,00 | 0,00 | -100,00 | -0,0886 |