Grundlæggende statistik
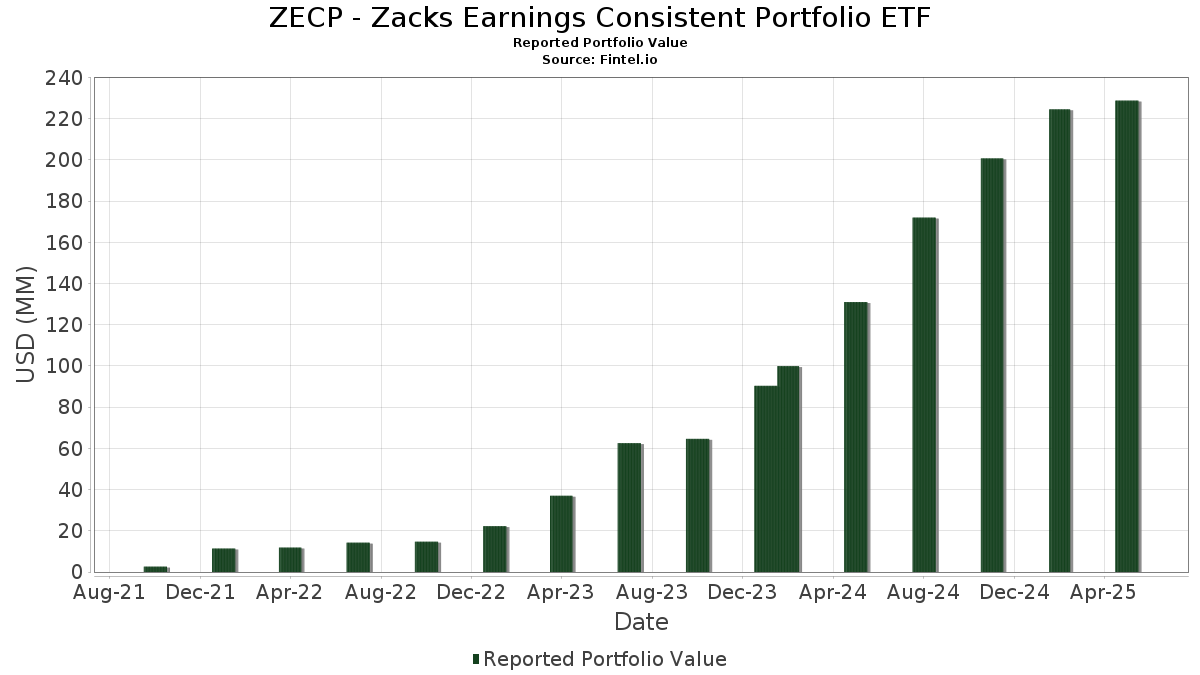
| Porteføljeværdi | $ 228.813.648 |
| Nuværende stillinger | 60 |
Seneste beholdninger, ydeevne, AUM (fra 13F, 13D)
ZECP - Zacks Earnings Consistent Portfolio ETF har afsløret 60 samlede besiddelser i deres seneste SEC-arkivering. Den seneste porteføljeværdi er beregnet til at være $ 228.813.648 USD. Faktiske aktiver under forvaltning (AUM) er denne værdi plus kontanter (som ikke er oplyst). ZECP - Zacks Earnings Consistent Portfolio ETFs største beholdninger er Microsoft Corporation (US:MSFT) , Apple Inc. (US:AAPL) , Alphabet Inc. (US:GOOGL) , Netflix, Inc. (US:NFLX) , and JPMorgan Chase & Co. (US:JPM) . ZECP - Zacks Earnings Consistent Portfolio ETFs nye stillinger omfatter Salesforce, Inc. (US:CRM) , .
Top øger dette kvartal
Vi bruger ændringen i porteføljeallokeringen, fordi dette er den mest meningsfulde metrik. Ændringer kan skyldes handler eller ændringer i aktiekurser.
| Sikkerhed | Aktier (MM) |
Værdi (MM$) |
Portefølje % | ΔPortefølje % |
|---|---|---|---|---|
| CRM / Salesforce, Inc. | 0,01 | 2,52 | 1,0842 | 1,0842 |
| MSFT / Microsoft Corporation | 0,03 | 14,92 | 6,4102 | 1,0185 |
| CSCO / Cisco Systems, Inc. | 0,05 | 3,05 | 1,3100 | 0,8305 |
| CAH / Cardinal Health, Inc. | 0,02 | 3,75 | 1,6091 | 0,8039 |
| NFLX / Netflix, Inc. | 0,01 | 7,67 | 3,2945 | 0,6847 |
| TJX / The TJX Companies, Inc. | 0,03 | 3,69 | 1,5831 | 0,4757 |
| INTU / Intuit Inc. | 0,00 | 3,34 | 1,4361 | 0,2966 |
| CTAS / Cintas Corporation | 0,02 | 5,09 | 2,1858 | 0,2324 |
| HIG / The Hartford Insurance Group, Inc. | 0,04 | 4,74 | 2,0340 | 0,2264 |
| RSG / Republic Services, Inc. | 0,02 | 4,94 | 2,1204 | 0,2146 |
Top falder i dette kvartal
Vi bruger ændringen i porteføljeallokeringen, fordi dette er den mest meningsfulde metrik. Ændringer kan skyldes handler eller ændringer i aktiekurser.
| Sikkerhed | Aktier (MM) |
Værdi (MM$) |
Portefølje % | ΔPortefølje % |
|---|---|---|---|---|
| UNH / UnitedHealth Group Incorporated | 0,00 | 0,01 | 0,0049 | -2,2634 |
| AAPL / Apple Inc. | 0,06 | 12,97 | 5,5732 | -0,9725 |
| LLY / Eli Lilly and Company | 0,01 | 5,00 | 2,1458 | -0,4687 |
| FI / Fiserv, Inc. | 0,01 | 2,23 | 0,9570 | -0,3948 |
| TMO / Thermo Fisher Scientific Inc. | 0,00 | 1,83 | 0,7875 | -0,2212 |
| PEP / PepsiCo, Inc. | 0,02 | 3,10 | 1,3335 | -0,1850 |
| TFC / Truist Financial Corporation | 0,07 | 2,76 | 1,1839 | -0,1712 |
| BMY / Bristol-Myers Squibb Company | 0,03 | 1,44 | 0,6167 | -0,1262 |
| HD / The Home Depot, Inc. | 0,01 | 5,44 | 2,3372 | -0,1170 |
| ACN / Accenture plc | 0,01 | 3,52 | 1,5112 | -0,1093 |
13F og Fondsarkivering
Denne formular blev indsendt den 2025-07-30 for rapporteringsperioden 2025-05-31. Klik på linkikonet for at se den fulde transaktionshistorik.
Opgrader for at låse op for premium-data og eksportere til Excel ![]() .
.
| Sikkerhed | Type | Gennemsnitlig aktiekurs | Aktier (MM) |
Δ Aktier (%) |
Δ Aktier (%) |
Værdi ($MM) |
Portefølje (%) |
ΔPortefølje (%) |
|
|---|---|---|---|---|---|---|---|---|---|
| MSFT / Microsoft Corporation | 0,03 | 5,95 | 14,92 | 22,86 | 6,4102 | 1,0185 | |||
| AAPL / Apple Inc. | 0,06 | 5,94 | 12,97 | -12,02 | 5,5732 | -0,9725 | |||
| GOOGL / Alphabet Inc. | 0,06 | 5,95 | 10,66 | 6,86 | 4,5773 | 0,1509 | |||
| NFLX / Netflix, Inc. | 0,01 | 5,95 | 7,67 | 30,45 | 3,2945 | 0,6847 | |||
| JPM / JPMorgan Chase & Co. | 0,03 | 5,93 | 7,21 | 5,67 | 3,0992 | 0,0685 | |||
| WMT / Walmart Inc. | 0,07 | 5,24 | 6,86 | 5,35 | 2,9457 | 0,0564 | |||
| PG / The Procter & Gamble Company | 0,04 | 5,93 | 6,35 | 3,52 | 2,7256 | 0,0049 | |||
| AXP / American Express Company | 0,02 | 5,96 | 6,13 | 3,53 | 2,6337 | 0,0049 | |||
| CAT / Caterpillar Inc. | 0,02 | 5,95 | 5,59 | 7,20 | 2,3993 | 0,0866 | |||
| HD / The Home Depot, Inc. | 0,01 | 5,98 | 5,44 | -1,59 | 2,3372 | -0,1170 | |||
| CTAS / Cintas Corporation | 0,02 | 5,93 | 5,09 | 15,64 | 2,1858 | 0,2324 | |||
| MMC / Marsh & McLennan Companies, Inc. | 0,02 | 5,97 | 5,01 | 4,12 | 2,1513 | 0,0159 | |||
| LLY / Eli Lilly and Company | 0,01 | 5,85 | 5,00 | -15,20 | 2,1458 | -0,4687 | |||
| RSG / Republic Services, Inc. | 0,02 | 5,91 | 4,94 | 14,98 | 2,1204 | 0,2146 | |||
| SNPS / Synopsys, Inc. | 0,01 | 5,96 | 4,77 | 7,51 | 2,0486 | 0,0796 | |||
| HIG / The Hartford Insurance Group, Inc. | 0,04 | 5,93 | 4,74 | 16,28 | 2,0340 | 0,2264 | |||
| AEP / American Electric Power Company, Inc. | 0,04 | 5,94 | 4,33 | 3,39 | 1,8601 | 0,0008 | |||
| AMP / Ameriprise Financial, Inc. | 0,01 | 6,02 | 4,27 | 0,47 | 1,8344 | -0,0521 | |||
| CAH / Cardinal Health, Inc. | 0,02 | 73,13 | 3,75 | 106,50 | 1,6091 | 0,8039 | |||
| TJX / The TJX Companies, Inc. | 0,03 | 45,23 | 3,69 | 47,75 | 1,5831 | 0,4757 | |||
| RTX / RTX Corporation | 0,03 | 5,94 | 3,64 | 8,72 | 1,5642 | 0,0775 | |||
| AMAT / Applied Materials, Inc. | 0,02 | 5,93 | 3,53 | 5,07 | 1,5142 | 0,0246 | |||
| ACN / Accenture plc | 0,01 | 6,00 | 3,52 | -3,64 | 1,5112 | -0,1093 | |||
| INTU / Intuit Inc. | 0,00 | 6,10 | 3,34 | 30,23 | 1,4361 | 0,2966 | |||
| ORCL / Oracle Corporation | 0,02 | 5,92 | 3,27 | 5,58 | 1,4060 | 0,0299 | |||
| MCO / Moody's Corporation | 0,01 | 5,94 | 3,20 | 0,79 | 1,3737 | -0,0351 | |||
| BSX / Boston Scientific Corporation | 0,03 | 5,94 | 3,16 | 7,45 | 1,3568 | 0,0519 | |||
| JNJ / Johnson & Johnson | 0,02 | 5,96 | 3,14 | -0,35 | 1,3496 | -0,0497 | |||
| PEP / PepsiCo, Inc. | 0,02 | 5,95 | 3,10 | -9,24 | 1,3335 | -0,1850 | |||
| MET / MetLife, Inc. | 0,04 | 5,94 | 3,07 | -3,42 | 1,3208 | -0,0922 | |||
| MAR / Marriott International, Inc. | 0,01 | 5,88 | 3,07 | -0,42 | 1,3187 | -0,0494 | |||
| CSCO / Cisco Systems, Inc. | 0,05 | 187,13 | 3,05 | 182,31 | 1,3100 | 0,8305 | |||
| CDNS / Cadence Design Systems, Inc. | 0,01 | 5,89 | 2,98 | 21,38 | 1,2807 | 0,1901 | |||
| ABT / Abbott Laboratories | 0,02 | 5,91 | 2,93 | 2,52 | 1,2593 | -0,0102 | |||
| AMGN / Amgen Inc. | 0,01 | 6,00 | 2,86 | -0,83 | 1,2275 | -0,0517 | |||
| WRB / W. R. Berkley Corporation | 0,04 | 5,94 | 2,76 | 25,43 | 1,1866 | 0,2091 | |||
| TFC / Truist Financial Corporation | 0,07 | 5,94 | 2,76 | -9,70 | 1,1839 | -0,1712 | |||
| SYK / Stryker Corporation | 0,01 | 6,00 | 2,64 | 5,05 | 1,1349 | 0,0183 | |||
| HSY / The Hershey Company | 0,02 | 5,97 | 2,62 | -1,39 | 1,1247 | -0,0541 | |||
| MCD / McDonald's Corporation | 0,01 | 5,92 | 2,58 | 7,83 | 1,1066 | 0,0460 | |||
| SO / The Southern Company | 0,03 | 5,95 | 2,53 | 6,21 | 1,0883 | 0,0293 | |||
| CRM / Salesforce, Inc. | 0,01 | 2,52 | 1,0842 | 1,0842 | |||||
| AWK / American Water Works Company, Inc. | 0,02 | 5,94 | 2,51 | 11,40 | 1,0794 | 0,0781 | |||
| IBM / International Business Machines Corporation | 0,01 | 5,86 | 2,39 | 8,66 | 1,0247 | 0,0500 | |||
| PNC / The PNC Financial Services Group, Inc. | 0,01 | 5,91 | 2,33 | -4,07 | 1,0015 | -0,0775 | |||
| EMR / Emerson Electric Co. | 0,02 | 5,94 | 2,28 | 3,97 | 0,9797 | 0,0062 | |||
| TXN / Texas Instruments Incorporated | 0,01 | 5,90 | 2,23 | -1,20 | 0,9582 | -0,0440 | |||
| FI / Fiserv, Inc. | 0,01 | 5,92 | 2,23 | -26,86 | 0,9570 | -0,3948 | |||
| GD / General Dynamics Corporation | 0,01 | 5,92 | 2,12 | 16,77 | 0,9096 | 0,1047 | |||
| LH / Labcorp Holdings Inc. | 0,01 | 5,94 | 2,12 | 5,07 | 0,9086 | 0,0149 | |||
| MAA / Mid-America Apartment Communities, Inc. | 0,01 | 5,89 | 2,11 | -1,36 | 0,9046 | -0,0428 | |||
| BLK / BlackRock, Inc. | 0,00 | 5,94 | 2,08 | 6,18 | 0,8932 | 0,0238 | |||
| TMO / Thermo Fisher Scientific Inc. | 0,00 | 5,94 | 1,83 | -19,32 | 0,7875 | -0,2212 | |||
| NEE / NextEra Energy, Inc. | 0,02 | 5,92 | 1,76 | 6,60 | 0,7568 | 0,0234 | |||
| CHD / Church & Dwight Co., Inc. | 0,02 | 5,93 | 1,70 | -6,38 | 0,7315 | -0,0757 | |||
| PLD / Prologis, Inc. | 0,01 | 5,95 | 1,55 | -7,15 | 0,6642 | -0,0750 | |||
| BMY / Bristol-Myers Squibb Company | 0,03 | 5,94 | 1,44 | -14,23 | 0,6167 | -0,1262 | |||
| MRK / Merck & Co., Inc. | 0,02 | 5,93 | 1,38 | -11,79 | 0,5913 | -0,1012 | |||
| NDAQ / Nasdaq, Inc. | 0,01 | 5,95 | 1,11 | 6,92 | 0,4782 | 0,0160 | |||
| UNH / UnitedHealth Group Incorporated | 0,00 | -99,65 | 0,01 | -99,78 | 0,0049 | -2,2634 |