Grundlæggende statistik
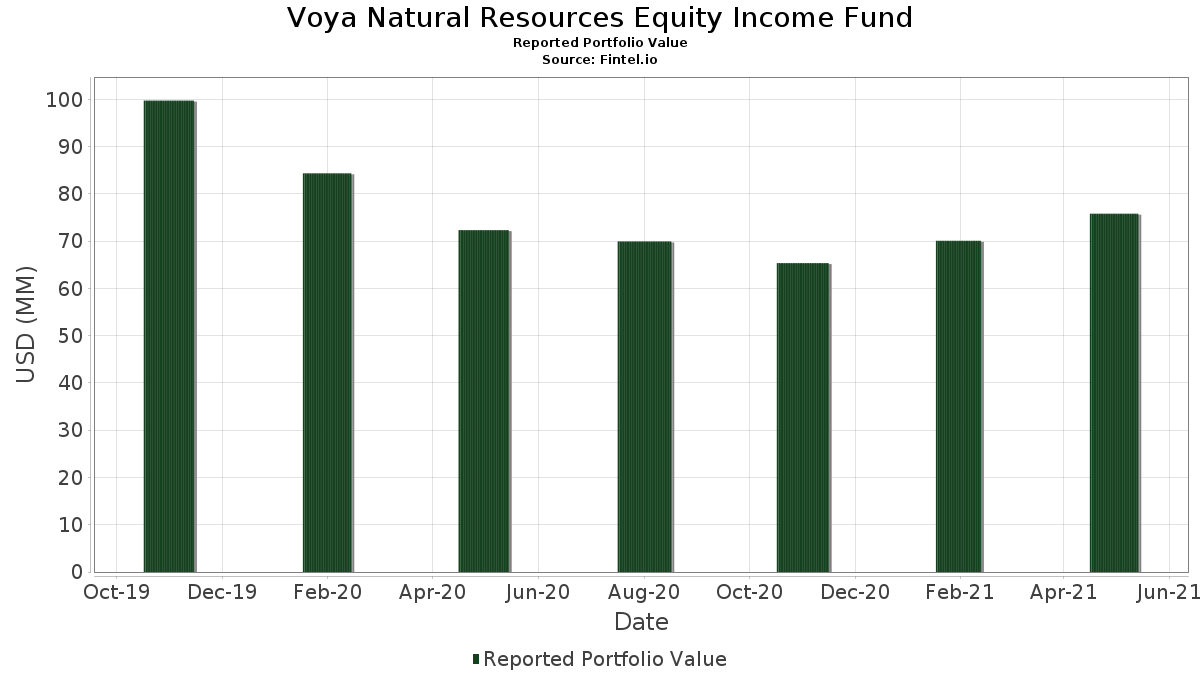
| Porteføljeværdi | $ 75.814.258 |
| Nuværende stillinger | 76 |
Seneste beholdninger, ydeevne, AUM (fra 13F, 13D)
Voya Natural Resources Equity Income Fund har afsløret 76 samlede besiddelser i deres seneste SEC-arkivering. Den seneste porteføljeværdi er beregnet til at være $ 75.814.258 USD. Faktiske aktiver under forvaltning (AUM) er denne værdi plus kontanter (som ikke er oplyst). Voya Natural Resources Equity Income Funds største beholdninger er Chevron Corporation (US:CVX) , Exxon Mobil Corporation (US:XOM) , Enbridge Inc. (US:ENB) , ConocoPhillips (US:COP) , and Freeport-McMoRan Inc. (US:FCX) . Voya Natural Resources Equity Income Funds nye stillinger omfatter Hecla Mining Company (US:HL) , .
Top øger dette kvartal
Vi bruger ændringen i porteføljeallokeringen, fordi dette er den mest meningsfulde metrik. Ændringer kan skyldes handler eller ændringer i aktiekurser.
| Sikkerhed | Aktier (MM) |
Værdi (MM$) |
Portefølje % | ΔPortefølje % |
|---|---|---|---|---|
| 0,02 | 1,26 | 1,6539 | 0,7311 | |
| 0,03 | 2,47 | 3,2460 | 0,4790 | |
| 0,03 | 0,28 | 0,3621 | 0,3621 | |
| 0,01 | 1,47 | 1,9380 | 0,3407 | |
| 0,08 | 1,81 | 2,3866 | 0,3337 | |
| 0,01 | 0,77 | 1,0171 | 0,2877 | |
| 0,08 | 3,19 | 4,2017 | 0,2846 | |
| 0,03 | 0,88 | 1,1606 | 0,2567 | |
| 0,01 | 0,58 | 0,7584 | 0,1947 | |
| 0,01 | 0,64 | 0,8408 | 0,1745 |
Top falder i dette kvartal
Vi bruger ændringen i porteføljeallokeringen, fordi dette er den mest meningsfulde metrik. Ændringer kan skyldes handler eller ændringer i aktiekurser.
| Sikkerhed | Aktier (MM) |
Værdi (MM$) |
Portefølje % | ΔPortefølje % |
|---|---|---|---|---|
| 0,11 | 6,69 | 8,8008 | -3,2646 | |
| 0,07 | 6,92 | 9,1040 | -1,4548 | |
| 0,06 | 3,07 | 4,0430 | -1,0530 | |
| 0,02 | 1,67 | 2,2011 | -0,6410 | |
| 0,04 | 1,89 | 2,4823 | -0,4775 | |
| 0,01 | 1,21 | 1,5881 | -0,4280 | |
| 0,02 | 0,19 | 0,2537 | -0,4273 | |
| 0,05 | 1,69 | 2,2298 | -0,4137 | |
| 0,01 | 0,84 | 1,0993 | -0,4020 | |
| 0,01 | 1,60 | 2,1024 | -0,3175 |
13F og Fondsarkivering
Denne formular blev indsendt den 2021-07-26 for rapporteringsperioden 2021-05-28. Klik på linkikonet for at se den fulde transaktionshistorik.
Opgrader for at låse op for premium-data og eksportere til Excel ![]() .
.
| Sikkerhed | Type | Gennemsnitlig aktiekurs | Aktier (MM) |
Δ Aktier (%) |
Δ Aktier (%) |
Værdi ($MM) |
Portefølje (%) |
ΔPortefølje (%) |
|
|---|---|---|---|---|---|---|---|---|---|
| CVX / Chevron Corporation | 0,07 | -10,25 | 6,92 | -6,86 | 9,1040 | -1,4548 | |||
| XOM / Exxon Mobil Corporation | 0,11 | -26,60 | 6,69 | -21,20 | 8,8008 | -3,2646 | |||
| ENB / Enbridge Inc. | 0,08 | 1,82 | 3,19 | 15,90 | 4,2017 | 0,2846 | |||
| COP / ConocoPhillips | 0,06 | -20,03 | 3,07 | -14,29 | 4,0430 | -1,0530 | |||
| FCX / Freeport-McMoRan Inc. | 0,06 | -17,09 | 2,66 | 4,43 | 3,5032 | -0,1203 | |||
| NEM / Newmont Corporation | 0,03 | -6,21 | 2,47 | 26,79 | 3,2460 | 0,4790 | |||
| EOG / EOG Resources, Inc. | 0,03 | -10,25 | 2,18 | 11,66 | 2,8742 | 0,0940 | |||
| TRP / TC Energy Corporation | 0,04 | -25,60 | 1,89 | -9,37 | 2,4823 | -0,4775 | |||
| CNQ / Canadian Natural Resources Limited | 0,05 | -10,25 | 1,84 | 13,86 | 2,4223 | 0,1238 | |||
| MPC / Marathon Petroleum Corporation | 0,03 | -3,15 | 1,82 | 9,60 | 2,3891 | 0,0338 | |||
| B / Barrick Mining Corporation | 0,08 | -2,62 | 1,81 | 25,64 | 2,3866 | 0,3337 | |||
| WMB / The Williams Companies, Inc. | 0,07 | -2,09 | 1,73 | 12,92 | 2,2780 | 0,0986 | |||
| SU / Suncor Energy Inc. | 0,07 | 0,10 | 1,73 | 16,48 | 2,2708 | 0,1637 | |||
| KMI / Kinder Morgan, Inc. | 0,09 | -12,73 | 1,71 | 8,88 | 2,2450 | 0,0174 | |||
| SLB / Schlumberger Limited | 0,05 | -18,82 | 1,69 | -8,88 | 2,2298 | -0,4137 | |||
| PSX / Phillips 66 | 0,02 | -17,50 | 1,67 | -16,32 | 2,2011 | -0,6410 | |||
| VLO / Valero Energy Corporation | 0,02 | -7,91 | 1,61 | -3,83 | 2,1184 | -0,2610 | |||
| PXD / Pioneer Natural Resources Company | 0,01 | -8,37 | 1,60 | -6,11 | 2,1024 | -0,3175 | |||
| FNV / Franco-Nevada Corporation | 0,01 | -6,24 | 1,47 | 31,08 | 1,9380 | 0,3407 | |||
| IP / International Paper Company | 0,02 | 52,35 | 1,26 | 93,83 | 1,6539 | 0,7311 | |||
| VMC / Vulcan Materials Company | 0,01 | -22,48 | 1,21 | -14,89 | 1,5881 | -0,4280 | |||
| AVY / Avery Dennison Corporation | 0,01 | -13,45 | 1,17 | 8,97 | 1,5349 | 0,0127 | |||
| WPM / Wheaton Precious Metals Corp. | 0,02 | -10,25 | 1,09 | 20,64 | 1,4387 | 0,1497 | |||
| HAL / Halliburton Company | 0,04 | -6,69 | 0,96 | -4,10 | 1,2632 | -0,1589 | |||
| CCK / Crown Holdings, Inc. | 0,01 | -10,25 | 0,94 | -3,09 | 1,2406 | -0,1417 | |||
| BKR / Baker Hughes Company | 0,04 | 14,97 | 0,88 | 14,56 | 1,1608 | 0,0664 | |||
| DVN / Devon Energy Corporation | 0,03 | 12,50 | 0,88 | 38,74 | 1,1606 | 0,2567 | |||
| PPL / Pembina Pipeline Corporation | 0,03 | -10,26 | 0,84 | 14,31 | 1,1045 | 0,0600 | |||
| OXY / Occidental Petroleum Corporation | 0,03 | -10,26 | 0,84 | -12,43 | 1,1036 | -0,2582 | |||
| BLL / Ball Corp. | 0,01 | -17,78 | 0,84 | -20,85 | 1,0993 | -0,4020 | |||
| PKG / Packaging Corporation of America | 0,01 | -14,26 | 0,81 | -3,46 | 1,0671 | -0,1270 | |||
| SEE / Sealed Air Corporation | 0,01 | 11,00 | 0,77 | 50,49 | 1,0171 | 0,2877 | |||
| FANG / Diamondback Energy, Inc. | 0,01 | -10,26 | 0,76 | 3,85 | 0,9951 | -0,0414 | |||
| OKE / ONEOK, Inc. | 0,01 | -16,25 | 0,73 | -0,27 | 0,9582 | -0,0798 | |||
| BERY / Berry Global Group, Inc. | 0,01 | -14,95 | 0,69 | 4,71 | 0,9075 | -0,0288 | |||
| HES / Hess Corporation | 0,01 | 6,59 | 0,64 | 36,32 | 0,8408 | 0,1745 | |||
| RGLD / Royal Gold, Inc. | 0,01 | -0,81 | 0,64 | 18,25 | 0,8370 | 0,0731 | |||
| WRK / WestRock Company | 0,01 | -34,66 | 0,61 | -12,63 | 0,8026 | -0,1893 | |||
| TRGP / Targa Resources Corp. | 0,02 | -3,48 | 0,61 | 21,40 | 0,7994 | 0,0872 | |||
| MLM / Martin Marietta Materials, Inc. | 0,00 | -10,20 | 0,60 | -3,08 | 0,7883 | -0,0902 | |||
| LNG / Cheniere Energy, Inc. | 0,01 | 15,37 | 0,58 | 45,45 | 0,7584 | 0,1947 | |||
| XEC / Cimarex Energy Co. | 0,01 | -18,46 | 0,51 | -4,66 | 0,6740 | -0,0903 | |||
| AEM / Agnico Eagle Mines Limited | 0,01 | -35,57 | 0,51 | -17,29 | 0,6678 | -0,2042 | |||
| MRO / Marathon Oil Corporation | 0,04 | 3,03 | 0,50 | 12,39 | 0,6577 | 0,0256 | |||
| LPX / Louisiana-Pacific Corporation | 0,01 | -30,05 | 0,49 | -1,20 | 0,6481 | -0,0609 | |||
| APA / APA Corporation | 0,02 | -1,03 | 0,46 | 4,32 | 0,6048 | -0,0214 | |||
| AMCR / Amcor plc | 0,04 | -19,60 | 0,46 | -13,33 | 0,6001 | -0,1475 | |||
| KGC / Kinross Gold Corporation | 0,05 | -25,19 | 0,41 | -2,86 | 0,5379 | -0,0596 | |||
| TECK / Teck Resources Limited | 0,02 | 1,89 | 0,40 | 20,80 | 0,5212 | 0,0553 | |||
| CMP / Compass Minerals International, Inc. | 0,01 | 0,72 | 0,37 | 11,78 | 0,4876 | 0,0156 | |||
| SUM / Summit Materials, Inc. | 0,01 | -29,84 | 0,36 | -11,95 | 0,4760 | -0,1073 | |||
| CVE / Cenovus Energy Inc. | 0,04 | 1,16 | 0,35 | 11,22 | 0,4569 | 0,0122 | |||
| YRI / Yamana Gold Inc | 0,06 | -9,75 | 0,34 | 17,96 | 0,4420 | 0,0371 | |||
| TFDXX / Blackrock Liquidity Funds - BlackRock Liquidity Funds FedFund Portfolio Institutional Class | 0,32 | -9,35 | 0,32 | -9,35 | 0,4212 | -0,0808 | |||
| NOV / NOV Inc. | 0,02 | -22,09 | 0,31 | -16,89 | 0,4024 | -0,1202 | |||
| BTG / B2Gold Corp. | 0,06 | -9,75 | 0,28 | 5,26 | 0,3695 | -0,0095 | |||
| HL / Hecla Mining Company | 0,03 | 0,28 | 0,3621 | 0,3621 | |||||
| AGI / Alamos Gold Inc. | 0,03 | 22,62 | 0,27 | 57,40 | 0,3513 | 0,1106 | |||
| KL / Kirkland Lake Gold Ltd | 0,01 | -28,90 | 0,26 | -6,05 | 0,3482 | -0,0514 | |||
| ETRN / Equitrans Midstream Corporation | 0,03 | -9,75 | 0,26 | 3,13 | 0,3477 | -0,0175 | |||
| EXP / Eagle Materials Inc. | 0,00 | -34,94 | 0,25 | 17,05 | 0,3346 | 0,0242 | |||
| PAAS / Pan American Silver Corp. | 0,01 | -32,71 | 0,24 | -31,52 | 0,3155 | -0,1817 | |||
| ATR / AptarGroup, Inc. | 0,00 | -9,77 | 0,23 | 2,18 | 0,3081 | -0,0176 | |||
| EQT / EQT Corporation | 0,01 | -10,38 | 0,22 | 5,21 | 0,2924 | -0,0079 | |||
| CHX / ChampionX Corporation | 0,01 | -53,18 | 0,22 | 21,47 | 0,2833 | 0,0300 | |||
| CCJ / Cameco Corporation | 0,01 | -10,38 | 0,21 | 13,83 | 0,2829 | 0,0155 | |||
| AA / Alcoa Corporation | 0,01 | -26,89 | 0,21 | 18,23 | 0,2825 | 0,0242 | |||
| INT / World Fuel Services Corp. | 0,01 | -9,76 | 0,21 | -10,82 | 0,2719 | -0,0573 | |||
| AM / Antero Midstream Corporation | 0,02 | 9,57 | 0,20 | 19,30 | 0,2685 | 0,0253 | |||
| OVV / Ovintiv Inc. | 0,01 | -34,75 | 0,20 | -24,71 | 0,2577 | -0,1119 | |||
| NG / NovaGold Resources Inc. | 0,02 | 16,79 | 0,19 | 43,70 | 0,2564 | 0,0634 | |||
| FTI / TechnipFMC plc | 0,02 | -58,28 | 0,19 | -57,05 | 0,2537 | -0,4273 | |||
| COG / Cabot Oil & Gas Corp. | 0,01 | -53,22 | 0,15 | -58,73 | 0,1972 | -0,3168 | |||
| ARNC / Arconic Corporation | 0,00 | -100,00 | 0,00 | -100,00 | -0,2413 | ||||
| SSRGF / SSR Mining Inc. - Depositary Receipt (Common Stock) | 0,00 | -100,00 | 0,00 | -100,00 | -0,1680 | ||||
| WFT / West Fraser Timber Co Ltd | 0,00 | -100,00 | 0,00 | -100,00 | -0,2657 | ||||
| US90269A5341 / UBSW (LUV) (conv) 4.25% 2/6/2020 | -0,03 | 172,73 | -0,0398 | -0,0283 | |||||
| US90269A5341 / UBSW (LUV) (conv) 4.25% 2/6/2020 | -0,04 | 227,27 | -0,0483 | -0,0369 | |||||
| US06747W8495 / Barclays Bank plc into Metlife, Inc. | -0,05 | 336,36 | -0,0645 | -0,0530 |