Grundlæggende statistik
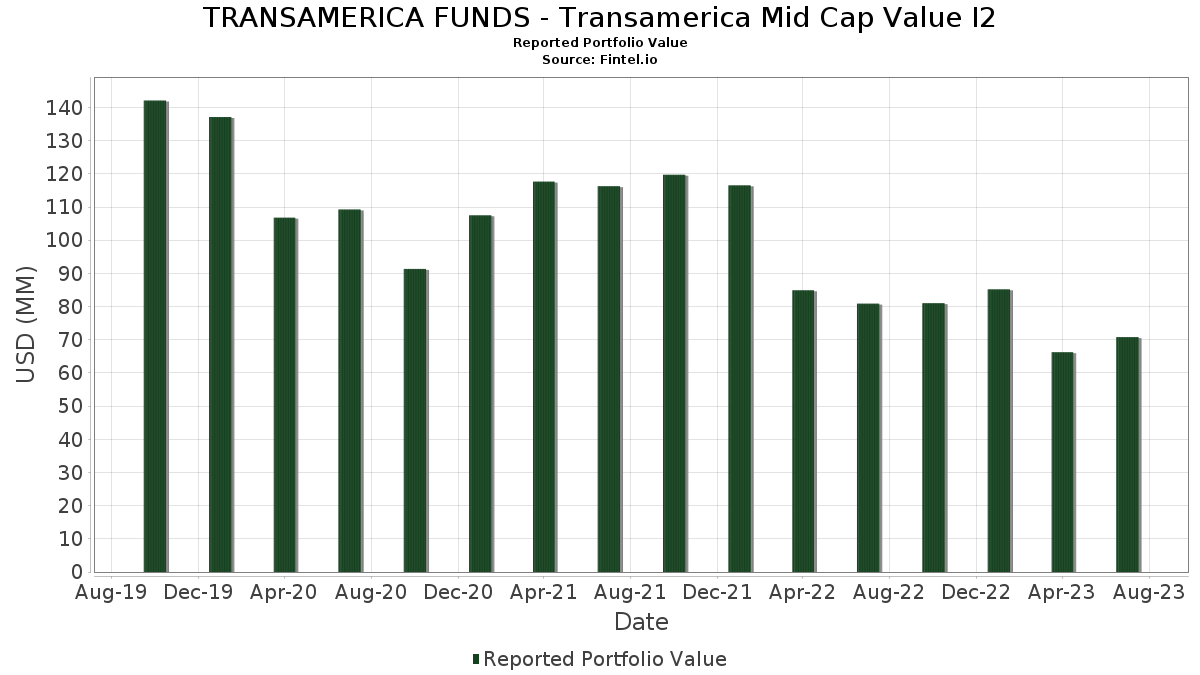
| Porteføljeværdi | $ 70.789.733 |
| Nuværende stillinger | 105 |
Seneste beholdninger, ydeevne, AUM (fra 13F, 13D)
TRANSAMERICA FUNDS - Transamerica Mid Cap Value I2 har afsløret 105 samlede besiddelser i deres seneste SEC-arkivering. Den seneste porteføljeværdi er beregnet til at være $ 70.789.733 USD. Faktiske aktiver under forvaltning (AUM) er denne værdi plus kontanter (som ikke er oplyst). TRANSAMERICA FUNDS - Transamerica Mid Cap Value I2s største beholdninger er Ameriprise Financial, Inc. (US:AMP) , Loews Corporation (US:L) , M&T Bank Corporation (US:MTB) , CMS Energy Corporation (US:CMS) , and WEC Energy Group, Inc. (US:WEC) . TRANSAMERICA FUNDS - Transamerica Mid Cap Value I2s nye stillinger omfatter PG&E Corporation (US:PCG) , Microchip Technology Incorporated (US:MCHP) , Zebra Technologies Corporation (US:ZBRA) , .
Top øger dette kvartal
Vi bruger ændringen i porteføljeallokeringen, fordi dette er den mest meningsfulde metrik. Ændringer kan skyldes handler eller ændringer i aktiekurser.
| Sikkerhed | Aktier (MM) |
Værdi (MM$) |
Portefølje % | ΔPortefølje % |
|---|---|---|---|---|
| 0,05 | 0,82 | 1,1626 | 1,1626 | |
| 0,00 | 0,40 | 0,5730 | 0,5730 | |
| 0,00 | 0,73 | 1,0321 | 0,4151 | |
| 0,00 | 0,25 | 0,3611 | 0,3611 | |
| 0,01 | 0,83 | 1,1752 | 0,2832 | |
| 0,05 | 1,11 | 1,5690 | 0,2802 | |
| 0,00 | 1,07 | 1,5181 | 0,2578 | |
| 0,01 | 0,67 | 0,9460 | 0,2349 | |
| 0,01 | 0,87 | 1,2350 | 0,2343 | |
| 0,00 | 0,61 | 0,8593 | 0,2310 |
Top falder i dette kvartal
Vi bruger ændringen i porteføljeallokeringen, fordi dette er den mest meningsfulde metrik. Ændringer kan skyldes handler eller ændringer i aktiekurser.
| Sikkerhed | Aktier (MM) |
Værdi (MM$) |
Portefølje % | ΔPortefølje % |
|---|---|---|---|---|
| 0,00 | 0,49 | 0,6885 | -0,6847 | |
| 0,02 | 1,02 | 1,4514 | -0,5309 | |
| 0,00 | 0,74 | 1,0438 | -0,4234 | |
| 0,00 | 0,41 | 0,5781 | -0,3679 | |
| 0,00 | 0,23 | 0,3222 | -0,3557 | |
| 0,01 | 1,05 | 1,4928 | -0,3138 | |
| 0,01 | 0,78 | 1,0976 | -0,3016 | |
| 0,00 | 0,57 | 0,8107 | -0,1881 | |
| 0,03 | 0,38 | 0,5335 | -0,1876 | |
| 0,01 | 1,11 | 1,5699 | -0,1447 |
13F og Fondsarkivering
Denne formular blev indsendt den 2023-09-27 for rapporteringsperioden 2023-07-31. Klik på linkikonet for at se den fulde transaktionshistorik.
Opgrader for at låse op for premium-data og eksportere til Excel ![]() .
.
| Sikkerhed | Type | Gennemsnitlig aktiekurs | Aktier (MM) |
Δ Aktier (%) |
Δ Aktier (%) |
Værdi ($MM) |
Portefølje (%) |
ΔPortefølje (%) |
|
|---|---|---|---|---|---|---|---|---|---|
| FIXED INC CLEARING CORP.REPO / RA (000000000) | 1,96 | -51,12 | 2,7770 | -0,1013 | |||||
| AMP / Ameriprise Financial, Inc. | 0,00 | 4,42 | 1,47 | 19,29 | 2,0849 | 0,2216 | |||
| L / Loews Corporation | 0,02 | 4,44 | 1,23 | 13,73 | 1,7476 | 0,1088 | |||
| MTB / M&T Bank Corporation | 0,01 | 4,44 | 1,22 | 16,13 | 1,7343 | 0,1424 | |||
| CMS / CMS Energy Corporation | 0,02 | 4,44 | 1,14 | 2,43 | 1,6114 | -0,0650 | |||
| WEC / WEC Energy Group, Inc. | 0,01 | 4,44 | 1,11 | -2,38 | 1,5699 | -0,1447 | |||
| RF / Regions Financial Corporation | 0,05 | 16,31 | 1,11 | 29,78 | 1,5690 | 0,2802 | |||
| MLM / Martin Marietta Materials, Inc. | 0,00 | 4,44 | 1,07 | 28,42 | 1,5181 | 0,2578 | |||
| SNA / Snap-on Incorporated | 0,00 | 4,46 | 1,07 | 9,67 | 1,5101 | 0,0430 | |||
| HUBB / Hubbell Incorporated | 0,00 | 4,43 | 1,06 | 20,89 | 1,5010 | 0,1786 | |||
| COR / Cencora, Inc. | 0,01 | -21,38 | 1,05 | -11,87 | 1,4928 | -0,3138 | |||
| HSIC / Henry Schein, Inc. | 0,01 | 4,43 | 1,04 | 1,87 | 1,4662 | -0,0684 | |||
| XEL / Xcel Energy Inc. | 0,02 | -13,04 | 1,02 | -22,01 | 1,4514 | -0,5309 | |||
| WMB / The Williams Companies, Inc. | 0,03 | 3,43 | 1,00 | 17,72 | 1,4214 | 0,1348 | |||
| ACGL / Arch Capital Group Ltd. | 0,01 | 4,43 | 1,00 | 8,12 | 1,4154 | 0,0196 | |||
| HBAN / Huntington Bancshares Incorporated | 0,08 | -5,81 | 0,98 | 2,94 | 1,3914 | -0,0492 | |||
| RJF / Raymond James Financial, Inc. | 0,01 | 4,44 | 0,98 | 26,98 | 1,3870 | 0,2228 | |||
| AME / AMETEK, Inc. | 0,01 | 4,44 | 0,97 | 20,10 | 1,3798 | 0,1552 | |||
| LECO / Lincoln Electric Holdings, Inc. | 0,00 | 3,59 | 0,97 | 24,01 | 1,3684 | 0,1914 | |||
| LKQ / LKQ Corporation | 0,02 | 4,43 | 0,94 | -0,95 | 1,3255 | -0,0998 | |||
| ITT / ITT Inc. | 0,01 | 3,57 | 0,92 | 22,33 | 1,2959 | 0,1654 | |||
| FBHS / Fortune Brands Home & Security Inc | 0,01 | 4,43 | 0,88 | 14,68 | 1,2400 | 0,0881 | |||
| CDW / CDW Corporation | 0,00 | -4,03 | 0,87 | 5,82 | 1,2375 | -0,0083 | |||
| RPM / RPM International Inc. | 0,01 | 4,44 | 0,87 | 31,72 | 1,2350 | 0,2343 | |||
| MIDD / The Middleby Corporation | 0,01 | 3,18 | 0,86 | 11,28 | 1,2155 | 0,0506 | |||
| FITB / Fifth Third Bancorp | 0,03 | 4,44 | 0,84 | 15,98 | 1,1931 | 0,0969 | |||
| IAC / IAC Inc. | 0,01 | 4,44 | 0,83 | 40,27 | 1,1752 | 0,2832 | |||
| PCG / PG&E Corporation | 0,05 | 0,82 | 1,1626 | 1,1626 | |||||
| STT / State Street Corporation | 0,01 | 4,43 | 0,82 | 4,73 | 1,1622 | -0,0209 | |||
| PKG / Packaging Corporation of America | 0,01 | 4,43 | 0,80 | 18,40 | 1,1308 | 0,1129 | |||
| TDY / Teledyne Technologies Incorporated | 0,00 | 29,46 | 0,78 | 20,18 | 1,1055 | 0,1247 | |||
| FCNCA / First Citizens BancShares, Inc. | 0,00 | -18,05 | 0,78 | 16,59 | 1,1047 | 0,0938 | |||
| HIG / The Hartford Insurance Group, Inc. | 0,01 | 3,36 | 0,78 | 4,72 | 1,0997 | -0,0202 | |||
| ZBH / Zimmer Biomet Holdings, Inc. | 0,01 | -16,22 | 0,78 | -16,31 | 1,0976 | -0,3016 | |||
| RL / Ralph Lauren Corporation | 0,01 | 4,44 | 0,77 | 19,50 | 1,0860 | 0,1173 | |||
| TPR / Tapestry, Inc. | 0,02 | 4,44 | 0,76 | 10,45 | 1,0783 | 0,0376 | |||
| APH / Amphenol Corporation | 0,01 | -11,55 | 0,75 | 3,46 | 1,0588 | -0,0316 | |||
| AZO / AutoZone, Inc. | 0,00 | -18,63 | 0,74 | -24,18 | 1,0438 | -0,4234 | |||
| FANG / Diamondback Energy, Inc. | 0,00 | 72,07 | 0,73 | 78,43 | 1,0321 | 0,4151 | |||
| WY / Weyerhaeuser Company | 0,02 | 4,44 | 0,72 | 18,91 | 1,0242 | 0,1064 | |||
| CFG / Citizens Financial Group, Inc. | 0,02 | 4,44 | 0,72 | 8,95 | 1,0171 | 0,0217 | |||
| CSL / Carlisle Companies Incorporated | 0,00 | 4,42 | 0,71 | 34,02 | 1,0105 | 0,2074 | |||
| DOV / Dover Corporation | 0,00 | 3,14 | 0,71 | 3,05 | 1,0043 | -0,0348 | |||
| USFD / US Foods Holding Corp. | 0,02 | 4,44 | 0,70 | 16,28 | 0,9920 | 0,0823 | |||
| TKR / The Timken Company | 0,01 | 4,44 | 0,69 | 26,24 | 0,9751 | 0,1516 | |||
| LSXMK / Liberty Media Corp. (New Liberty SiriusXM) Series C | 0,02 | 4,44 | 0,69 | 19,06 | 0,9739 | 0,1015 | |||
| IEX / IDEX Corporation | 0,00 | 4,44 | 0,67 | 14,36 | 0,9482 | 0,0641 | |||
| JBL / Jabil Inc. | 0,01 | 0,12 | 0,67 | 41,83 | 0,9460 | 0,2349 | |||
| CBRE / CBRE Group, Inc. | 0,01 | 4,44 | 0,66 | 13,57 | 0,9362 | 0,0571 | |||
| COG / Cabot Oil & Gas Corp. | 0,02 | 24,30 | 0,66 | 33,94 | 0,9336 | 0,1895 | |||
| AMH / American Homes 4 Rent | 0,02 | 4,44 | 0,66 | 17,74 | 0,9313 | 0,0879 | |||
| RYN / Rayonier Inc. | 0,02 | 4,44 | 0,66 | 10,42 | 0,9305 | 0,0314 | |||
| SLGN / Silgan Holdings Inc. | 0,01 | 4,44 | 0,65 | -6,93 | 0,9136 | -0,1338 | |||
| STZ / Constellation Brands, Inc. | 0,00 | 4,44 | 0,62 | 24,19 | 0,8731 | 0,1236 | |||
| AYI / Acuity Inc. | 0,00 | 4,44 | 0,61 | 9,53 | 0,8637 | 0,0243 | |||
| EXPE / Expedia Group, Inc. | 0,00 | 11,78 | 0,61 | 45,67 | 0,8593 | 0,2310 | |||
| DRI / Darden Restaurants, Inc. | 0,00 | 4,43 | 0,60 | 16,25 | 0,8512 | 0,0699 | |||
| KDP / Keurig Dr Pepper Inc. | 0,02 | 28,45 | 0,60 | 33,63 | 0,8510 | 0,1721 | |||
| JAZZ / Jazz Pharmaceuticals plc | 0,00 | 4,46 | 0,59 | -2,96 | 0,8356 | -0,0827 | |||
| MTG / MGIC Investment Corporation | 0,03 | 4,44 | 0,58 | 17,61 | 0,8242 | 0,0771 | |||
| AVB / AvalonBay Communities, Inc. | 0,00 | 4,45 | 0,58 | 9,23 | 0,8218 | 0,0200 | |||
| CRI / Carter's, Inc. | 0,01 | 4,45 | 0,58 | 12,23 | 0,8198 | 0,0418 | |||
| EIX / Edison International | 0,01 | 4,44 | 0,58 | 2,13 | 0,8147 | -0,0356 | |||
| LH / Labcorp Holdings Inc. | 0,00 | -8,32 | 0,57 | -13,46 | 0,8107 | -0,1881 | |||
| WRB / W. R. Berkley Corporation | 0,01 | 4,44 | 0,57 | 9,46 | 0,8031 | 0,0204 | |||
| TROW / T. Rowe Price Group, Inc. | 0,00 | 4,46 | 0,56 | 14,75 | 0,7932 | 0,0557 | |||
| DGX / Quest Diagnostics Incorporated | 0,00 | 4,43 | 0,56 | 1,83 | 0,7862 | -0,0376 | |||
| GDDY / GoDaddy Inc. | 0,01 | -4,38 | 0,54 | -2,53 | 0,7648 | -0,0721 | |||
| VOYA / Voya Financial, Inc. | 0,01 | 4,44 | 0,54 | 1,32 | 0,7615 | -0,0388 | |||
| KR / The Kroger Co. | 0,01 | 4,45 | 0,52 | 4,39 | 0,7417 | -0,0149 | |||
| KIM / Kimco Realty Corporation | 0,03 | 4,45 | 0,52 | 10,26 | 0,7314 | 0,0245 | |||
| GPC / Genuine Parts Company | 0,00 | 4,45 | 0,52 | -3,38 | 0,7306 | -0,0752 | |||
| TTWO / Take-Two Interactive Software, Inc. | 0,00 | 6,33 | 0,50 | 30,81 | 0,7100 | 0,1316 | |||
| DFS / Discover Financial Services | 0,00 | -7,58 | 0,50 | -5,67 | 0,7073 | -0,0923 | |||
| MSI / Motorola Solutions, Inc. | 0,00 | -45,68 | 0,49 | -46,53 | 0,6885 | -0,6847 | |||
| NTRS / Northern Trust Corporation | 0,01 | 4,44 | 0,48 | 7,10 | 0,6852 | 0,0031 | |||
| MHK / Mohawk Industries, Inc. | 0,00 | 4,45 | 0,47 | 4,92 | 0,6643 | -0,0107 | |||
| NFG / National Fuel Gas Company | 0,01 | 4,45 | 0,47 | -0,64 | 0,6619 | -0,0490 | |||
| GL / Globe Life Inc. | 0,00 | 32,85 | 0,45 | 37,08 | 0,6399 | 0,1432 | |||
| WPC / W. P. Carey Inc. | 0,01 | 4,46 | 0,45 | -4,87 | 0,6367 | -0,0771 | |||
| BBWI / Bath & Body Works, Inc. | 0,01 | 2,35 | 0,45 | 7,95 | 0,6358 | 0,0087 | |||
| BRX / Brixmor Property Group Inc. | 0,02 | 4,45 | 0,44 | 11,28 | 0,6301 | 0,0270 | |||
| BXP / Boston Properties, Inc. | 0,01 | 19,53 | 0,44 | 49,32 | 0,6267 | 0,1792 | |||
| POST / Post Holdings, Inc. | 0,01 | 4,44 | 0,44 | -1,58 | 0,6169 | -0,0509 | |||
| BLL / Ball Corp. | 0,01 | 4,44 | 0,43 | 15,28 | 0,6100 | 0,0460 | |||
| FLT / Corpay, Inc. | 0,00 | -44,03 | 0,41 | -34,82 | 0,5781 | -0,3679 | |||
| BBY / Best Buy Co., Inc. | 0,00 | 4,45 | 0,41 | 16,38 | 0,5746 | 0,0485 | |||
| MCHP / Microchip Technology Incorporated | 0,00 | 0,40 | 0,5730 | 0,5730 | |||||
| ENR / Energizer Holdings, Inc. | 0,01 | 4,45 | 0,39 | 11,71 | 0,5540 | 0,0247 | |||
| REG / Regency Centers Corporation | 0,01 | 15,54 | 0,39 | 23,49 | 0,5513 | 0,0746 | |||
| NWL / Newell Brands Inc. | 0,03 | -14,16 | 0,38 | -21,17 | 0,5335 | -0,1876 | |||
| GMED / Globus Medical, Inc. | 0,01 | 4,45 | 0,37 | 8,24 | 0,5225 | 0,0082 | |||
| HCC / Warrior Met Coal, Inc. | 0,00 | 4,44 | 0,36 | 1,43 | 0,5040 | -0,0246 | |||
| UHS / Universal Health Services, Inc. | 0,00 | -10,57 | 0,35 | -17,46 | 0,4896 | -0,1417 | |||
| ESS / Essex Property Trust, Inc. | 0,00 | 4,42 | 0,33 | 15,63 | 0,4722 | 0,0374 | |||
| FRT / Federal Realty Investment Trust | 0,00 | 4,43 | 0,32 | 7,09 | 0,4503 | 0,0027 | |||
| LUV / Southwest Airlines Co. | 0,01 | 4,45 | 0,32 | 17,84 | 0,4493 | 0,0428 | |||
| REXR / Rexford Industrial Realty, Inc. | 0,01 | 4,45 | 0,30 | 3,05 | 0,4318 | -0,0142 | |||
| VTR / Ventas, Inc. | 0,01 | 4,45 | 0,30 | 5,24 | 0,4274 | -0,0045 | |||
| FCX / Freeport-McMoRan Inc. | 0,01 | -12,16 | 0,29 | 3,52 | 0,4165 | -0,0126 | |||
| HST / Host Hotels & Resorts, Inc. | 0,02 | 4,46 | 0,29 | 18,85 | 0,4112 | 0,0425 | |||
| SUI / Sun Communities, Inc. | 0,00 | 4,44 | 0,28 | -2,07 | 0,4036 | -0,0355 | |||
| CE / Celanese Corporation | 0,00 | -24,85 | 0,26 | -11,46 | 0,3624 | -0,0731 | |||
| ZBRA / Zebra Technologies Corporation | 0,00 | 0,25 | 0,3611 | 0,3611 | |||||
| RNR / RenaissanceRe Holdings Ltd. | 0,00 | -41,58 | 0,23 | -49,44 | 0,3222 | -0,3557 |