Grundlæggende statistik
| Porteføljeværdi | $ 4.350.693 |
| Nuværende stillinger | 53 |
Seneste beholdninger, ydeevne, AUM (fra 13F, 13D)
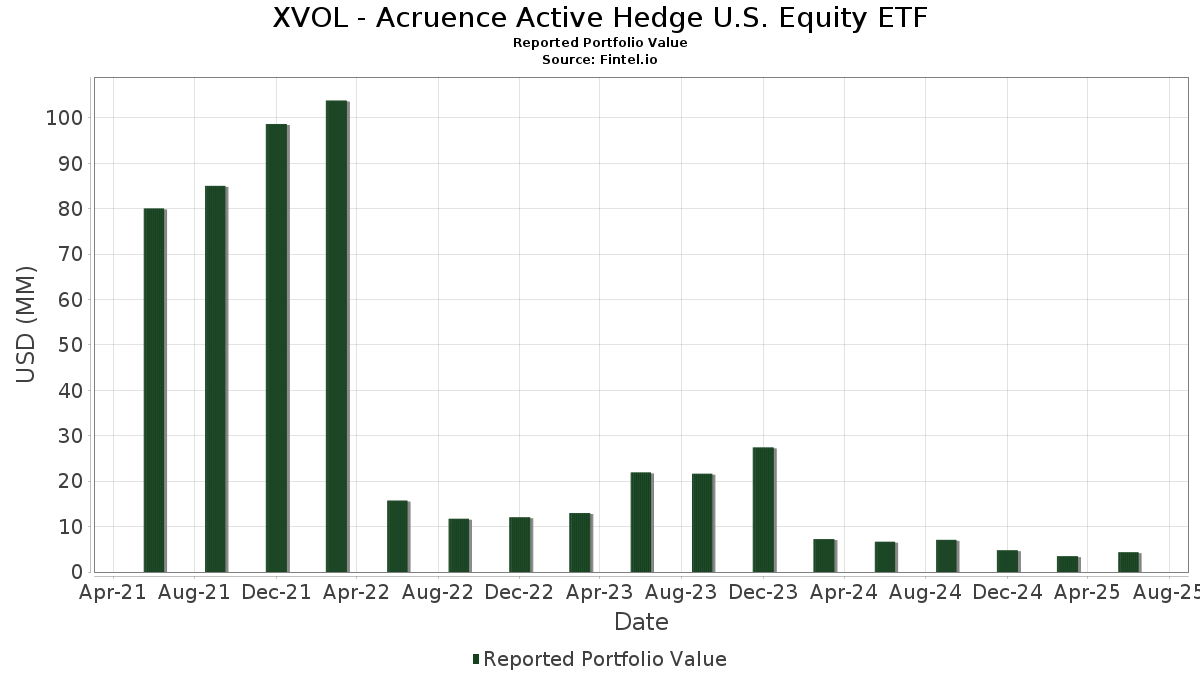
XVOL - Acruence Active Hedge U.S. Equity ETF har afsløret 53 samlede besiddelser i deres seneste SEC-arkivering. Den seneste porteføljeværdi er beregnet til at være $ 4.350.693 USD. Faktiske aktiver under forvaltning (AUM) er denne værdi plus kontanter (som ikke er oplyst). XVOL - Acruence Active Hedge U.S. Equity ETFs største beholdninger er Brookfield BRP Holdings (Canada) Inc. - Corporate Bond/Note (US:BEPI) , Entergy Corporation (US:ETR) , Universal Corporation (US:UVV) , Pinnacle West Capital Corporation (US:PNW) , and U.S. Bancorp (US:USB) . XVOL - Acruence Active Hedge U.S. Equity ETFs nye stillinger omfatter Brookfield BRP Holdings (Canada) Inc. - Corporate Bond/Note (US:BEPI) , CareTrust REIT, Inc. (US:CTRE) , TKO Group Holdings, Inc. (US:TKO) , Prosperity Bancshares, Inc. (US:PB) , and Roblox Corporation (US:RBLX) .
Top øger dette kvartal
Vi bruger ændringen i porteføljeallokeringen, fordi dette er den mest meningsfulde metrik. Ændringer kan skyldes handler eller ændringer i aktiekurser.
| Sikkerhed | Aktier (MM) |
Værdi (MM$) |
Portefølje % | ΔPortefølje % |
|---|---|---|---|---|
| 0,01 | 0,16 | 3,5330 | 3,5330 | |
| 0,00 | 0,15 | 3,3925 | 3,3925 | |
| 0,01 | 0,11 | 2,4422 | 2,4422 | |
| 0,00 | 0,10 | 2,3740 | 2,3740 | |
| 0,00 | 0,10 | 2,2630 | 2,2630 | |
| 0,00 | 0,09 | 2,0922 | 2,0922 | |
| 0,00 | 0,09 | 2,0031 | 2,0031 | |
| 0,00 | 0,08 | 1,9279 | 1,9279 | |
| 0,00 | 0,08 | 1,8650 | 1,8650 | |
| 0,00 | 0,08 | 1,8622 | 1,8622 |
Top falder i dette kvartal
Vi bruger ændringen i porteføljeallokeringen, fordi dette er den mest meningsfulde metrik. Ændringer kan skyldes handler eller ændringer i aktiekurser.
| Sikkerhed | Aktier (MM) |
Værdi (MM$) |
Portefølje % | ΔPortefølje % |
|---|---|---|---|---|
| 0,00 | 0,08 | 1,9304 | -2,2274 | |
| 0,00 | 0,00 | -2,0792 | ||
| 0,00 | 0,00 | -1,7482 | ||
| 0,00 | 0,00 | -1,6785 | ||
| 0,00 | 0,00 | -1,5932 | ||
| 0,00 | 0,00 | -1,5533 | ||
| 0,00 | 0,00 | -1,5293 | ||
| 0,00 | 0,00 | -1,4506 | ||
| 0,00 | 0,06 | 1,4664 | -0,4354 | |
| 0,01 | 0,01 | 0,2301 | -0,3412 |
13F og Fondsarkivering
Denne formular blev indsendt den 2025-08-26 for rapporteringsperioden 2025-06-30. Klik på linkikonet for at se den fulde transaktionshistorik.
Opgrader for at låse op for premium-data og eksportere til Excel ![]() .
.
| Sikkerhed | Type | Gennemsnitlig aktiekurs | Aktier (MM) |
Δ Aktier (%) |
Δ Aktier (%) |
Værdi ($MM) |
Portefølje (%) |
ΔPortefølje (%) |
|
|---|---|---|---|---|---|---|---|---|---|
| BEPI / Brookfield BRP Holdings (Canada) Inc. - Corporate Bond/Note | 0,01 | 0,16 | 3,5330 | 3,5330 | |||||
| ETR / Entergy Corporation | 0,00 | 0,15 | 3,3925 | 3,3925 | |||||
| UVV / Universal Corporation | 0,00 | 51,16 | 0,13 | 58,33 | 3,0325 | 0,6059 | |||
| PNW / Pinnacle West Capital Corporation | 0,00 | 122,61 | 0,13 | 110,00 | 2,8847 | 1,1508 | |||
| USB / U.S. Bancorp | 0,00 | 58,81 | 0,12 | 71,83 | 2,7811 | 0,7276 | |||
| SFNC / Simmons First National Corporation | 0,01 | 0,11 | 2,4422 | 2,4422 | |||||
| CME / CME Group Inc. | 0,00 | 12,76 | 0,10 | 16,85 | 2,3814 | -0,1734 | |||
| UBSI / United Bankshares, Inc. | 0,00 | 0,10 | 2,3740 | 2,3740 | |||||
| SR / Spire Inc. | 0,00 | 96,26 | 0,10 | 83,33 | 2,2670 | 0,7107 | |||
| HOOD / Robinhood Markets, Inc. | 0,00 | 0,10 | 2,2630 | 2,2630 | |||||
| MO / Altria Group, Inc. | 0,00 | 12,07 | 0,09 | 9,41 | 2,1290 | -0,3151 | |||
| CTRE / CareTrust REIT, Inc. | 0,00 | 0,09 | 2,0922 | 2,0922 | |||||
| AFRM / Affirm Holdings, Inc. | 0,00 | 5,00 | 0,09 | 60,71 | 2,0484 | 0,4458 | |||
| TSCO / Tractor Supply Company | 0,00 | 43,99 | 0,09 | 37,50 | 2,0110 | 0,1782 | |||
| TGT / Target Corporation | 0,00 | 0,09 | 2,0031 | 2,0031 | |||||
| NXST / Nexstar Media Group, Inc. | 0,00 | 33,69 | 0,09 | 29,85 | 1,9820 | 0,0512 | |||
| TPR / Tapestry, Inc. | 0,00 | 7,71 | 0,09 | 34,92 | 1,9527 | 0,1257 | |||
| NET / Cloudflare, Inc. | 0,00 | -21,44 | 0,09 | 37,10 | 1,9414 | 0,1541 | |||
| AVGO / Broadcom Inc. | 0,00 | -64,56 | 0,08 | -42,07 | 1,9304 | -2,2274 | |||
| TKO / TKO Group Holdings, Inc. | 0,00 | 0,08 | 1,9279 | 1,9279 | |||||
| NFLX / Netflix, Inc. | 0,00 | -3,08 | 0,08 | 40,00 | 1,9183 | 0,1861 | |||
| VST / Vistra Corp. | 0,00 | -34,98 | 0,08 | -8,70 | 1,9169 | -0,0056 | |||
| NWN / Northwest Natural Holding Company | 0,00 | 0,08 | 1,8650 | 1,8650 | |||||
| PB / Prosperity Bancshares, Inc. | 0,00 | 0,08 | 1,8622 | 1,8622 | |||||
| MSTR / Strategy Inc | 0,00 | 0,08 | 1,8566 | 1,8566 | |||||
| RBLX / Roblox Corporation | 0,00 | 0,08 | 1,8538 | 1,8538 | |||||
| TTWO / Take-Two Interactive Software, Inc. | 0,00 | 0,08 | 1,8277 | 1,8277 | |||||
| USFD / US Foods Holding Corp. | 0,00 | 0,08 | 1,7843 | 1,7843 | |||||
| CW / Curtiss-Wright Corporation | 0,00 | 0,08 | 1,7774 | 1,7774 | |||||
| ORCL / Oracle Corporation | 0,00 | -8,46 | 0,08 | 21,88 | 1,7747 | 0,4200 | |||
| CHWY / Chewy, Inc. | 0,00 | -7,40 | 0,08 | 20,31 | 1,7695 | -0,0625 | |||
| EQT / EQT Corporation | 0,00 | 0,08 | 1,7477 | 1,7477 | |||||
| KMI / Kinder Morgan, Inc. | 0,00 | 0,08 | 1,7468 | 1,7468 | |||||
| PLTR / Palantir Technologies Inc. | 0,00 | -24,87 | 0,08 | 20,63 | 1,7420 | -0,0621 | |||
| STAG / STAG Industrial, Inc. | 0,00 | 0,08 | 1,7290 | 1,7290 | |||||
| CASY / Casey's General Stores, Inc. | 0,00 | 0,08 | 1,7287 | 1,7287 | |||||
| TSLA / Tesla, Inc. | 0,00 | 0,08 | 1,7118 | 1,7118 | |||||
| FAST / Fastenal Company | 0,00 | -37,58 | 0,08 | -55,62 | 1,7085 | 0,9032 | |||
| PM / Philip Morris International Inc. | 0,00 | -2,14 | 0,07 | 12,12 | 1,7020 | -0,2031 | |||
| NWE / NorthWestern Energy Group, Inc. | 0,00 | 0,07 | 1,7007 | 1,7007 | |||||
| VZ / Verizon Communications Inc. | 0,00 | 0,07 | 1,6735 | 1,6735 | |||||
| UHT / Universal Health Realty Income Trust | 0,00 | 9,95 | 0,07 | 7,35 | 1,6677 | -0,2859 | |||
| NTRA / Natera, Inc. | 0,00 | -26,90 | 0,07 | -22,58 | 1,6594 | -0,2906 | |||
| DRI / Darden Restaurants, Inc. | 0,00 | -83,51 | 0,07 | -78,74 | 1,6355 | 0,0430 | |||
| BKNG / Booking Holdings Inc. | 0,00 | 9,09 | 0,07 | 38,00 | 1,5796 | 0,1315 | |||
| VEEV / Veeva Systems Inc. | 0,00 | 0,07 | 1,5453 | 1,5453 | |||||
| ASB / Associated Banc-Corp | 0,00 | 0,07 | 1,4829 | 1,4829 | |||||
| KLAC / KLA Corporation | 0,00 | -53,25 | 0,06 | -49,21 | 1,4664 | -0,4354 | |||
| COR / Cencora, Inc. | 0,00 | 0,06 | 1,4045 | 1,4045 | |||||
| ACM / AECOM | 0,00 | 0,06 | 1,3960 | 1,3960 | |||||
| VIX US 07/16/25 C30 / DE (N/A) | 0,01 | 0,2385 | 0,2385 | ||||||
| FGXXX / First American Funds Inc - First American Government Obligations Fund Class X | 0,01 | -49,39 | 0,01 | -47,37 | 0,2301 | -0,3412 | |||
| CVNA / Carvana Co. | 0,00 | -100,00 | 0,00 | -100,00 | -2,0792 | ||||
| TRN / Trinity Industries, Inc. | 0,00 | -100,00 | 0,00 | -100,00 | -1,4506 | ||||
| LPLA / LPL Financial Holdings Inc. | 0,00 | -100,00 | 0,00 | -100,00 | -1,7482 | ||||
| WES / Western Midstream Partners, LP - Limited Partnership | 0,00 | -100,00 | 0,00 | -100,00 | -1,5533 | ||||
| FIBK / First Interstate BancSystem, Inc. | 0,00 | -100,00 | 0,00 | -100,00 | -1,5932 | ||||
| POR / Portland General Electric Company | 0,00 | -100,00 | 0,00 | -100,00 | -1,6785 | ||||
| XEL / Xcel Energy Inc. | 0,00 | -100,00 | 0,00 | -100,00 | -1,5293 | ||||
| VIX US 07/16/25 C45 / DE (N/A) | -0,01 | -0,1476 | -0,1476 |