Grundlæggende statistik
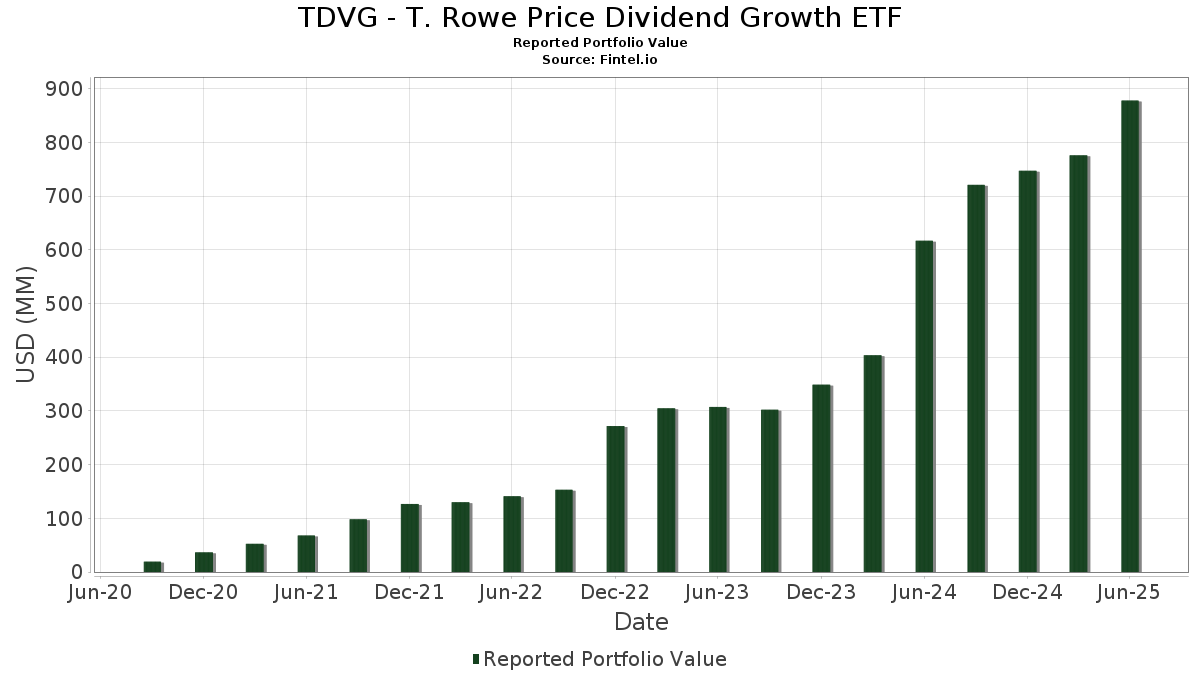
| Porteføljeværdi | $ 877.907.962 |
| Nuværende stillinger | 95 |
Seneste beholdninger, ydeevne, AUM (fra 13F, 13D)
TDVG - T. Rowe Price Dividend Growth ETF har afsløret 95 samlede besiddelser i deres seneste SEC-arkivering. Den seneste porteføljeværdi er beregnet til at være $ 877.907.962 USD. Faktiske aktiver under forvaltning (AUM) er denne værdi plus kontanter (som ikke er oplyst). TDVG - T. Rowe Price Dividend Growth ETFs største beholdninger er Microsoft Corporation (US:MSFT) , Apple Inc. (US:AAPL) , JPMorgan Chase & Co. (US:JPM) , Visa Inc. (US:V) , and Broadcom Inc. (US:AVGO) . TDVG - T. Rowe Price Dividend Growth ETFs nye stillinger omfatter Gilead Sciences, Inc. (US:GILD) , .
Top øger dette kvartal
Vi bruger ændringen i porteføljeallokeringen, fordi dette er den mest meningsfulde metrik. Ændringer kan skyldes handler eller ændringer i aktiekurser.
| Sikkerhed | Aktier (MM) |
Værdi (MM$) |
Portefølje % | ΔPortefølje % |
|---|---|---|---|---|
| 0,12 | 59,29 | 6,7504 | 1,6104 | |
| 0,08 | 21,60 | 2,4593 | 1,4834 | |
| 13,72 | 13,72 | 1,5617 | 0,7336 | |
| 0,04 | 4,91 | 0,5585 | 0,5585 | |
| 0,13 | 12,77 | 1,4539 | 0,3971 | |
| 0,09 | 26,48 | 3,0141 | 0,3386 | |
| 0,01 | 11,67 | 1,3289 | 0,3072 | |
| 0,08 | 20,70 | 2,3563 | 0,2766 | |
| 0,01 | 5,62 | 0,6395 | 0,2427 | |
| 0,08 | 11,62 | 1,3226 | 0,2016 |
Top falder i dette kvartal
Vi bruger ændringen i porteføljeallokeringen, fordi dette er den mest meningsfulde metrik. Ændringer kan skyldes handler eller ændringer i aktiekurser.
| Sikkerhed | Aktier (MM) |
Værdi (MM$) |
Portefølje % | ΔPortefølje % |
|---|---|---|---|---|
| 0,17 | 35,48 | 4,0391 | -0,8659 | |
| 0,02 | 7,33 | 0,8340 | -0,7831 | |
| 0,03 | 4,57 | 0,5199 | -0,5735 | |
| 0,02 | 8,30 | 0,9449 | -0,5266 | |
| 0,07 | 14,44 | 1,6439 | -0,2990 | |
| 0,06 | 16,62 | 1,8918 | -0,2700 | |
| 0,14 | 4,71 | 0,5357 | -0,2112 | |
| 0,02 | 13,48 | 1,5350 | -0,2085 | |
| 0,01 | 1,65 | 0,1884 | -0,2082 | |
| 0,42 | 8,83 | 1,0048 | -0,2021 |
13F og Fondsarkivering
Denne formular blev indsendt den 2025-08-26 for rapporteringsperioden 2025-06-30. Klik på linkikonet for at se den fulde transaktionshistorik.
Opgrader for at låse op for premium-data og eksportere til Excel ![]() .
.
| Sikkerhed | Type | Gennemsnitlig aktiekurs | Aktier (MM) |
Δ Aktier (%) |
Δ Aktier (%) |
Værdi ($MM) |
Portefølje (%) |
ΔPortefølje (%) |
|
|---|---|---|---|---|---|---|---|---|---|
| MSFT / Microsoft Corporation | 0,12 | 12,14 | 59,29 | 48,59 | 6,7504 | 1,6104 | |||
| AAPL / Apple Inc. | 0,17 | 0,87 | 35,48 | -6,83 | 4,0391 | -0,8659 | |||
| JPM / JPMorgan Chase & Co. | 0,09 | 7,85 | 26,48 | 27,46 | 3,0141 | 0,3386 | |||
| V / Visa Inc. | 0,07 | 9,70 | 25,51 | 11,14 | 2,9040 | -0,0524 | |||
| AVGO / Broadcom Inc. | 0,08 | 73,18 | 21,60 | 185,12 | 2,4593 | 1,4834 | |||
| GE / General Electric Company | 0,08 | -0,32 | 20,70 | 28,19 | 2,3563 | 0,2766 | |||
| CB / Chubb Limited | 0,06 | 3,21 | 16,62 | -0,98 | 1,8918 | -0,2700 | |||
| WMT / Walmart Inc. | 0,15 | 5,87 | 14,85 | 17,92 | 1,6910 | 0,0685 | |||
| MMC / Marsh & McLennan Companies, Inc. | 0,07 | 6,85 | 14,44 | -4,27 | 1,6439 | -0,2990 | |||
| BAC / Bank of America Corporation | 0,30 | 10,20 | 14,32 | 24,96 | 1,6306 | 0,1542 | |||
| GVMXX / State Street Institutional Investment Trust - State Street Institutional US Govt Money Market Fnd Premier Cls | 13,72 | 113,37 | 13,72 | 113,39 | 1,5617 | 0,7336 | |||
| LLY / Eli Lilly and Company | 0,02 | 5,54 | 13,48 | -0,39 | 1,5350 | -0,2085 | |||
| AXP / American Express Company | 0,04 | 6,59 | 12,99 | 26,38 | 1,4793 | 0,1549 | |||
| APH / Amphenol Corporation | 0,13 | 3,39 | 12,77 | 55,66 | 1,4539 | 0,3971 | |||
| SCHW / The Charles Schwab Corporation | 0,14 | 11,27 | 12,55 | 29,69 | 1,4293 | 0,1823 | |||
| HWM / Howmet Aerospace Inc. | 0,07 | -8,62 | 12,31 | 31,11 | 1,4015 | 0,1920 | |||
| LIN / Linde plc | 0,03 | 7,55 | 12,11 | 8,37 | 1,3787 | -0,0607 | |||
| ROP / Roper Technologies, Inc. | 0,02 | 5,61 | 11,85 | 1,53 | 1,3486 | -0,1541 | |||
| KLAC / KLA Corporation | 0,01 | 11,68 | 11,67 | 47,17 | 1,3289 | 0,3072 | |||
| HD / The Home Depot, Inc. | 0,03 | 10,64 | 11,67 | 10,69 | 1,3289 | -0,0295 | |||
| MS / Morgan Stanley | 0,08 | 10,56 | 11,62 | 33,48 | 1,3226 | 0,2016 | |||
| KO / The Coca-Cola Company | 0,16 | 7,82 | 11,29 | 6,52 | 1,2857 | -0,0800 | |||
| MCK / McKesson Corporation | 0,02 | -4,30 | 11,29 | 4,20 | 1,2853 | -0,1102 | |||
| XOM / Exxon Mobil Corporation | 0,10 | 7,87 | 11,23 | -2,23 | 1,2785 | -0,2009 | |||
| HLT / Hilton Worldwide Holdings Inc. | 0,04 | 9,79 | 11,11 | 28,51 | 1,2650 | 0,1512 | |||
| BR / Broadridge Financial Solutions, Inc. | 0,04 | 7,76 | 10,58 | 8,00 | 1,2043 | -0,0572 | |||
| ACN / Accenture plc | 0,03 | 8,90 | 10,43 | 4,31 | 1,1872 | -0,1005 | |||
| ADI / Analog Devices, Inc. | 0,04 | 13,02 | 10,40 | 33,40 | 1,1841 | 0,1797 | |||
| PM / Philip Morris International Inc. | 0,06 | 7,58 | 10,27 | 23,44 | 1,1690 | 0,0976 | |||
| PGR / The Progressive Corporation | 0,04 | 5,84 | 10,24 | -0,19 | 1,1658 | -0,1558 | |||
| SYK / Stryker Corporation | 0,03 | 6,64 | 10,24 | 13,34 | 1,1653 | 0,0021 | |||
| HON / Honeywell International Inc. | 0,04 | 5,24 | 9,87 | 15,74 | 1,1233 | 0,0252 | |||
| ROST / Ross Stores, Inc. | 0,08 | 8,72 | 9,68 | 8,54 | 1,1024 | -0,0467 | |||
| AEE / Ameren Corporation | 0,10 | 7,46 | 9,55 | 2,80 | 1,0873 | -0,1095 | |||
| WCN / Waste Connections, Inc. | 0,05 | 4,17 | 9,38 | -0,35 | 1,0678 | -0,1445 | |||
| DE / Deere & Company | 0,02 | 10,30 | 9,38 | 19,50 | 1,0676 | 0,0568 | |||
| TMUS / T-Mobile US, Inc. | 0,04 | 10,93 | 9,36 | -0,90 | 1,0656 | -0,1510 | |||
| CL / Colgate-Palmolive Company | 0,10 | 7,88 | 9,09 | 4,65 | 1,0348 | -0,0839 | |||
| NOC / Northrop Grumman Corporation | 0,02 | 7,20 | 9,00 | 4,68 | 1,0241 | -0,0828 | |||
| ABBV / AbbVie Inc. | 0,05 | 7,73 | 8,94 | -4,56 | 1,0180 | -0,1888 | |||
| MCD / McDonald's Corporation | 0,03 | 6,46 | 8,87 | -0,42 | 1,0102 | -0,1376 | |||
| KVUE / Kenvue Inc. | 0,42 | 7,92 | 8,83 | -5,81 | 1,0048 | -0,2021 | |||
| UNP / Union Pacific Corporation | 0,04 | 10,26 | 8,70 | 7,39 | 0,9909 | -0,0531 | |||
| EQR / Equity Residential | 0,13 | 8,10 | 8,70 | 1,93 | 0,9906 | -0,1090 | |||
| AZN / AstraZeneca PLC - Depositary Receipt (Common Stock) | 0,12 | 0,21 | 8,46 | -4,73 | 0,9630 | -0,1806 | |||
| SHW / The Sherwin-Williams Company | 0,02 | 14,97 | 8,33 | 13,05 | 0,9479 | -0,0007 | |||
| TMO / Thermo Fisher Scientific Inc. | 0,02 | -10,84 | 8,30 | -27,35 | 0,9449 | -0,5266 | |||
| MDLZ / Mondelez International, Inc. | 0,12 | 11,30 | 7,89 | 10,62 | 0,8978 | -0,0204 | |||
| AMT / American Tower Corporation | 0,04 | 8,08 | 7,88 | 9,78 | 0,8968 | -0,0275 | |||
| COP / ConocoPhillips | 0,09 | 27,78 | 7,78 | 9,19 | 0,8859 | -0,0321 | |||
| DHR / Danaher Corporation | 0,04 | 7,63 | 7,57 | 3,71 | 0,8618 | -0,0783 | |||
| UNH / UnitedHealth Group Incorporated | 0,02 | -2,04 | 7,33 | -41,65 | 0,8340 | -0,7831 | |||
| WFC / Wells Fargo & Company | 0,09 | 8,41 | 7,12 | 20,98 | 0,8108 | 0,0526 | |||
| TT / Trane Technologies plc | 0,02 | 3,32 | 6,91 | 34,15 | 0,7872 | 0,1232 | |||
| TXN / Texas Instruments Incorporated | 0,03 | 15,37 | 6,74 | 33,31 | 0,7677 | 0,1161 | |||
| DGX / Quest Diagnostics Incorporated | 0,04 | 7,84 | 6,72 | 14,49 | 0,7647 | 0,0090 | |||
| ATO / Atmos Energy Corporation | 0,04 | 7,74 | 6,48 | 7,41 | 0,7375 | -0,0393 | |||
| CMS / CMS Energy Corporation | 0,09 | 2,25 | 6,40 | -5,68 | 0,7282 | -0,1453 | |||
| SPGI / S&P Global Inc. | 0,01 | 23,19 | 6,31 | 27,84 | 0,7183 | 0,0826 | |||
| AMAT / Applied Materials, Inc. | 0,03 | 2,43 | 6,20 | 29,21 | 0,7060 | 0,0879 | |||
| HIG / The Hartford Insurance Group, Inc. | 0,05 | 3,95 | 6,09 | 6,58 | 0,6930 | -0,0426 | |||
| ADP / Automatic Data Processing, Inc. | 0,02 | 8,24 | 5,90 | 9,26 | 0,6716 | -0,0239 | |||
| TEL / TE Connectivity plc | 0,03 | 7,44 | 5,89 | 28,23 | 0,6703 | 0,0789 | |||
| GS / The Goldman Sachs Group, Inc. | 0,01 | 5,19 | 5,79 | 36,27 | 0,6593 | 0,1120 | |||
| TSM / Taiwan Semiconductor Manufacturing Company Limited - Depositary Receipt (Common Stock) | 0,03 | 19,35 | 5,67 | 62,87 | 0,6453 | 0,1970 | |||
| NEE / NextEra Energy, Inc. | 0,08 | -2,82 | 5,65 | -4,84 | 0,6427 | -0,1214 | |||
| INTU / Intuit Inc. | 0,01 | 42,16 | 5,62 | 82,37 | 0,6395 | 0,2427 | |||
| ROK / Rockwell Automation, Inc. | 0,02 | 7,70 | 5,61 | 38,47 | 0,6390 | 0,1168 | |||
| CSX / CSX Corporation | 0,16 | 7,93 | 5,26 | 19,66 | 0,5987 | 0,0326 | |||
| ODFL / Old Dominion Freight Line, Inc. | 0,03 | 5,99 | 5,21 | 3,97 | 0,5934 | -0,0523 | |||
| EOG / EOG Resources, Inc. | 0,04 | 7,76 | 5,11 | 0,51 | 0,5813 | -0,0731 | |||
| ELV / Elevance Health, Inc. | 0,01 | -6,59 | 4,93 | -16,46 | 0,5611 | -0,1989 | |||
| COST / Costco Wholesale Corporation | 0,00 | 6,47 | 4,92 | 11,44 | 0,5604 | -0,0086 | |||
| GILD / Gilead Sciences, Inc. | 0,04 | 4,91 | 0,5585 | 0,5585 | |||||
| AVY / Avery Dennison Corporation | 0,03 | 1,90 | 4,83 | 0,46 | 0,5501 | -0,0694 | |||
| YUM / Yum! Brands, Inc. | 0,03 | 8,03 | 4,82 | 1,73 | 0,5484 | -0,0615 | |||
| GEV / GE Vernova Inc. | 0,01 | -13,19 | 4,80 | 50,49 | 0,5460 | 0,1355 | |||
| WMB / The Williams Companies, Inc. | 0,08 | 2,37 | 4,79 | 7,59 | 0,5452 | -0,0281 | |||
| SLB / Schlumberger Limited | 0,14 | 0,36 | 4,71 | -18,85 | 0,5357 | -0,2112 | |||
| EQT / EQT Corporation | 0,08 | -16,50 | 4,62 | -8,87 | 0,5255 | -0,1268 | |||
| BDX / Becton, Dickinson and Company | 0,03 | -28,46 | 4,57 | -46,21 | 0,5199 | -0,5735 | |||
| QCOM / QUALCOMM Incorporated | 0,03 | 7,68 | 4,30 | 11,64 | 0,4893 | -0,0066 | |||
| CI / The Cigna Group | 0,01 | 8,98 | 3,63 | 9,52 | 0,4138 | -0,0137 | |||
| GEHC / GE HealthCare Technologies Inc. | 0,05 | -6,21 | 3,63 | -13,92 | 0,4134 | -0,1300 | |||
| TSCO / Tractor Supply Company | 0,07 | 8,24 | 3,52 | 3,65 | 0,4009 | -0,0367 | |||
| NKE / NIKE, Inc. | 0,05 | 8,38 | 3,33 | 21,31 | 0,3791 | 0,0255 | |||
| AON / Aon plc | 0,01 | -1,18 | 2,88 | -11,63 | 0,3278 | -0,0920 | |||
| ITW / Illinois Tool Works Inc. | 0,01 | 8,64 | 2,82 | 8,31 | 0,3205 | -0,0143 | |||
| OTIS / Otis Worldwide Corporation | 0,03 | -7,18 | 2,62 | -10,95 | 0,2981 | -0,0806 | |||
| RPM / RPM International Inc. | 0,02 | 8,12 | 2,57 | 2,68 | 0,2926 | -0,0299 | |||
| SWK / Stanley Black & Decker, Inc. | 0,04 | -6,40 | 2,50 | -17,51 | 0,2848 | -0,1059 | |||
| MAR / Marriott International, Inc. | 0,01 | 7,09 | 2,49 | 22,81 | 0,2839 | 0,0224 | |||
| MET / MetLife, Inc. | 0,03 | 7,63 | 2,46 | 7,80 | 0,2801 | -0,0139 | |||
| ZTS / Zoetis Inc. | 0,01 | -43,26 | 1,65 | -46,26 | 0,1884 | -0,2082 | |||
| BAH / Booz Allen Hamilton Holding Corporation | 0,01 | 12,81 | 0,97 | 12,27 | 0,1105 | -0,0008 |