Grundlæggende statistik
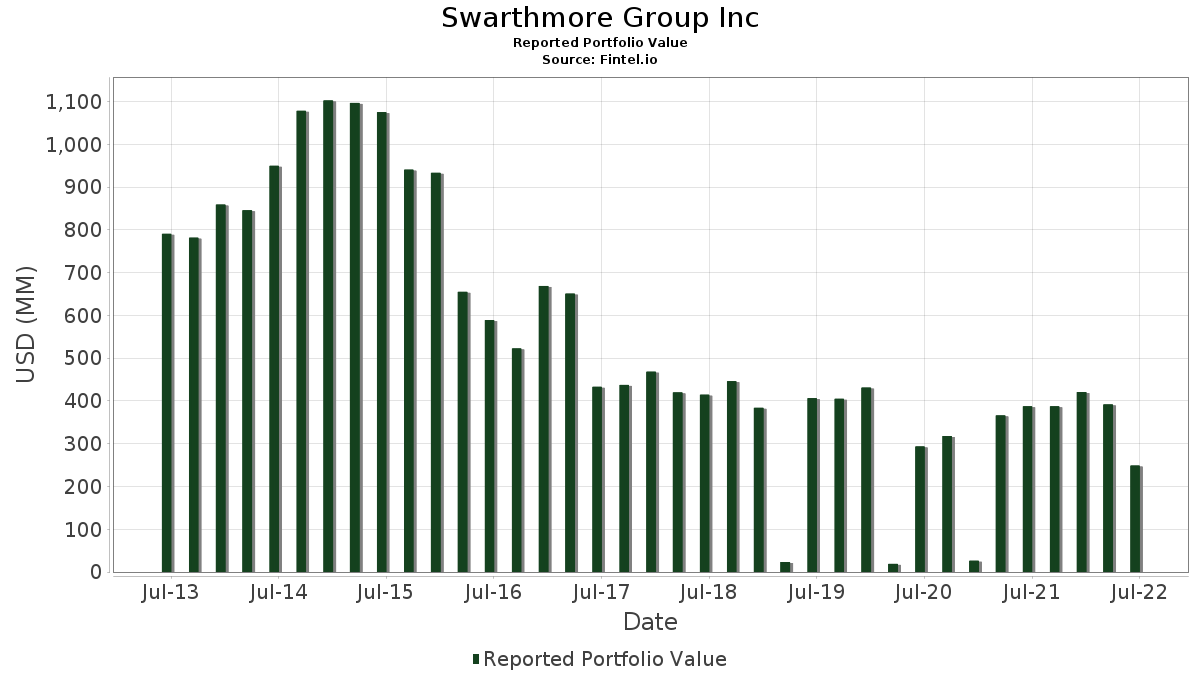
| Porteføljeværdi | $ 248.672.000 |
| Nuværende stillinger | 46 |
Seneste beholdninger, ydeevne, AUM (fra 13F, 13D)
Swarthmore Group Inc har afsløret 46 samlede besiddelser i deres seneste SEC-arkivering. Den seneste porteføljeværdi er beregnet til at være $ 248.672.000 USD. Faktiske aktiver under forvaltning (AUM) er denne værdi plus kontanter (som ikke er oplyst). Swarthmore Group Incs største beholdninger er iShares Trust - iShares Core S&P 500 ETF (US:IVV) , SPDR S&P 500 ETF (US:SPY) , Apple Inc. (US:AAPL) , Microsoft Corporation (US:MSFT) , and Alphabet Inc. (US:GOOGL) . Swarthmore Group Incs nye stillinger omfatter SPDR S&P 500 ETF (US:SPY) , .
Top øger dette kvartal
Vi bruger ændringen i porteføljeallokeringen, fordi dette er den mest meningsfulde metrik. Ændringer kan skyldes handler eller ændringer i aktiekurser.
| Sikkerhed | Aktier (MM) |
Værdi (MM$) |
Portefølje % | ΔPortefølje % |
|---|---|---|---|---|
| 0,24 | 89,34 | 35,9289 | 35,9289 | |
| 0,37 | 141,65 | 56,9630 | 34,4896 | |
| 0,00 | 0,94 | 0,3768 | 0,1350 | |
| 0,00 | 0,39 | 0,1564 | 0,0964 | |
| 0,00 | 0,29 | 0,1114 | 0,0371 | |
| 0,00 | 0,28 | 0,1126 | 0,0350 |
Top falder i dette kvartal
Vi bruger ændringen i porteføljeallokeringen, fordi dette er den mest meningsfulde metrik. Ændringer kan skyldes handler eller ændringer i aktiekurser.
| Sikkerhed | Aktier (MM) |
Værdi (MM$) |
Portefølje % | ΔPortefølje % |
|---|---|---|---|---|
| 0,00 | 1,23 | 0,4942 | -3,2498 | |
| 0,00 | 1,17 | 0,4689 | -3,1678 | |
| 0,01 | 1,48 | 0,5932 | -3,0063 | |
| 0,00 | 0,44 | 0,1781 | -2,1245 | |
| 0,00 | 0,47 | 0,1910 | -2,1030 | |
| 0,00 | 0,62 | 0,2509 | -2,0385 | |
| 0,00 | 0,33 | 0,1256 | -1,9715 | |
| 0,00 | 0,29 | 0,1110 | -1,7560 | |
| 0,00 | 0,31 | 0,1251 | -1,6970 | |
| 0,00 | 0,35 | 0,1364 | -1,6709 |
13F og Fondsarkivering
Denne formular blev indsendt den 2022-07-20 for rapporteringsperioden 2022-06-30. Klik på linkikonet for at se den fulde transaktionshistorik.
Opgrader for at låse op for premium-data og eksportere til Excel ![]() .
.
| Sikkerhed | Type | Gennemsnitlig aktiekurs | Aktier (MM) |
Δ Aktier (%) |
Δ Aktier (%) |
Værdi ($MM) |
Portefølje (%) |
ΔPortefølje (%) |
|
|---|---|---|---|---|---|---|---|---|---|
| IVV / iShares Trust - iShares Core S&P 500 ETF | 0,37 | 92,61 | 141,65 | 60,96 | 56,9630 | 34,4896 | |||
| SPY / SPDR S&P 500 ETF | 0,24 | 89,34 | 35,9289 | 35,9289 | |||||
| AAPL / Apple Inc. | 0,01 | -86,64 | 1,48 | -89,54 | 0,5932 | -3,0063 | |||
| MSFT / Microsoft Corporation | 0,00 | -89,94 | 1,23 | -91,62 | 0,4942 | -3,2498 | |||
| GOOGL / Alphabet Inc. | 0,00 | -89,55 | 1,17 | -91,81 | 0,4689 | -3,1678 | |||
| HSY / The Hershey Company | 0,00 | -0,39 | 0,94 | -1,06 | 0,3768 | 0,1350 | |||
| ABBV / AbbVie Inc. | 0,00 | -92,63 | 0,62 | -93,04 | 0,2509 | -2,0385 | |||
| AVGO / Broadcom Inc. | 0,00 | -90,24 | 0,51 | -92,47 | 0,1948 | -1,5236 | |||
| PFE / Pfizer Inc. | 0,01 | -92,51 | 0,48 | -92,42 | 0,1934 | -1,4261 | |||
| TMO / Thermo Fisher Scientific Inc. | 0,00 | -94,25 | 0,47 | -94,71 | 0,1910 | -2,1030 | |||
| VZ / Verizon Communications Inc. | 0,01 | -93,63 | 0,45 | -93,66 | 0,1806 | -1,6270 | |||
| QCOM / QUALCOMM Incorporated | 0,00 | -94,12 | 0,44 | -95,09 | 0,1781 | -2,1245 | |||
| PG / The Procter & Gamble Company | 0,00 | -92,55 | 0,40 | -92,99 | 0,1596 | -1,2873 | |||
| AMZN / Amazon.com, Inc. | 0,00 | 4.983,33 | 0,39 | 65,53 | 0,1564 | 0,0964 | |||
| CVX / Chevron Corporation | 0,00 | -92,09 | 0,38 | -92,96 | 0,1536 | -1,2325 | |||
| UPS / United Parcel Service, Inc. | 0,00 | -94,11 | 0,35 | -94,98 | 0,1364 | -1,6709 | |||
| MS / Morgan Stanley | 0,00 | -93,87 | 0,35 | -94,67 | 0,1403 | -1,5326 | |||
| V / Visa Inc. | 0,00 | -94,03 | 0,35 | -94,70 | 0,1329 | -1,5334 | |||
| TSN / Tyson Foods, Inc. | 0,00 | -93,36 | 0,33 | -93,63 | 0,1279 | -1,2069 | |||
| LOW / Lowe's Companies, Inc. | 0,00 | -95,39 | 0,33 | -96,02 | 0,1256 | -1,9715 | |||
| CAT / Caterpillar Inc. | 0,00 | -93,39 | 0,32 | -94,70 | 0,1283 | -1,4075 | |||
| PXD / Pioneer Natural Resources Company | 0,00 | -93,82 | 0,31 | -94,49 | 0,1263 | -1,3301 | |||
| ANTM / Anthem Inc | 0,00 | -95,57 | 0,31 | -95,64 | 0,1251 | -1,6970 | |||
| LHX / L3Harris Technologies, Inc. | 0,00 | -92,59 | 0,31 | -92,80 | 0,1231 | -0,9620 | |||
| AMJ / JPMorgan Alerian MLP Index ETN - Corporate Bond/Note | 0,00 | -94,14 | 0,30 | -95,15 | 0,1168 | -1,4839 | |||
| KLAC / KLA Corporation | 0,00 | -93,64 | 0,30 | -94,46 | 0,1145 | -1,2581 | |||
| CBOE / Cboe Global Markets, Inc. | 0,00 | -94,85 | 0,30 | -94,91 | 0,1194 | -1,3696 | |||
| MCD / McDonald's Corporation | 0,00 | 0,00 | 0,29 | -0,34 | 0,1114 | 0,0371 | |||
| ORLY / O'Reilly Automotive, Inc. | 0,00 | -95,72 | 0,29 | -96,05 | 0,1110 | -1,7560 | |||
| CSCO / Cisco Systems, Inc. | 0,01 | -94,10 | 0,29 | -95,49 | 0,1158 | -1,5150 | |||
| ABT / Abbott Laboratories | 0,00 | -94,14 | 0,28 | -94,63 | 0,1126 | -1,2192 | |||
| NVDA / NVIDIA Corporation | 0,00 | 65,98 | 0,28 | -7,89 | 0,1126 | 0,0350 | |||
| RF / Regions Financial Corporation | 0,01 | -93,43 | 0,28 | -94,48 | 0,1122 | -1,1777 | |||
| ORCL / Oracle Corporation | 0,00 | -94,23 | 0,27 | -95,12 | 0,1082 | -1,2982 | |||
| SSNC / SS&C Technologies Holdings, Inc. | 0,00 | -94,55 | 0,26 | -95,78 | 0,1046 | -1,4670 | |||
| CVS / CVS Health Corporation | 0,00 | -92,87 | 0,26 | -93,48 | 0,1038 | -0,9062 | |||
| RHI / Robert Half Inc. | 0,00 | -92,88 | 0,26 | -95,32 | 0,1038 | -1,3054 | |||
| NKE / NIKE, Inc. | 0,00 | -94,07 | 0,26 | -95,49 | 0,1038 | -1,3567 | |||
| UNP / Union Pacific Corporation | 0,00 | -94,69 | 0,26 | -95,85 | 0,1025 | -1,4682 | |||
| NTAP / NetApp, Inc. | 0,00 | -93,85 | 0,24 | -95,18 | 0,0985 | -1,1982 | |||
| NEE.PRN / NextEra Energy Capital Holdings, Inc. - Corporate Bond/Note | 0,00 | -93,28 | 0,23 | -93,84 | 0,0895 | -0,8771 | |||
| INTU / Intuit Inc. | 0,00 | -92,82 | 0,23 | -94,24 | 0,0933 | -0,9348 | |||
| EXR / Extra Space Storage Inc. | 0,00 | -94,03 | 0,23 | -95,05 | 0,0933 | -1,1036 | |||
| KR / The Kroger Co. | 0,00 | -94,14 | 0,23 | -95,16 | 0,0929 | -1,1247 | |||
| ZION / Zions Bancorporation, National Association | 0,00 | -93,97 | 0,22 | -95,33 | 0,0873 | -1,0982 | |||
| IPG / The Interpublic Group of Companies, Inc. | 0,01 | -94,00 | 0,21 | -95,33 | 0,0840 | -1,0592 | |||
| META / Meta Platforms, Inc. | 0,00 | -100,00 | 0,00 | -100,00 | -0,0695 | ||||
| LRCX / Lam Research Corporation | 0,00 | -100,00 | 0,00 | -100,00 | -0,8938 | ||||
| RSG / Republic Services, Inc. | 0,00 | -100,00 | 0,00 | -100,00 | -0,9559 | ||||
| HCC / Warrior Met Coal, Inc. | 0,00 | -100,00 | 0,00 | -100,00 | -1,0470 | ||||
| MMC / Marsh & McLennan Companies, Inc. | 0,00 | -100,00 | 0,00 | -100,00 | -0,8389 | ||||
| CE / Celanese Corporation | 0,00 | -100,00 | 0,00 | -100,00 | -0,9661 | ||||
| NLOK / NortonLifeLock Inc | 0,00 | -100,00 | 0,00 | -100,00 | -0,7526 | ||||
| IRM / Iron Mountain Incorporated | 0,00 | -100,00 | 0,00 | -100,00 | -0,8443 | ||||
| MOS / The Mosaic Company | 0,00 | -100,00 | 0,00 | -100,00 | -1,0008 | ||||
| GM / General Motors Company | 0,00 | -100,00 | 0,00 | -100,00 | -0,7255 | ||||
| WFC / Wells Fargo & Company | 0,00 | -100,00 | 0,00 | -100,00 | -0,2209 | ||||
| GAFFX / Growth Fund Of America - Growth Fund of America - Class F-3 | 0,00 | -100,00 | 0,00 | -100,00 | -0,6915 | ||||
| DHI / D.R. Horton, Inc. | 0,00 | -100,00 | 0,00 | -100,00 | -0,6989 |