Grundlæggende statistik
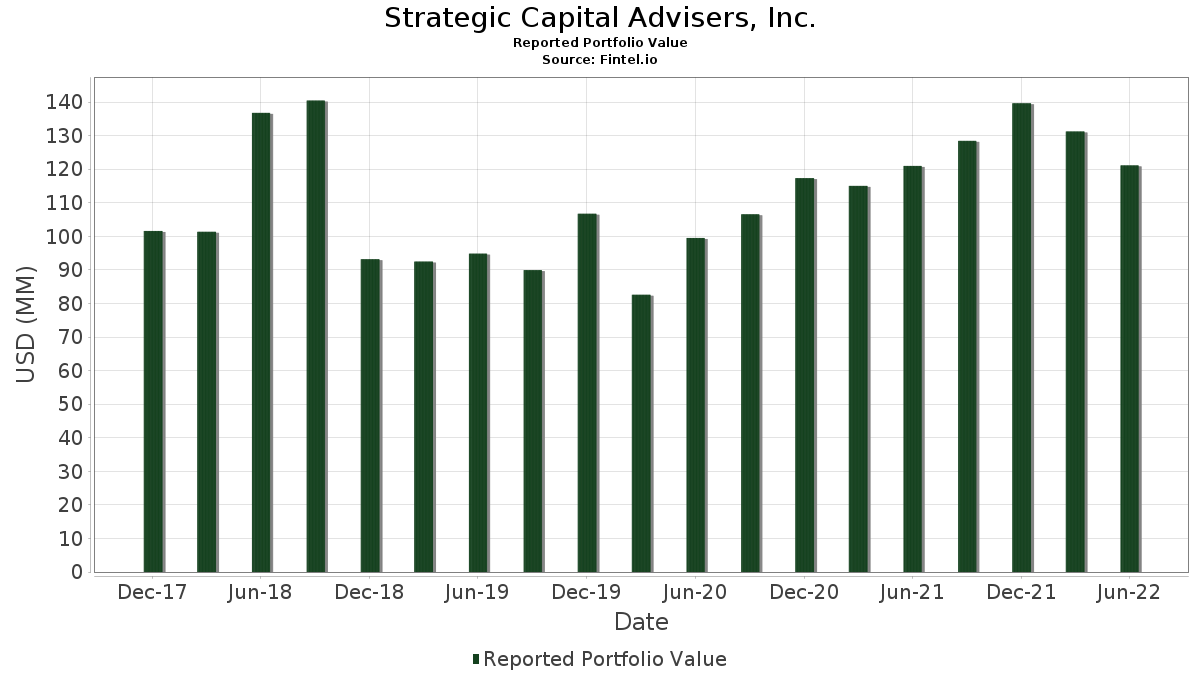
| Porteføljeværdi | $ 121.113.000 |
| Nuværende stillinger | 59 |
Seneste beholdninger, ydeevne, AUM (fra 13F, 13D)
Strategic Capital Advisers, Inc. har afsløret 59 samlede besiddelser i deres seneste SEC-arkivering. Den seneste porteføljeværdi er beregnet til at være $ 121.113.000 USD. Faktiske aktiver under forvaltning (AUM) er denne værdi plus kontanter (som ikke er oplyst). Strategic Capital Advisers, Inc.s største beholdninger er VanEck ETF Trust - VanEck Agribusiness ETF (US:MOO) , Schwab Strategic Trust - Schwab U.S. Broad Market ETF (US:SCHB) , iShares Gold Trust (US:IAU) , Eli Lilly and Company (US:LLY) , and Vanguard Index Funds - Vanguard Total Stock Market ETF (US:VTI) .
Top øger dette kvartal
Vi bruger ændringen i porteføljeallokeringen, fordi dette er den mest meningsfulde metrik. Ændringer kan skyldes handler eller ændringer i aktiekurser.
| Sikkerhed | Aktier (MM) |
Værdi (MM$) |
Portefølje % | ΔPortefølje % |
|---|---|---|---|---|
| 0,03 | 1,05 | 0,8661 | 0,8661 | |
| 0,17 | 5,81 | 4,7939 | 0,7455 | |
| 0,01 | 4,61 | 3,8055 | 0,7373 | |
| 0,04 | 2,20 | 1,8165 | 0,6146 | |
| 0,03 | 2,96 | 2,4473 | 0,6007 | |
| 0,05 | 2,60 | 2,1459 | 0,5447 | |
| 0,03 | 2,08 | 1,7166 | 0,5422 | |
| 0,09 | 7,64 | 6,3073 | 0,4314 | |
| 0,01 | 3,12 | 2,5745 | 0,3704 | |
| 0,04 | 2,99 | 2,4712 | 0,3343 |
Top falder i dette kvartal
Vi bruger ændringen i porteføljeallokeringen, fordi dette er den mest meningsfulde metrik. Ændringer kan skyldes handler eller ændringer i aktiekurser.
| Sikkerhed | Aktier (MM) |
Værdi (MM$) |
Portefølje % | ΔPortefølje % |
|---|---|---|---|---|
| 0,00 | 0,00 | -2,0120 | ||
| 0,03 | 3,05 | 2,5208 | -0,5513 | |
| 0,02 | 2,10 | 1,7347 | -0,5386 | |
| 0,01 | 2,47 | 2,0369 | -0,5200 | |
| 0,14 | 6,22 | 5,1332 | -0,4721 | |
| 0,01 | 0,95 | 0,7860 | -0,4150 | |
| 0,01 | 2,40 | 1,9849 | -0,3936 | |
| 0,02 | 3,96 | 3,2697 | -0,3725 | |
| 0,02 | 3,42 | 2,8197 | -0,3675 | |
| 0,07 | 2,77 | 2,2888 | -0,3359 |
13F og Fondsarkivering
Denne formular blev indsendt den 2022-07-18 for rapporteringsperioden 2022-06-30. Klik på linkikonet for at se den fulde transaktionshistorik.
Opgrader for at låse op for premium-data og eksportere til Excel ![]() .
.
| Sikkerhed | Type | Gennemsnitlig aktiekurs | Aktier (MM) |
Δ Aktier (%) |
Δ Aktier (%) |
Værdi ($MM) |
Portefølje (%) |
ΔPortefølje (%) |
|
|---|---|---|---|---|---|---|---|---|---|
| MOO / VanEck ETF Trust - VanEck Agribusiness ETF | 0,09 | 19,78 | 7,64 | -0,92 | 6,3073 | 0,4314 | |||
| SCHB / Schwab Strategic Trust - Schwab U.S. Broad Market ETF | 0,14 | 2,12 | 6,22 | -15,47 | 5,1332 | -0,4721 | |||
| IAU / iShares Gold Trust | 0,17 | 17,32 | 5,81 | 9,30 | 4,7939 | 0,7455 | |||
| LLY / Eli Lilly and Company | 0,01 | 1,10 | 4,61 | 14,48 | 3,8055 | 0,7373 | |||
| VTI / Vanguard Index Funds - Vanguard Total Stock Market ETF | 0,02 | 0,02 | 3,96 | -17,14 | 3,2697 | -0,3725 | |||
| GLD / SPDR Gold Trust | 0,02 | -0,72 | 3,93 | -7,40 | 3,2424 | 0,0103 | |||
| UNH / UnitedHealth Group Incorporated | 0,01 | -0,54 | 3,91 | 0,15 | 3,2267 | 0,2530 | |||
| AAPL / Apple Inc. | 0,02 | 4,27 | 3,42 | -18,34 | 2,8197 | -0,3675 | |||
| WM / Waste Management, Inc. | 0,02 | 2,49 | 3,39 | -1,08 | 2,7982 | 0,1872 | |||
| MSFT / Microsoft Corporation | 0,01 | -0,33 | 3,13 | -16,99 | 2,5827 | -0,2889 | |||
| COST / Costco Wholesale Corporation | 0,01 | 0,57 | 3,12 | -16,30 | 2,5786 | -0,2649 | |||
| AMT / American Tower Corporation | 0,01 | 5,98 | 3,12 | 7,81 | 2,5745 | 0,3704 | |||
| CVX / Chevron Corporation | 0,02 | 1,75 | 3,07 | -9,52 | 2,5340 | -0,0511 | |||
| BX / Blackstone Inc. | 0,03 | 5,40 | 3,05 | -24,26 | 2,5208 | -0,5513 | |||
| XLU / The Select Sector SPDR Trust - The Utilities Select Sector SPDR Fund | 0,04 | 13,30 | 2,99 | 6,74 | 2,4712 | 0,3343 | |||
| MRK / Merck & Co., Inc. | 0,03 | 10,09 | 2,96 | 22,33 | 2,4473 | 0,6007 | |||
| JNJ / Johnson & Johnson | 0,02 | 6,79 | 2,91 | 6,98 | 2,4035 | 0,3298 | |||
| HD / The Home Depot, Inc. | 0,01 | 6,25 | 2,85 | -2,66 | 2,3573 | 0,1220 | |||
| ADM / Archer-Daniels-Midland Company | 0,04 | 8,79 | 2,83 | -6,45 | 2,3358 | 0,0312 | |||
| SCHA / Schwab Strategic Trust - Schwab U.S. Small-Cap ETF | 0,07 | -2,24 | 2,77 | -19,51 | 2,2888 | -0,3359 | |||
| V / Visa Inc. | 0,01 | 12,02 | 2,70 | -0,55 | 2,2310 | 0,1603 | |||
| VZ / Verizon Communications Inc. | 0,05 | 24,19 | 2,60 | 23,70 | 2,1459 | 0,5447 | |||
| AMJ / JPMorgan Alerian MLP Index ETN - Corporate Bond/Note | 0,02 | 24,44 | 2,52 | 2,81 | 2,0840 | 0,2130 | |||
| SYK / Stryker Corporation | 0,01 | -1,18 | 2,47 | -26,47 | 2,0369 | -0,5200 | |||
| ISRG / Intuitive Surgical, Inc. | 0,01 | 15,78 | 2,40 | -22,97 | 1,9849 | -0,3936 | |||
| CAT / Caterpillar Inc. | 0,01 | 14,24 | 2,37 | -8,33 | 1,9527 | -0,0135 | |||
| USB / U.S. Bancorp | 0,05 | 8,30 | 2,36 | -6,21 | 1,9469 | 0,0310 | |||
| NKE / NIKE, Inc. | 0,02 | 8,67 | 2,34 | -17,47 | 1,9346 | -0,2291 | |||
| CNR / Core Natural Resources, Inc. | 0,02 | 6,43 | 2,30 | -10,76 | 1,8974 | -0,0650 | |||
| MET.PRA / MetLife, Inc. - Preferred Stock | 0,04 | 56,12 | 2,20 | 39,51 | 1,8165 | 0,6146 | |||
| AMZN / Amazon.com, Inc. | 0,02 | 2.061,75 | 2,10 | -29,57 | 1,7347 | -0,5386 | |||
| SCHM / Schwab Strategic Trust - Schwab U.S. Mid-Cap ETF | 0,03 | 63,11 | 2,08 | 34,91 | 1,7166 | 0,5422 | |||
| GOOGL / Alphabet Inc. | 0,00 | -0,54 | 2,00 | -22,11 | 1,6489 | -0,3052 | |||
| SCHZ / Schwab Strategic Trust - Schwab U.S. Aggregate Bond ETF | 0,04 | -0,90 | 1,73 | -6,17 | 1,4317 | 0,0233 | |||
| CARR / Carrier Global Corporation | 0,05 | 29,05 | 1,65 | 0,30 | 1,3607 | 0,1086 | |||
| SPGI / S&P Global Inc. | 0,00 | 0,00 | 1,62 | -17,83 | 1,3359 | -0,1647 | |||
| GOOGL / Alphabet Inc. | 0,00 | -0,40 | 1,09 | -21,92 | 0,9000 | -0,1639 | |||
| SCHF / Schwab Strategic Trust - Schwab International Equity ETF | 0,03 | 1,05 | 0,8661 | 0,8661 | |||||
| NVDA / NVIDIA Corporation | 0,01 | 8,71 | 0,95 | -39,59 | 0,7860 | -0,4150 | |||
| PG / The Procter & Gamble Company | 0,01 | 0,00 | 0,85 | -5,94 | 0,7060 | 0,0132 | |||
| TY / Tri-Continental Corporation | 0,02 | 0,43 | 0,59 | -14,82 | 0,4888 | -0,0409 | |||
| ODFL / Old Dominion Freight Line, Inc. | 0,00 | 0,12 | 0,45 | -14,07 | 0,3683 | -0,0273 | |||
| MMM / 3M Company | 0,00 | 0,00 | 0,43 | -13,17 | 0,3592 | -0,0227 | |||
| WIA / Western Asset Inflation-Linked Income Fund | 0,04 | 98,09 | 0,41 | 65,59 | 0,3377 | 0,1495 | |||
| XOM / Exxon Mobil Corporation | 0,00 | 83,92 | 0,39 | 91,26 | 0,3253 | 0,1683 | |||
| RTX / RTX Corporation | 0,00 | 78,48 | 0,36 | 73,33 | 0,3005 | 0,1405 | |||
| SGOL / abrdn Gold ETF Trust - abrdn Physical Gold Shares ETF | 0,02 | 0,00 | 0,33 | -6,86 | 0,2692 | 0,0024 | |||
| CGW / Invesco Exchange-Traded Fund Trust II - Invesco S&P Global Water Index ETF | 0,01 | 0,00 | 0,32 | -15,84 | 0,2675 | -0,0259 | |||
| LNT / Alliant Energy Corporation | 0,01 | 0,00 | 0,30 | -6,15 | 0,2518 | 0,0041 | |||
| SCHG / Schwab Strategic Trust - Schwab U.S. Large-Cap Growth ETF | 0,00 | -8,07 | 0,28 | -28,75 | 0,2353 | -0,0695 | |||
| ABBV / AbbVie Inc. | 0,00 | 0,33 | 0,28 | -5,03 | 0,2337 | 0,0066 | |||
| GNR / SPDR Index Shares Funds - SPDR S&P Global Natural Resources ETF | 0,01 | 10,46 | 0,28 | -8,28 | 0,2287 | -0,0014 | |||
| AEE / Ameren Corporation | 0,00 | 0,00 | 0,27 | -3,61 | 0,2205 | 0,0093 | |||
| VB / Vanguard Index Funds - Vanguard Small-Cap ETF | 0,00 | -4,15 | 0,26 | -20,73 | 0,2147 | -0,0353 | |||
| PFF / iShares Trust - iShares Preferred and Income Securities ETF | 0,01 | 0,05 | 0,25 | -9,61 | 0,2097 | -0,0044 | |||
| SO / The Southern Company | 0,00 | 0,00 | 0,23 | -1,67 | 0,1940 | 0,0119 | |||
| VO / Vanguard Index Funds - Vanguard Mid-Cap ETF | 0,00 | 0,00 | 0,22 | -17,29 | 0,1816 | -0,0211 | |||
| ABT / Abbott Laboratories | 0,00 | 5,05 | 0,21 | -3,64 | 0,1750 | 0,0074 | |||
| JMM / Nuveen Multi-Market Income Fund | 0,03 | 0,41 | 0,16 | -5,42 | 0,1296 | 0,0031 | |||
| SBUX / Starbucks Corporation | 0,00 | -100,00 | 0,00 | -100,00 | -2,0120 |