Grundlæggende statistik
| Porteføljeværdi | $ 255.104.000 |
| Nuværende stillinger | 149 |
Seneste beholdninger, ydeevne, AUM (fra 13F, 13D)
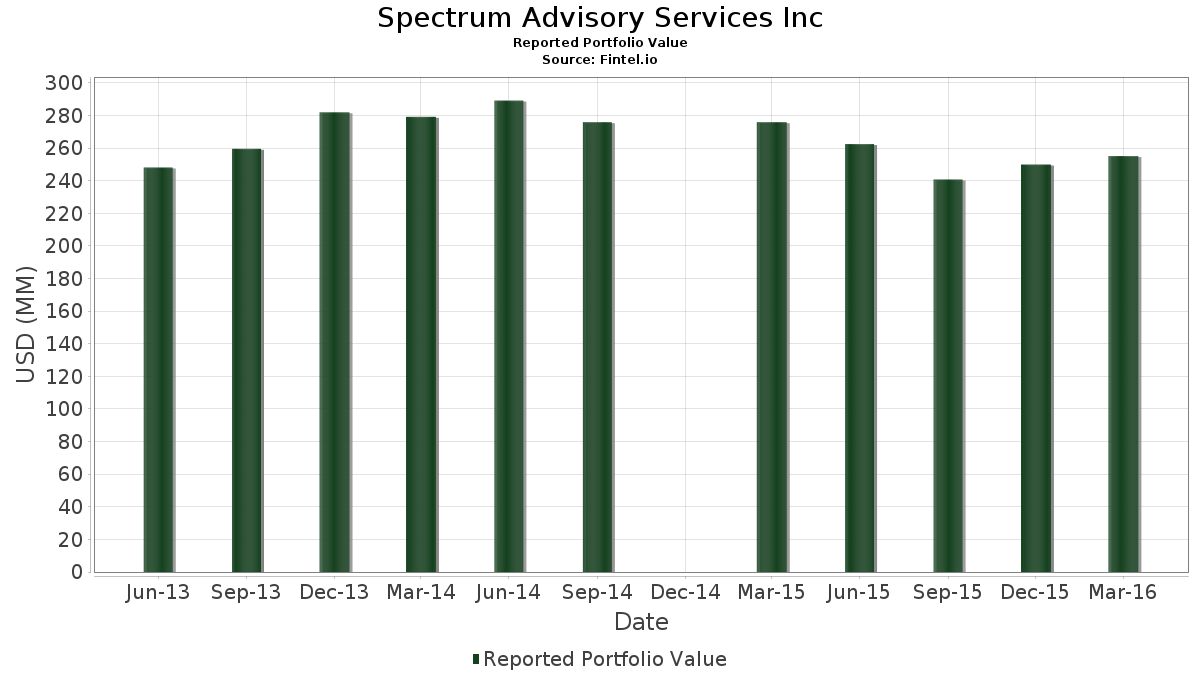
Spectrum Advisory Services Inc har afsløret 149 samlede besiddelser i deres seneste SEC-arkivering. Den seneste porteføljeværdi er beregnet til at være $ 255.104.000 USD. Faktiske aktiver under forvaltning (AUM) er denne værdi plus kontanter (som ikke er oplyst). Spectrum Advisory Services Incs største beholdninger er Valspar Corp. (US:920355104) , 3M Company (US:MMM) , Danaher Corporation (US:DHR) , Graco Inc. (US:GGG) , and Berkshire Hathaway Inc. (US:BRK.B) . Spectrum Advisory Services Incs nye stillinger omfatter Weyerhaeuser Company (US:WY) , DSM-Firmenich AG (US:KDSKF) , SECOM CO., LTD. - Depositary Receipt (Common Stock) (US:SOMLY) , Martin Marietta Materials, Inc. (US:MLM) , and Compass Diversified (US:CODI) .
Top øger dette kvartal
Vi bruger ændringen i porteføljeallokeringen, fordi dette er den mest meningsfulde metrik. Ændringer kan skyldes handler eller ændringer i aktiekurser.
| Sikkerhed | Aktier (MM) |
Værdi (MM$) |
Portefølje % | ΔPortefølje % |
|---|---|---|---|---|
| 0,19 | 5,77 | 2,2614 | 2,2614 | |
| 0,08 | 7,04 | 2,7601 | 0,3272 | |
| 0,05 | 8,28 | 3,2450 | 0,2055 | |
| 0,05 | 5,22 | 2,0474 | 0,1731 | |
| 0,00 | 6,62 | 2,5938 | 0,1402 | |
| 0,03 | 3,06 | 1,1987 | 0,1340 | |
| 0,06 | 3,47 | 1,3606 | 0,1158 | |
| 0,03 | 1,78 | 0,6989 | 0,1111 | |
| 0,12 | 5,41 | 2,1195 | 0,1092 | |
| 0,04 | 1,87 | 0,7346 | 0,1092 |
Top falder i dette kvartal
Vi bruger ændringen i porteføljeallokeringen, fordi dette er den mest meningsfulde metrik. Ændringer kan skyldes handler eller ændringer i aktiekurser.
| Sikkerhed | Aktier (MM) |
Værdi (MM$) |
Portefølje % | ΔPortefølje % |
|---|---|---|---|---|
| 0,00 | 0,00 | -2,2504 | ||
| 0,01 | 2,21 | 0,8683 | -0,1445 | |
| 0,05 | 3,79 | 1,4845 | -0,1313 | |
| 0,07 | 0,67 | 0,2619 | -0,1303 | |
| 0,00 | 0,00 | -0,1260 | ||
| 0,02 | 1,44 | 0,5660 | -0,1234 | |
| 0,01 | 0,54 | 0,2117 | -0,1096 | |
| 0,04 | 0,71 | 0,2795 | -0,1094 | |
| 0,00 | 0,00 | -0,1060 | ||
| 0,03 | 1,19 | 0,4649 | -0,0985 |
13F og Fondsarkivering
Denne formular blev indsendt den 2016-05-12 for rapporteringsperioden 2016-03-31. Klik på linkikonet for at se den fulde transaktionshistorik.
Opgrader for at låse op for premium-data og eksportere til Excel ![]() .
.
| Sikkerhed | Type | Gennemsnitlig aktiekurs | Aktier (MM) |
Δ Aktier (%) |
Δ Aktier (%) |
Værdi ($MM) |
Portefølje (%) |
ΔPortefølje (%) |
|
|---|---|---|---|---|---|---|---|---|---|
| 920355104 / Valspar Corp. | 0,08 | -19,11 | 8,64 | 4,36 | 3,3857 | 0,0741 | |||
| MMM / 3M Company | 0,05 | -1,49 | 8,28 | 8,98 | 3,2450 | 0,2055 | |||
| DHR / Danaher Corporation | 0,08 | -1,02 | 7,34 | 1,09 | 2,8776 | -0,0282 | |||
| GGG / Graco Inc. | 0,08 | -0,59 | 7,04 | 15,81 | 2,7601 | 0,3272 | |||
| BRK.B / Berkshire Hathaway Inc. | 0,05 | -1,53 | 6,68 | 5,83 | 2,6201 | 0,0928 | |||
| BRK.A / Berkshire Hathaway Inc. | 0,00 | 0,00 | 6,62 | 7,91 | 2,5938 | 0,1402 | |||
| WY / Weyerhaeuser Company | 0,19 | 5,77 | 2,2614 | 2,2614 | |||||
| KO / The Coca-Cola Company | 0,12 | -0,34 | 5,41 | 7,62 | 2,1195 | 0,1092 | |||
| IBM / International Business Machines Corporation | 0,04 | -2,60 | 5,38 | 7,17 | 2,1089 | 0,1002 | |||
| PPG / PPG Industries, Inc. | 0,05 | -1,16 | 5,22 | 11,51 | 2,0474 | 0,1731 | |||
| HD / The Home Depot, Inc. | 0,04 | -0,13 | 5,09 | 0,75 | 1,9972 | -0,0263 | |||
| UPS / United Parcel Service, Inc. | 0,04 | -1,30 | 4,64 | 8,20 | 1,8208 | 0,1030 | |||
| LLTC / Linear Technology Corp. | 0,09 | 3,23 | 4,14 | 8,30 | 1,6213 | 0,0932 | |||
| ITW / Illinois Tool Works Inc. | 0,04 | -2,07 | 4,05 | 8,25 | 1,5892 | 0,0906 | |||
| BDX / Becton, Dickinson and Company | 0,03 | -2,04 | 4,00 | -3,50 | 1,5692 | -0,0906 | |||
| Y / Alleghany Corp. | 0,01 | -2,74 | 3,95 | 0,97 | 1,5468 | -0,0169 | |||
| LOW / Lowe's Companies, Inc. | 0,05 | -5,84 | 3,79 | -6,22 | 1,4845 | -0,1313 | |||
| GE / General Electric Company | 0,12 | -5,06 | 3,67 | -3,11 | 1,4398 | -0,0771 | |||
| JNJ / Johnson & Johnson | 0,03 | -1,12 | 3,49 | 4,15 | 1,3673 | 0,0272 | |||
| ETN / Eaton Corporation plc | 0,06 | -7,19 | 3,47 | 11,57 | 1,3606 | 0,1158 | |||
| XOM / Exxon Mobil Corporation | 0,04 | 1,01 | 3,44 | 8,31 | 1,3481 | 0,0776 | |||
| PG / The Procter & Gamble Company | 0,04 | 0,00 | 3,23 | 3,66 | 1,2662 | 0,0193 | |||
| PEP / PepsiCo, Inc. | 0,03 | -0,64 | 3,17 | 1,90 | 1,2430 | -0,0022 | |||
| ZBRA / Zebra Technologies Corporation | 0,04 | -2,92 | 3,10 | -3,82 | 1,2140 | -0,0744 | |||
| AVT / Avnet, Inc. | 0,07 | 0,00 | 3,09 | 3,41 | 1,2117 | 0,0156 | |||
| GPC / Genuine Parts Company | 0,03 | -0,65 | 3,06 | 14,92 | 1,1987 | 0,1340 | |||
| RAVN / Raven Industries, Inc. | 0,19 | -2,64 | 3,05 | 0,00 | 1,1972 | -0,0249 | |||
| AAPL / Apple Inc. | 0,03 | 3,80 | 3,03 | 7,47 | 1,1893 | 0,0597 | |||
| USB / U.S. Bancorp | 0,07 | 0,43 | 2,81 | -4,48 | 1,1031 | -0,0757 | |||
| AX / Axos Financial, Inc. | 0,13 | -4,07 | 2,77 | -2,74 | 1,0862 | -0,0538 | |||
| AON / Aon plc | 0,02 | 0,00 | 2,58 | 13,31 | 1,0110 | 0,1002 | |||
| MCD / McDonald's Corporation | 0,02 | -7,67 | 2,54 | -1,78 | 0,9945 | -0,0391 | |||
| COST / Costco Wholesale Corporation | 0,02 | -2,43 | 2,53 | -4,81 | 0,9933 | -0,0719 | |||
| KDSKF / DSM-Firmenich AG | 0,05 | 2,52 | 0,9863 | 0,0391 | |||||
| GPN / Global Payments Inc. | 0,04 | -6,98 | 2,50 | -5,84 | 0,9800 | -0,0824 | |||
| TEL / TE Connectivity plc | 0,04 | 0,00 | 2,50 | -4,15 | 0,9784 | -0,0635 | |||
| EMR / Emerson Electric Co. | 0,04 | -0,91 | 2,36 | 12,68 | 0,9263 | 0,0872 | |||
| SYK / Stryker Corporation | 0,02 | -3,51 | 2,36 | 11,41 | 0,9263 | 0,0776 | |||
| CL / Colgate-Palmolive Company | 0,03 | -1,19 | 2,35 | 4,81 | 0,9216 | 0,0241 | |||
| EFX / Equifax Inc. | 0,02 | -2,84 | 2,34 | -0,30 | 0,9184 | -0,0219 | |||
| GOOG / Alphabet Inc. | 0,00 | 0,00 | 2,27 | -1,86 | 0,8914 | -0,0357 | |||
| LECO / Lincoln Electric Holdings, Inc. | 0,04 | -2,66 | 2,25 | 9,89 | 0,8840 | 0,0629 | |||
| COKE / Coca-Cola Consolidated, Inc. | 0,01 | 0,00 | 2,21 | -12,49 | 0,8683 | -0,1445 | |||
| EW / Edwards Lifesciences Corporation | 0,02 | 0,00 | 2,14 | 11,68 | 0,8393 | 0,0722 | |||
| BBBY / Bed Bath & Beyond, Inc. | 0,04 | -0,69 | 2,14 | 2,15 | 0,8377 | 0,0006 | |||
| WTM / White Mountains Insurance Group, Ltd. | 0,00 | 0,00 | 2,07 | 10,41 | 0,8106 | 0,0612 | |||
| CSCO / Cisco Systems, Inc. | 0,07 | -1,10 | 2,05 | 3,70 | 0,8028 | 0,0125 | |||
| JCI / Johnson Controls International plc | 0,05 | -1,20 | 1,97 | 13,77 | 0,7707 | 0,0792 | |||
| AAP / Advance Auto Parts, Inc. | 0,01 | -4,91 | 1,94 | 1,31 | 0,7589 | -0,0058 | |||
| BNS / The Bank of Nova Scotia | 0,04 | -0,78 | 1,87 | 19,90 | 0,7346 | 0,1092 | |||
| MSFT / Microsoft Corporation | 0,03 | 1,22 | 1,84 | 0,77 | 0,7205 | -0,0094 | |||
| CPB / The Campbell's Company | 0,03 | 0,00 | 1,78 | 21,38 | 0,6989 | 0,1111 | |||
| AYI / Acuity Inc. | 0,01 | 0,00 | 1,78 | -6,71 | 0,6981 | -0,0657 | |||
| STJ / St. Jude Medical, Inc. | 0,03 | 1,27 | 1,76 | -9,83 | 0,6903 | -0,0912 | |||
| CLC / CLARCOR Inc. | 0,03 | 0,00 | 1,74 | 16,29 | 0,6801 | 0,0831 | |||
| GOOGL / Alphabet Inc. | 0,00 | 0,00 | 1,72 | -1,94 | 0,6731 | -0,0276 | |||
| CAH / Cardinal Health, Inc. | 0,02 | 0,00 | 1,64 | -8,22 | 0,6433 | -0,0722 | |||
| US8865471085 / Tiffany & Co. | 0,02 | 0,00 | 1,60 | -3,85 | 0,6260 | -0,0386 | |||
| TXN / Texas Instruments Incorporated | 0,03 | 0,00 | 1,59 | 4,80 | 0,6245 | 0,0162 | |||
| NBN / Northeast Bank | 0,14 | 0,00 | 1,51 | 1,00 | 0,5919 | -0,0063 | |||
| KMB / Kimberly-Clark Corporation | 0,01 | 0,00 | 1,51 | 5,68 | 0,5903 | 0,0201 | |||
| GSK / GSK plc - Depositary Receipt (Common Stock) | 0,04 | -3,43 | 1,49 | -2,94 | 0,5821 | -0,0301 | |||
| PFE / Pfizer Inc. | 0,05 | -0,25 | 1,46 | -8,42 | 0,5715 | -0,0655 | |||
| NVS / Novartis AG - Depositary Receipt (Common Stock) | 0,02 | -0,50 | 1,44 | -16,19 | 0,5660 | -0,1234 | |||
| INTC / Intel Corporation | 0,04 | 0,00 | 1,44 | -6,05 | 0,5657 | -0,0490 | |||
| EGP / EastGroup Properties, Inc. | 0,02 | 1,06 | 1,44 | 9,67 | 0,5649 | 0,0391 | |||
| BMY / Bristol-Myers Squibb Company | 0,02 | 0,00 | 1,34 | -7,13 | 0,5261 | -0,0521 | |||
| PSX / Phillips 66 | 0,02 | 0,00 | 1,33 | 5,88 | 0,5225 | 0,0188 | |||
| SOMLY / SECOM CO., LTD. - Depositary Receipt (Common Stock) | 0,02 | 1,31 | 0,5143 | 0,0297 | |||||
| GVDNY / Givaudan SA - Depositary Receipt (Common Stock) | 0,00 | 0,00 | 1,27 | 5,75 | 0,4971 | 0,0173 | |||
| ADP / Automatic Data Processing, Inc. | 0,01 | -13,00 | 1,20 | -7,83 | 0,4708 | -0,0506 | |||
| NOC / Northrop Grumman Corporation | 0,01 | 0,00 | 1,19 | 4,74 | 0,4677 | 0,0119 | |||
| STI / Solidion Technology, Inc. | 0,03 | 0,00 | 1,19 | -15,77 | 0,4649 | -0,0985 | |||
| RES / RPC, Inc. | 0,08 | -5,59 | 1,15 | 11,98 | 0,4508 | 0,0399 | |||
| JW.A / John Wiley & Sons Inc. - Class A | 0,02 | -3,72 | 1,14 | 4,50 | 0,4461 | 0,0103 | |||
| SNV / Synovus Financial Corp. | 0,04 | -1,49 | 1,09 | -12,06 | 0,4288 | -0,0689 | |||
| NVO / Novo Nordisk A/S - Depositary Receipt (Common Stock) | 0,02 | 0,00 | 1,08 | -6,71 | 0,4249 | -0,0400 | |||
| WMT / Walmart Inc. | 0,02 | -7,66 | 1,07 | 3,17 | 0,4206 | 0,0045 | |||
| DBRG / DigitalBridge Group, Inc. | 0,06 | -0,40 | 1,03 | -14,25 | 0,4057 | -0,0773 | |||
| EMC / Global X Funds - Global X Emerging Markets Great Consumer ETF | 0,04 | -0,80 | 0,99 | 2,90 | 0,3889 | 0,0031 | |||
| MTB / M&T Bank Corporation | 0,01 | 0,00 | 0,96 | -8,42 | 0,3751 | -0,0430 | |||
| CVX / Chevron Corporation | 0,01 | 2,15 | 0,91 | 8,24 | 0,3551 | 0,0202 | |||
| RDI / Reading International, Inc. | 0,08 | -4,94 | 0,90 | -13,10 | 0,3536 | -0,0618 | |||
| WBA / Walgreens Boots Alliance, Inc. | 0,01 | -5,91 | 0,90 | -6,94 | 0,3520 | -0,0341 | |||
| PII / Polaris Inc. | 0,01 | 4,60 | 0,90 | 19,79 | 0,3512 | 0,0519 | |||
| TSS / Total System Services, Inc. | 0,02 | 0,00 | 0,87 | -4,41 | 0,3403 | -0,0231 | |||
| VRSK / Verisk Analytics, Inc. | 0,01 | 0,00 | 0,85 | 4,02 | 0,3344 | 0,0063 | |||
| DIS / The Walt Disney Company | 0,01 | 0,00 | 0,79 | -5,59 | 0,3112 | -0,0253 | |||
| HSY / The Hershey Company | 0,01 | -4,48 | 0,79 | -1,51 | 0,3077 | -0,0112 | |||
| FCE.A / Forest City Realty Trust, Inc. | 0,04 | -2,43 | 0,76 | -6,16 | 0,2987 | -0,0262 | |||
| COP / ConocoPhillips | 0,02 | 0,56 | 0,72 | -13,17 | 0,2842 | -0,0499 | |||
| SKM / SK Telecom Co., Ltd. - Depositary Receipt (Common Stock) | 0,04 | -26,73 | 0,71 | -26,65 | 0,2795 | -0,1094 | |||
| NWLI / National Western Life Group, Inc. | 0,00 | 0,00 | 0,67 | -8,47 | 0,2626 | -0,0303 | |||
| UEPS / Lesaka Technologies Inc | 0,07 | 0,00 | 0,67 | -31,84 | 0,2619 | -0,1303 | |||
| CTA.PRB / EIDP, Inc. - Preferred Stock | 0,01 | 0,00 | 0,66 | 7,87 | 0,2579 | 0,0138 | |||
| WPM / Wheaton Precious Metals Corp. | 0,04 | 1,31 | 0,64 | 35,44 | 0,2517 | 0,0620 | |||
| BAC / Bank of America Corporation | 0,04 | 0,00 | 0,60 | -19,71 | 0,2364 | -0,0641 | |||
| KEX / Kirby Corporation | 0,01 | 21,38 | 0,58 | 39,23 | 0,2281 | 0,0609 | |||
| JEF / Jefferies Financial Group Inc. | 0,04 | -7,07 | 0,57 | -13,55 | 0,2250 | -0,0407 | |||
| RY / Royal Bank of Canada | 0,01 | -2,01 | 0,56 | 5,24 | 0,2203 | 0,0066 | |||
| US0325111070 / Anadarko Petroleum Corp. | 0,01 | -29,79 | 0,54 | -32,75 | 0,2117 | -0,1096 | |||
| VZ / Verizon Communications Inc. | 0,01 | 0,00 | 0,54 | 16,92 | 0,2113 | 0,0268 | |||
| AFL / Aflac Incorporated | 0,01 | -3,44 | 0,53 | 1,72 | 0,2085 | -0,0007 | |||
| US0549371070 / BB&T Corp. | 0,02 | 0,00 | 0,52 | -11,99 | 0,2042 | -0,0327 | |||
| ADM / Archer-Daniels-Midland Company | 0,01 | -1,39 | 0,51 | -2,47 | 0,2015 | -0,0094 | |||
| QGEN / Qiagen N.V. | 0,02 | 0,00 | 0,51 | -19,27 | 0,1987 | -0,0525 | |||
| CBT / Cabot Corporation | 0,01 | 0,00 | 0,51 | 18,22 | 0,1984 | 0,0271 | |||
| IMKTA / Ingles Markets, Incorporated | 0,01 | 0,00 | 0,49 | -14,83 | 0,1936 | -0,0384 | |||
| DVN / Devon Energy Corporation | 0,02 | 10,81 | 0,48 | -4,97 | 0,1874 | -0,0139 | |||
| TWX / Warner Media LLC | 0,01 | 0,00 | 0,47 | 12,20 | 0,1838 | 0,0166 | |||
| PM / Philip Morris International Inc. | 0,00 | 0,00 | 0,45 | 11,60 | 0,1772 | 0,0151 | |||
| FAST / Fastenal Company | 0,01 | 8,43 | 0,44 | 30,09 | 0,1729 | 0,0372 | |||
| WFC / Wells Fargo & Company | 0,01 | 0,00 | 0,44 | -10,95 | 0,1721 | -0,0252 | |||
| SASOF / Sasol Limited | 0,01 | 0,00 | 0,43 | 10,03 | 0,1678 | 0,0121 | |||
| SCL / Stepan Company | 0,01 | 0,00 | 0,42 | 11,11 | 0,1646 | 0,0134 | |||
| WMK / Weis Markets, Inc. | 0,01 | 0,00 | 0,40 | 1,77 | 0,1576 | -0,0005 | |||
| SJM / The J. M. Smucker Company | 0,00 | 0,00 | 0,38 | 5,21 | 0,1505 | 0,0045 | |||
| VLVLY / AB Volvo (publ) - Depositary Receipt (Common Stock) | 0,03 | 0,00 | 0,38 | 17,19 | 0,1470 | 0,0190 | |||
| EXPD / Expeditors International of Washington, Inc. | 0,01 | -6,82 | 0,33 | 0,60 | 0,1305 | -0,0019 | |||
| NWE / NorthWestern Energy Group, Inc. | 0,01 | 0,00 | 0,32 | 13,83 | 0,1258 | 0,0130 | |||
| MKL / Markel Group Inc. | 0,00 | 0,00 | 0,32 | 0,95 | 0,1247 | -0,0014 | |||
| SOMLY / SECOM CO., LTD. - Depositary Receipt (Common Stock) | 0,02 | 0,00 | 0,31 | 9,29 | 0,1200 | 0,0079 | |||
| AHEXF / Adecco Group AG | 0,00 | 0,00 | 0,29 | -6,71 | 0,1145 | -0,0108 | |||
| TUP / Tupperware Brands Corporation | 0,01 | 0,00 | 0,29 | 4,29 | 0,1145 | 0,0024 | |||
| HMC / Honda Motor Co., Ltd. - Depositary Receipt (Common Stock) | 0,01 | -1,87 | 0,29 | -16,08 | 0,1125 | -0,0243 | |||
| DHI / D.R. Horton, Inc. | 0,01 | 0,00 | 0,28 | -5,65 | 0,1113 | -0,0091 | |||
| AGCO / AGCO Corporation | 0,01 | -18,97 | 0,28 | -11,25 | 0,1082 | -0,0163 | |||
| MO / Altria Group, Inc. | 0,00 | 0,00 | 0,24 | 7,59 | 0,0945 | 0,0048 | |||
| SU / Suncor Energy Inc. | 0,01 | 0,00 | 0,23 | 7,91 | 0,0909 | 0,0049 | |||
| 47W / Neurotrope Inc | 0,43 | 0,00 | 0,22 | -13,18 | 0,0878 | -0,0154 | |||
| 748356102 / Questar Corp. | 0,01 | 0,22 | 0,0878 | 0,0878 | |||||
| WU / The Western Union Company | 0,01 | -4,18 | 0,22 | 3,27 | 0,0866 | 0,0010 | |||
| KDSKF / DSM-Firmenich AG | 0,02 | 0,00 | 0,22 | 9,50 | 0,0858 | 0,0058 | |||
| DOW / Dow Inc. | 0,00 | 0,00 | 0,21 | -4,98 | 0,0823 | -0,0061 | |||
| MLM / Martin Marietta Materials, Inc. | 0,00 | 0,21 | 0,0811 | 0,0811 | |||||
| PUKPF / Prudential plc | 0,01 | -9,30 | 0,20 | -10,96 | 0,0796 | 0,0796 | |||
| BP / BP p.l.c. - Depositary Receipt (Common Stock) | 0,01 | 0,00 | 0,20 | 0,0796 | 0,0796 | ||||
| 00B65Z9D7 / Noble Corporation plc | 0,02 | -3,04 | 0,20 | -4,81 | 0,0776 | -0,0056 | |||
| OPK / OPKO Health, Inc. | 0,02 | 0,00 | 0,19 | 3,19 | 0,0760 | 0,0008 | |||
| JOF / Japan Smaller Capitalization Fund, Inc. | 0,02 | -1,52 | 0,19 | -6,93 | 0,0737 | -0,0071 | |||
| SLRC / SLR Investment Corp. | 0,01 | 0,00 | 0,19 | 5,08 | 0,0729 | 0,0021 | |||
| KPELY / Keppel Ltd. - Depositary Receipt (Common Stock) | 0,04 | 0,00 | 0,17 | -3,87 | 0,0682 | -0,0042 | |||
| CODI / Compass Diversified | 0,01 | 0,16 | 0,0631 | 0,0631 | |||||
| IBN / ICICI Bank Limited - Depositary Receipt (Common Stock) | 0,02 | 124,97 | 0,16 | 106,41 | 0,0631 | 0,0319 | |||
| NOBLE GROUP LTD ORD / (G6542T119) | 0,37 | 0,00 | 0,12 | 17,65 | 0,0000 | ||||
| CDI / CDI Corp. | 0,02 | -2,11 | 0,12 | -8,59 | 0,0459 | -0,0054 | |||
| MPX / Marine Products Corporation | 0,01 | 0,00 | 0,11 | 25,88 | 0,0419 | 0,0079 | |||
| CTG / Computer Task Group, Inc. | 0,01 | 0,00 | 0,07 | -22,73 | 0,0267 | -0,0086 | |||
| FSRPF / Frasers Property Limited | 0,01 | 0,00 | 0,01 | 0,00 | 0,0055 | -0,0001 | |||
| XCO / EXCO Resources, Inc. | 0,00 | -100,00 | 0,00 | -100,00 | -0,0096 | ||||
| AAWW / Atlas Air Worldwide Holdings Inc. | 0,00 | -100,00 | 0,00 | -100,00 | -0,1060 | ||||
| EARN / Ellington Credit Company | 0,00 | -100,00 | 0,00 | -100,00 | -0,0500 | ||||
| PCP / Precision Castparts Corporation | 0,00 | -100,00 | 0,00 | -100,00 | -0,0880 | ||||
| IVR / Invesco Mortgage Capital Inc. | 0,00 | -100,00 | 0,00 | -100,00 | -0,0956 | ||||
| DX / Dynex Capital, Inc. | 0,00 | -100,00 | 0,00 | -100,00 | -0,0612 | ||||
| 91911K102 / Bausch Health Companies | 0,00 | -100,00 | 0,00 | -100,00 | -0,1260 | ||||
| TEVA / Teva Pharmaceutical Industries Limited - Depositary Receipt (Common Stock) | 0,00 | -100,00 | 0,00 | -100,00 | -0,0904 | ||||
| TKOMY / Tokio Marine Holdings, Inc. - Depositary Receipt (Common Stock) | 0,00 | -100,00 | 0,00 | -100,00 | -0,0908 | ||||
| PCL / PGIM ETF Trust - PGIM Corporate Bond 10+ Year ETF | 0,00 | -100,00 | 0,00 | -100,00 | -2,2504 | ||||
| JPM / JPMorgan Chase & Co. | 0,00 | -100,00 | 0,00 | -100,00 | -0,0840 |