Grundlæggende statistik
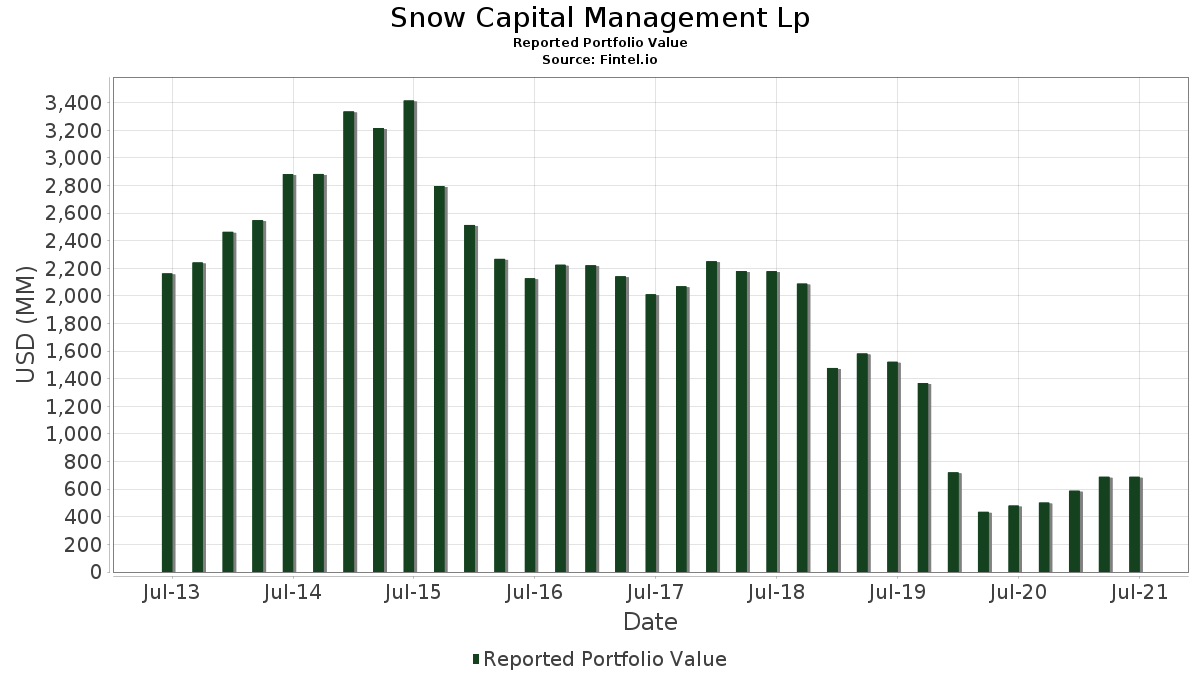
| Porteføljeværdi | $ 703.310.000 |
| Nuværende stillinger | 136 |
Seneste beholdninger, ydeevne, AUM (fra 13F, 13D)
Snow Capital Management Lp har afsløret 136 samlede besiddelser i deres seneste SEC-arkivering. Den seneste porteføljeværdi er beregnet til at være $ 703.310.000 USD. Faktiske aktiver under forvaltning (AUM) er denne værdi plus kontanter (som ikke er oplyst). Snow Capital Management Lps største beholdninger er WESCO International, Inc. (US:WCC) , Commercial Metals Company (US:CMC) , JPMorgan Alerian MLP Index ETN - Corporate Bond/Note (US:AMJ) , Centene Corporation (US:CNC) , and Bank of America Corporation (US:BAC) . Snow Capital Management Lps nye stillinger omfatter Lumentum Holdings Inc. (US:LITE) , Check Point Software Technologies Ltd. (US:CHKP) , NN, Inc. (US:NNBR) , Vistra Corp. (US:VST) , and Sage Therapeutics, Inc. (US:SAGE) .
Top øger dette kvartal
Vi bruger ændringen i porteføljeallokeringen, fordi dette er den mest meningsfulde metrik. Ændringer kan skyldes handler eller ændringer i aktiekurser.
| Sikkerhed | Aktier (MM) |
Værdi (MM$) |
Portefølje % | ΔPortefølje % |
|---|---|---|---|---|
| 0,14 | 11,67 | 1,6599 | 1,6599 | |
| 0,59 | 13,06 | 1,8566 | 1,5161 | |
| 0,06 | 7,04 | 1,0007 | 1,0007 | |
| 0,10 | 9,84 | 1,3991 | 0,8694 | |
| 0,23 | 24,00 | 3,4124 | 0,5901 | |
| 0,06 | 5,48 | 0,7796 | 0,5225 | |
| 0,25 | 9,80 | 1,3930 | 0,3512 | |
| 0,04 | 3,94 | 0,5596 | 0,3057 | |
| 0,11 | 11,49 | 1,6334 | 0,2991 | |
| 0,30 | 21,74 | 3,0915 | 0,2983 |
Top falder i dette kvartal
Vi bruger ændringen i porteføljeallokeringen, fordi dette er den mest meningsfulde metrik. Ændringer kan skyldes handler eller ændringer i aktiekurser.
| Sikkerhed | Aktier (MM) |
Værdi (MM$) |
Portefølje % | ΔPortefølje % |
|---|---|---|---|---|
| 0,04 | 2,91 | 0,4132 | -1,4150 | |
| 0,88 | 14,69 | 2,0881 | -0,6475 | |
| 0,16 | 9,12 | 1,2962 | -0,6383 | |
| 0,72 | 22,25 | 3,1629 | -0,5098 | |
| 0,72 | 12,48 | 1,7752 | -0,4376 | |
| 0,20 | 8,40 | 1,1938 | -0,4351 | |
| 0,12 | 6,28 | 0,8932 | -0,3850 | |
| 0,03 | 0,83 | 0,1184 | -0,2224 | |
| 0,23 | 16,94 | 2,4089 | -0,2075 | |
| 0,23 | 14,46 | 2,0557 | -0,1849 |
13F og Fondsarkivering
Denne formular blev indsendt den 2021-08-24 for rapporteringsperioden 2021-06-30. Klik på linkikonet for at se den fulde transaktionshistorik.
Opgrader for at låse op for premium-data og eksportere til Excel ![]() .
.
| Sikkerhed | Type | Gennemsnitlig aktiekurs | Aktier (MM) |
Δ Aktier (%) |
Δ Aktier (%) |
Værdi ($MM) |
Portefølje (%) |
ΔPortefølje (%) |
|
|---|---|---|---|---|---|---|---|---|---|
| WCC / WESCO International, Inc. | 0,23 | 3,79 | 24,00 | 23,33 | 3,4124 | 0,5901 | |||
| CMC / Commercial Metals Company | 0,72 | -11,81 | 22,25 | -12,15 | 3,1629 | -0,5098 | |||
| AMJ / JPMorgan Alerian MLP Index ETN - Corporate Bond/Note | 0,14 | -2,95 | 21,84 | -0,84 | 3,1055 | -0,0891 | |||
| CNC / Centene Corporation | 0,30 | -1,07 | 21,74 | 12,90 | 3,0915 | 0,2983 | |||
| BAC / Bank of America Corporation | 0,52 | -7,69 | 21,25 | -1,63 | 3,0219 | -0,1116 | |||
| CNO / CNO Financial Group, Inc. | 0,82 | -1,62 | 19,32 | -4,34 | 2,7472 | -0,1821 | |||
| MPC / Marathon Petroleum Corporation | 0,31 | -6,85 | 18,97 | 5,22 | 2,6977 | 0,0824 | |||
| HGH / Hartford Financial Services Group Inc. - FXDFR DB REDEEM 15/04/2042 USD 25 | 0,31 | 6,64 | 18,93 | -1,05 | 2,6913 | -0,0831 | |||
| MET / MetLife, Inc. | 0,30 | -1,34 | 17,66 | -2,87 | 2,5107 | -0,1259 | |||
| TSN / Tyson Foods, Inc. | 0,23 | -5,40 | 16,94 | -6,09 | 2,4089 | -0,2075 | |||
| XEC / Cimarex Energy Co. | 0,23 | -9,01 | 16,63 | 11,00 | 2,3647 | 0,1916 | |||
| JBLU / JetBlue Airways Corporation | 0,88 | -5,62 | 14,69 | -22,14 | 2,0881 | -0,6475 | |||
| LNC / Lincoln National Corporation | 0,23 | -7,26 | 14,46 | -6,41 | 2,0557 | -0,1849 | |||
| BKU / BankUnited, Inc. | 0,34 | -2,18 | 14,36 | -4,98 | 2,0419 | -0,1501 | |||
| FNB / F.N.B. Corporation | 1,16 | -2,26 | 14,32 | -5,10 | 2,0355 | -0,1525 | |||
| GD / General Dynamics Corporation | 0,07 | -2,40 | 13,98 | 1,21 | 1,9885 | -0,0156 | |||
| NCR / NCR Corp. | 0,30 | -19,36 | 13,83 | -3,08 | 1,9663 | -0,1031 | |||
| CNK / Cinemark Holdings, Inc. | 0,59 | 417,09 | 13,06 | 456,13 | 1,8566 | 1,5161 | |||
| FHN / First Horizon Corporation | 0,72 | -19,92 | 12,48 | -18,17 | 1,7752 | -0,4376 | |||
| LITE / Lumentum Holdings Inc. | 0,14 | 11,67 | 1,6599 | 1,6599 | |||||
| PVH / PVH Corp. | 0,11 | 2,25 | 11,49 | 4,07 | 1,6341 | 0,0325 | |||
| BFH / Bread Financial Holdings, Inc. | 0,11 | 34,34 | 11,49 | 24,87 | 1,6334 | 0,2991 | |||
| BTG / B2Gold Corp. | 2,56 | 0,17 | 10,79 | -2,15 | 1,5345 | -0,0651 | |||
| LGF.A / Lions Gate Entertainment Corp. | 0,49 | -26,31 | 10,21 | 2,03 | 1,4518 | 0,0003 | |||
| JNJ / Johnson & Johnson | 0,06 | -1,43 | 10,02 | -1,19 | 1,4244 | -0,0461 | |||
| LMT / Lockheed Martin Corporation | 0,03 | 7,91 | 9,99 | 10,49 | 1,4201 | 0,1090 | |||
| HAS / Hasbro, Inc. | 0,10 | 174,02 | 9,84 | 169,44 | 1,3991 | 0,8694 | |||
| PFE / Pfizer Inc. | 0,25 | 26,18 | 9,80 | 36,39 | 1,3930 | 0,3512 | |||
| CSCO / Cisco Systems, Inc. | 0,18 | -5,47 | 9,51 | -3,11 | 1,3527 | -0,0714 | |||
| BIIB / Biogen Inc. | 0,03 | -0,36 | 9,28 | 23,32 | 1,3188 | 0,2280 | |||
| INTC / Intel Corporation | 0,16 | -22,09 | 9,12 | -31,65 | 1,2962 | -0,6383 | |||
| COG / Cabot Oil & Gas Corp. | 0,51 | 4,68 | 8,96 | -2,67 | 1,2740 | -0,0612 | |||
| URBN / Urban Outfitters, Inc. | 0,20 | -32,55 | 8,40 | -25,24 | 1,1938 | -0,4351 | |||
| IP / International Paper Company | 0,13 | -7,48 | 8,01 | 4,91 | 1,1385 | 0,0316 | |||
| AEL / American Equity Investment Life Holding Company | 0,24 | -1,36 | 7,60 | 1,12 | 1,0800 | -0,0095 | |||
| AMGGF / Alamos Gold Inc. | 0,98 | -0,28 | 7,50 | -2,32 | 1,0667 | -0,0472 | |||
| CHKP / Check Point Software Technologies Ltd. | 0,06 | 7,04 | 1,0007 | 1,0007 | |||||
| ORCL / Oracle Corporation | 0,09 | -0,06 | 6,74 | 10,88 | 0,9580 | 0,0767 | |||
| PHM / PulteGroup, Inc. | 0,12 | -31,49 | 6,28 | -28,72 | 0,8932 | -0,3850 | |||
| DIS / The Walt Disney Company | 0,03 | 0,28 | 6,04 | -4,47 | 0,8595 | -0,0583 | |||
| UMPQ / Umpqua Holdings Corp | 0,31 | -16,04 | 5,78 | -11,74 | 0,8213 | -0,1279 | |||
| BLMN / Bloomin' Brands, Inc. | 0,20 | 13,66 | 5,55 | 14,02 | 0,7897 | 0,0832 | |||
| LUMN / Lumen Technologies, Inc. | 0,41 | 3,14 | 5,55 | 5,00 | 0,7886 | 0,0225 | |||
| NUE / Nucor Corporation | 0,06 | 158,78 | 5,48 | 209,25 | 0,7796 | 0,5225 | |||
| ACCO / ACCO Brands Corporation | 0,62 | 9,83 | 5,37 | 12,31 | 0,7640 | 0,0701 | |||
| OTEX / Open Text Corporation | 0,10 | 0,97 | 5,04 | 7,51 | 0,7162 | 0,0367 | |||
| TFC / Truist Financial Corporation | 0,09 | 15,16 | 5,04 | 9,60 | 0,7162 | 0,0496 | |||
| ABBV / AbbVie Inc. | 0,04 | 27,86 | 4,79 | 33,08 | 0,6806 | 0,1589 | |||
| KSS / Kohl's Corporation | 0,08 | 12,28 | 4,47 | 3,81 | 0,6360 | 0,0110 | |||
| DK / Delek US Holdings, Inc. | 0,20 | 3,31 | 4,43 | 2,55 | 0,6293 | 0,0033 | |||
| SIMO / Silicon Motion Technology Corporation - Depositary Receipt (Common Stock) | 0,07 | 36,70 | 4,27 | 47,53 | 0,6077 | 0,1875 | |||
| MOD / Modine Manufacturing Company | 0,25 | -7,39 | 4,17 | 4,04 | 0,5932 | 0,0116 | |||
| TPR / Tapestry, Inc. | 0,10 | -0,06 | 4,14 | 5,45 | 0,5886 | 0,0192 | |||
| JCOM / J2 Global Inc. | 0,03 | -11,61 | 4,08 | 1,44 | 0,5794 | -0,0032 | |||
| WFC / Wells Fargo & Company | 0,09 | 3,69 | 3,95 | 20,19 | 0,5611 | 0,0849 | |||
| CRI / Carter's, Inc. | 0,04 | 93,72 | 3,94 | 124,79 | 0,5596 | 0,3057 | |||
| ARGO / Argo Group International Holdings, Inc. | 0,01 | -90,35 | 3,80 | -0,63 | 0,5409 | -0,0143 | |||
| MHK / Mohawk Industries, Inc. | 0,02 | 45,76 | 3,63 | 45,67 | 0,5166 | 0,1548 | |||
| PPC / Pilgrim's Pride Corporation | 0,16 | -2,40 | 3,53 | -9,01 | 0,5025 | -0,0608 | |||
| PACW / Pacwest Bancorp | 0,08 | -15,24 | 3,45 | -8,55 | 0,4900 | -0,0565 | |||
| SU / Suncor Energy Inc. | 0,13 | 9,15 | 3,17 | 25,15 | 0,4507 | 0,0834 | |||
| CAH / Cardinal Health, Inc. | 0,05 | 0,05 | 3,01 | -5,99 | 0,4281 | -0,0364 | |||
| NTAP / NetApp, Inc. | 0,04 | -79,53 | 2,91 | -76,95 | 0,4132 | -1,4150 | |||
| DRI / Darden Restaurants, Inc. | 0,02 | -0,28 | 2,87 | 2,54 | 0,4076 | 0,0021 | |||
| BP / BP p.l.c. - Depositary Receipt (Common Stock) | 0,11 | 21,71 | 2,86 | 32,07 | 0,4069 | 0,0926 | |||
| SMCI / Super Micro Computer, Inc. | 0,08 | 1,55 | 2,75 | -8,54 | 0,3912 | -0,0451 | |||
| VSH / Vishay Intertechnology, Inc. | 0,12 | 32,23 | 2,74 | 23,85 | 0,3892 | 0,0686 | |||
| PXD / Pioneer Natural Resources Company | 0,02 | 0,04 | 2,69 | 2,40 | 0,3826 | 0,0015 | |||
| FCF / First Commonwealth Financial Corporation | 0,19 | -5,69 | 2,63 | -7,66 | 0,3738 | -0,0391 | |||
| HPQ / HP Inc. | 0,09 | 3,30 | 2,60 | -1,78 | 0,3694 | -0,0142 | |||
| FLXN / Horizon Funds - Horizon Flexible Income ETF | 0,31 | 0,05 | 2,58 | -8,02 | 0,3668 | -0,0400 | |||
| AMGN / Amgen Inc. | 0,01 | -0,04 | 2,50 | -2,07 | 0,3562 | -0,0148 | |||
| PLAB / Photronics, Inc. | 0,18 | 110,27 | 2,41 | 115,95 | 0,3427 | 0,1808 | |||
| VRA / Vera Bradley, Inc. | 0,19 | 254,16 | 2,40 | 334,18 | 0,3414 | 0,2612 | |||
| NVT / nVent Electric plc | 0,08 | -5,49 | 2,40 | 5,78 | 0,3410 | 0,0122 | |||
| FMBI / First Midwest Bancorp, Inc. | 0,12 | -0,53 | 2,31 | -9,94 | 0,3286 | -0,0436 | |||
| AM / Antero Midstream Corporation | 0,20 | -0,00 | 2,04 | 15,07 | 0,2899 | 0,0329 | |||
| OFG / OFG Bancorp | 0,09 | -6,27 | 2,02 | -8,34 | 0,2874 | -0,0324 | |||
| TMHC / Taylor Morrison Home Corporation | 0,07 | -1,22 | 1,93 | -15,30 | 0,2747 | -0,0561 | |||
| GS.PRJ / Goldman Sachs Group, 5.50% Dep Shares Fixd/Float Non-Cumul Preferred Stock Ser J | 0,01 | -13,24 | 1,91 | 0,74 | 0,2710 | -0,0034 | |||
| GDXJ / VanEck ETF Trust - VanEck Junior Gold Miners ETF | 0,04 | 29,01 | 1,87 | 34,03 | 0,2660 | 0,0636 | |||
| GER / GE Capital Global Holdings, LLC - Preferred Security | 0,16 | 0,25 | 1,83 | 18,57 | 0,2596 | 0,0363 | |||
| AMLP / ALPS ETF Trust - Alerian MLP ETF | 0,05 | -17,63 | 1,70 | -1,68 | 0,2419 | -0,0091 | |||
| VUG / Vanguard Index Funds - Vanguard Growth ETF | 0,01 | 0,44 | 1,70 | 12,06 | 0,2417 | 0,0217 | |||
| AXP / American Express Company | 0,01 | 0,05 | 1,51 | 16,83 | 0,2151 | 0,0273 | |||
| CPS / Cooper-Standard Holdings Inc. | 0,05 | 7,81 | 1,50 | -13,96 | 0,2138 | -0,0397 | |||
| NNBR / NN, Inc. | 0,20 | 1,48 | 0,2109 | 0,2109 | |||||
| MPLX / MPLX LP - Limited Partnership | 0,05 | 0,00 | 1,48 | 15,52 | 0,2106 | 0,0246 | |||
| RIO / Rio Tinto Group - Depositary Receipt (Common Stock) | 0,02 | 0,07 | 1,40 | 8,11 | 0,1989 | 0,0112 | |||
| CAT / Caterpillar Inc. | 0,01 | 0,06 | 1,38 | -6,08 | 0,1956 | -0,0168 | |||
| EAT / Brinker International, Inc. | 0,02 | 116,40 | 1,25 | 88,40 | 0,1779 | 0,0816 | |||
| AEO / American Eagle Outfitters, Inc. | 0,03 | -22,02 | 1,24 | 0,08 | 0,1765 | -0,0034 | |||
| CODX / Co-Diagnostics, Inc. | 0,14 | 177,89 | 1,18 | 140,20 | 0,1674 | 0,0963 | |||
| PFF / iShares Trust - iShares Preferred and Income Securities ETF | 0,03 | 408,21 | 1,06 | 420,20 | 0,1501 | 0,1207 | |||
| AMZN / Amazon.com, Inc. | 0,00 | -40,00 | 1,03 | -33,29 | 0,1467 | -0,0776 | |||
| AAWW / Atlas Air Worldwide Holdings Inc. | 0,01 | -12,63 | 0,96 | -1,53 | 0,1369 | -0,0049 | |||
| OXY / Occidental Petroleum Corporation | 0,03 | 0,00 | 0,94 | 17,40 | 0,1334 | 0,0175 | |||
| EFA / iShares Trust - iShares MSCI EAFE ETF | 0,01 | 0,00 | 0,92 | 3,95 | 0,1311 | 0,0024 | |||
| VST / Vistra Corp. | 0,05 | 0,91 | 0,1292 | 0,1292 | |||||
| MJ / Amplify ETF Trust - Amplify Alternative Harvest ETF | 0,04 | 0,00 | 0,84 | -10,12 | 0,1200 | -0,0162 | |||
| NCLH / Norwegian Cruise Line Holdings Ltd. | 0,03 | -66,74 | 0,83 | -64,55 | 0,1184 | -0,2224 | |||
| IWP / iShares Trust - iShares Russell Mid-Cap Growth ETF | 0,01 | 0,00 | 0,78 | 10,94 | 0,1110 | 0,0089 | |||
| UNM / Unum Group | 0,03 | 0,00 | 0,71 | 2,01 | 0,1010 | 0,0000 | |||
| AMG / Affiliated Managers Group, Inc. | 0,00 | -17,77 | 0,71 | -14,82 | 0,1005 | -0,0199 | |||
| SAGE / Sage Therapeutics, Inc. | 0,01 | 0,71 | 0,1005 | 0,1005 | |||||
| CENX / Century Aluminum Company | 0,05 | -11,68 | 0,70 | -35,51 | 0,0997 | -0,0580 | |||
| EEM / iShares, Inc. - iShares MSCI Emerging Markets ETF | 0,01 | 0,00 | 0,69 | 3,44 | 0,0984 | 0,0014 | |||
| SKX / Skechers U.S.A., Inc. | 0,01 | -10,28 | 0,64 | 7,26 | 0,0903 | 0,0044 | |||
| GS.PRD / The Goldman Sachs Group, Inc. - Preferred Stock | 0,02 | 0,00 | 0,59 | 3,68 | 0,0840 | 0,0014 | |||
| JPM.PRC / JPMorgan Chase & Co. - Preferred Stock | 0,02 | 0,00 | 0,58 | 4,91 | 0,0820 | 0,0023 | |||
| HFC / HollyFrontier Corp | 0,02 | 0,39 | 0,58 | -7,69 | 0,0819 | -0,0086 | |||
| LHX / L3Harris Technologies, Inc. | 0,00 | 0,00 | 0,56 | 6,64 | 0,0799 | 0,0035 | |||
| PLAY / Dave & Buster's Entertainment, Inc. | 0,01 | 0,31 | 0,53 | -14,99 | 0,0758 | -0,0152 | |||
| OPTN / OptiNose, Inc. | 0,16 | 8,34 | 0,49 | -8,61 | 0,0694 | -0,0081 | |||
| LTSK / Osaic Financial Services, Inc. - Corporate Bond/Note | 0,02 | 0,00 | 0,46 | 9,38 | 0,0647 | 0,0044 | |||
| DEA / Easterly Government Properties, Inc. | 0,02 | 0,43 | 0,0617 | 0,0617 | |||||
| INDA / iShares Trust - iShares MSCI India ETF | 0,01 | 0,00 | 0,43 | 4,85 | 0,0614 | 0,0017 | |||
| MRK / Merck & Co., Inc. | 0,01 | 0,00 | 0,41 | 0,73 | 0,0586 | -0,0007 | |||
| LIVX / LiveXLive Media Inc | 0,09 | 0,40 | 0,0570 | 0,0570 | |||||
| VZ / Verizon Communications Inc. | 0,01 | 0,18 | 0,38 | -3,53 | 0,0545 | -0,0031 | |||
| IWO / iShares Trust - iShares Russell 2000 Growth ETF | 0,00 | 0,00 | 0,36 | 3,69 | 0,0519 | 0,0008 | |||
| FAX / Abrdn Asia-Pacific Income Fund Inc | 0,08 | 0,00 | 0,34 | 8,49 | 0,0491 | 0,0029 | |||
| AAPL / Apple Inc. | 0,00 | -0,81 | 0,34 | 11,30 | 0,0476 | 0,0040 | |||
| PNC / The PNC Financial Services Group, Inc. | 0,00 | -0,93 | 0,32 | 7,64 | 0,0461 | 0,0024 | |||
| VLO / Valero Energy Corporation | 0,00 | 0,32 | 0,0454 | 0,0454 | |||||
| ATHA / Athira Pharma, Inc. | 0,03 | 0,31 | 0,0437 | 0,0437 | |||||
| GILD / Gilead Sciences, Inc. | 0,00 | 0,27 | 0,0384 | 0,0384 | |||||
| BGS / B&G Foods, Inc. | 0,01 | 1,14 | 0,24 | 6,70 | 0,0340 | 0,0015 | |||
| XOP / SPDR Series Trust - SPDR S&P Oil & Gas Exploration & Production ETF | 0,00 | 0,20 | 0,0291 | 0,0291 | |||||
| VOT / Vanguard Index Funds - Vanguard Mid-Cap Growth ETF | 0,00 | 0,20 | 0,0290 | 0,0290 | |||||
| PG / The Procter & Gamble Company | 0,00 | 0,00 | 0,20 | -0,49 | 0,0287 | -0,0007 | |||
| KMI / Kinder Morgan, Inc. | 0,01 | -23,13 | 0,19 | -15,84 | 0,0264 | -0,0056 | |||
| GE / General Electric Company | 0,01 | 0,00 | 0,18 | 2,33 | 0,0250 | 0,0001 | |||
| VLY / Valley National Bancorp | 0,01 | 0,00 | 0,17 | -2,29 | 0,0243 | -0,0011 | |||
| NLY / Annaly Capital Management, Inc. | 0,02 | 1,15 | 0,14 | 4,41 | 0,0202 | 0,0005 | |||
| TDW.WSA / Tidewater Inc. | 0,05 | 0,00 | 0,06 | -18,18 | 0,0090 | -0,0022 | |||
| / MCDERMOTT INTL INC TRANCHE B WTS 1:1 @ USD 15.98 07-01-27 (NOT LISTED OR TRADING) | 0,13 | 0,00 | 0,00 | 0,0000 | 0,0000 | ||||
| / MCDERMOTT INTL INC TRANCHE A WTS 1:1 @ USD 12.33 07-01-27 (NOT LISTED OR TRADING) | 0,12 | 0,00 | 0,00 | -100,00 | -0,0001 |