Grundlæggende statistik
| Porteføljeværdi | $ 48.875.000 |
| Nuværende stillinger | 67 |
Seneste beholdninger, ydeevne, AUM (fra 13F, 13D)
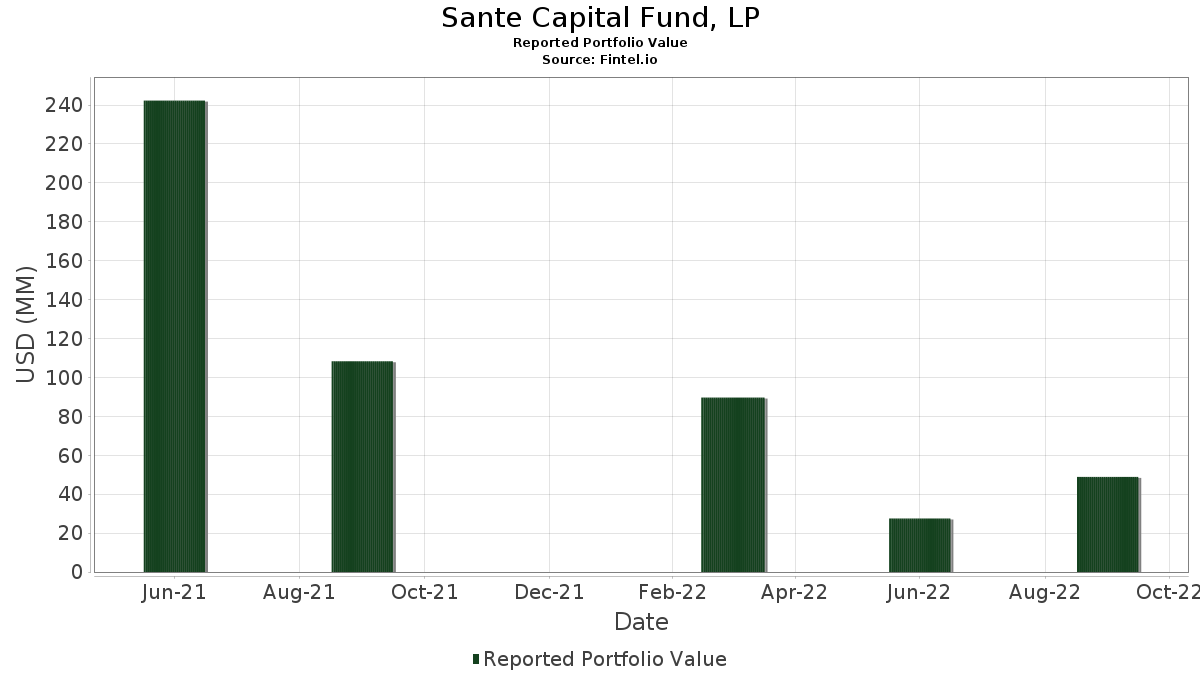
Sante Capital Fund, LP har afsløret 67 samlede besiddelser i deres seneste SEC-arkivering. Den seneste porteføljeværdi er beregnet til at være $ 48.875.000 USD. Faktiske aktiver under forvaltning (AUM) er denne værdi plus kontanter (som ikke er oplyst). Sante Capital Fund, LPs største beholdninger er Amgen Inc. (US:AMGN) , Johnson & Johnson (US:JNJ) , Constellation Brands, Inc. (US:STZ) , Hormel Foods Corporation (US:HRL) , and General Mills, Inc. (US:GIS) . Sante Capital Fund, LPs nye stillinger omfatter Johnson & Johnson (US:JNJ) , Constellation Brands, Inc. (US:STZ) , Hormel Foods Corporation (US:HRL) , General Mills, Inc. (US:GIS) , and AbbVie Inc. (US:ABBV) .
Top øger dette kvartal
Vi bruger ændringen i porteføljeallokeringen, fordi dette er den mest meningsfulde metrik. Ændringer kan skyldes handler eller ændringer i aktiekurser.
| Sikkerhed | Aktier (MM) |
Værdi (MM$) |
Portefølje % | ΔPortefølje % |
|---|---|---|---|---|
| 0,01 | 2,35 | 4,8143 | 4,8143 | |
| 0,01 | 2,18 | 4,4522 | 4,4522 | |
| 0,01 | 1,45 | 2,9749 | 2,9749 | |
| 0,03 | 1,40 | 2,8604 | 2,8604 | |
| 0,02 | 1,37 | 2,8031 | 2,8031 | |
| 0,01 | 1,36 | 2,7887 | 2,7887 | |
| 0,01 | 1,18 | 2,4164 | 2,4164 | |
| 0,03 | 1,15 | 2,3488 | 2,3488 | |
| 0,00 | 1,07 | 2,1852 | 2,1852 | |
| 0,02 | 1,03 | 2,1095 | 2,1095 |
Top falder i dette kvartal
Vi bruger ændringen i porteføljeallokeringen, fordi dette er den mest meningsfulde metrik. Ændringer kan skyldes handler eller ændringer i aktiekurser.
| Sikkerhed | Aktier (MM) |
Værdi (MM$) |
Portefølje % | ΔPortefølje % |
|---|---|---|---|---|
| 0,00 | 0,00 | -10,1174 | ||
| 0,00 | 0,00 | -6,3620 | ||
| 0,01 | 0,89 | 1,8271 | -5,9164 | |
| 0,00 | 0,00 | -5,1950 | ||
| 0,03 | 1,10 | 2,2547 | -4,9652 | |
| 0,00 | 0,00 | -4,8460 | ||
| 0,01 | 0,66 | 1,3463 | -4,6522 | |
| 0,01 | 0,80 | 1,6450 | -4,0735 | |
| 0,00 | 0,51 | 1,0353 | -3,3200 | |
| 0,01 | 0,69 | 1,4138 | -3,0941 |
13F og Fondsarkivering
Denne formular blev indsendt den 2022-11-14 for rapporteringsperioden 2022-09-30. Klik på linkikonet for at se den fulde transaktionshistorik.
Opgrader for at låse op for premium-data og eksportere til Excel ![]() .
.
| Sikkerhed | Type | Gennemsnitlig aktiekurs | Aktier (MM) |
Δ Aktier (%) |
Δ Aktier (%) |
Værdi ($MM) |
Portefølje (%) |
ΔPortefølje (%) |
|
|---|---|---|---|---|---|---|---|---|---|
| AMGN / Amgen Inc. | 0,01 | 2,35 | 4,8143 | 4,8143 | |||||
| JNJ / Johnson & Johnson | 0,01 | 2,18 | 4,4522 | 4,4522 | |||||
| STZ / Constellation Brands, Inc. | 0,01 | 1,45 | 2,9749 | 2,9749 | |||||
| HRL / Hormel Foods Corporation | 0,03 | 1,40 | 2,8604 | 2,8604 | |||||
| GIS / General Mills, Inc. | 0,02 | 1,37 | 2,8031 | 2,8031 | |||||
| ABBV / AbbVie Inc. | 0,01 | 1,36 | 2,7887 | 2,7887 | |||||
| HSY / The Hershey Company | 0,01 | 1,18 | 2,4164 | 2,4164 | |||||
| PFE / Pfizer Inc. | 0,03 | 1,15 | 2,3488 | 2,3488 | |||||
| MO / Altria Group, Inc. | 0,03 | -42,60 | 1,10 | -44,51 | 2,2547 | -4,9652 | |||
| BRK.B / Berkshire Hathaway Inc. | 0,00 | 1,07 | 2,1852 | 2,1852 | |||||
| BF.B / Brown-Forman Corporation | 0,02 | 1,03 | 2,1095 | 2,1095 | |||||
| MKC / McCormick & Company, Incorporated | 0,01 | 1,01 | 2,0726 | 2,0726 | |||||
| KR / The Kroger Co. | 0,02 | 0,98 | 2,0133 | 2,0133 | |||||
| PM / Philip Morris International Inc. | 0,01 | 0,95 | 1,9519 | 1,9519 | |||||
| WELL / Welltower Inc. | 0,01 | 0,93 | 1,8967 | 1,8967 | |||||
| WMT / Walmart Inc. | 0,01 | 0,93 | 1,8967 | 1,8967 | |||||
| D / Dominion Energy, Inc. | 0,01 | 0,92 | 1,8905 | 1,8905 | |||||
| DTE / DTE Energy Company | 0,01 | -53,81 | 0,89 | -58,08 | 1,8271 | -5,9164 | |||
| TSN / Tyson Foods, Inc. | 0,01 | 0,88 | 1,8046 | 1,8046 | |||||
| SYY / Sysco Corporation | 0,01 | 0,86 | 1,7616 | 1,7616 | |||||
| VZ / Verizon Communications Inc. | 0,02 | 0,81 | 1,6614 | 1,6614 | |||||
| XEL / Xcel Energy Inc. | 0,01 | -43,53 | 0,80 | -48,89 | 1,6450 | -4,0735 | |||
| RTX / RTX Corporation | 0,01 | 0,80 | 1,6266 | 1,6266 | |||||
| ED / Consolidated Edison, Inc. | 0,01 | 0,74 | 1,5079 | 1,5079 | |||||
| SO / The Southern Company | 0,01 | 0,74 | 1,5079 | 1,5079 | |||||
| CNP / CenterPoint Energy, Inc. | 0,03 | -7,11 | 0,71 | -11,54 | 1,4588 | -1,4713 | |||
| CMS / CMS Energy Corporation | 0,01 | 0,71 | 1,4547 | 1,4547 | |||||
| MDLZ / Mondelez International, Inc. | 0,01 | 1,33 | 0,71 | -10,52 | 1,4445 | -1,4239 | |||
| ES / Eversource Energy | 0,01 | -39,60 | 0,69 | -44,27 | 1,4138 | -3,0941 | |||
| DOW / Dow Inc. | 0,02 | 0,69 | 1,4015 | 1,4015 | |||||
| EQR / Equity Residential | 0,01 | 0,67 | 1,3790 | 1,3790 | |||||
| AEP / American Electric Power Company, Inc. | 0,01 | 0,67 | 1,3708 | 1,3708 | |||||
| PEG / Public Service Enterprise Group Incorporated | 0,01 | -55,10 | 0,66 | -60,12 | 1,3463 | -4,6522 | |||
| ETR / Entergy Corporation | 0,01 | -38,94 | 0,64 | -45,46 | 1,3156 | -2,9706 | |||
| T / AT&T Inc. | 0,04 | 0,64 | 1,3115 | 1,3115 | |||||
| ZTS / Zoetis Inc. | 0,00 | 0,62 | 1,2624 | 1,2624 | |||||
| NEE.PRN / NextEra Energy Capital Holdings, Inc. - Corporate Bond/Note | 0,01 | -32,00 | 0,59 | -31,16 | 1,2072 | -1,9084 | |||
| V / Visa Inc. | 0,00 | 0,59 | 1,2010 | 1,2010 | |||||
| AVB / AvalonBay Communities, Inc. | 0,00 | 0,58 | 1,1826 | 1,1826 | |||||
| EXC / Exelon Corporation | 0,02 | 0,40 | 0,57 | -17,03 | 1,1662 | -1,3313 | |||
| LYB / LyondellBasell Industries N.V. | 0,01 | 0,56 | 1,1376 | 1,1376 | |||||
| PSA / Public Storage | 0,00 | -14,19 | 0,55 | -19,65 | 1,1294 | -1,3681 | |||
| INVH / Invitation Homes Inc. | 0,02 | 0,55 | 1,1294 | 1,1294 | |||||
| CCI / Crown Castle Inc. | 0,00 | 0,55 | 1,1212 | 1,1212 | |||||
| O / Realty Income Corporation | 0,01 | 0,52 | 1,0680 | 1,0680 | |||||
| FE / FirstEnergy Corp. | 0,01 | 0,51 | 1,0517 | 1,0517 | |||||
| AWK / American Water Works Company, Inc. | 0,00 | -51,70 | 0,51 | -57,76 | 1,0353 | -3,3200 | |||
| WEC / WEC Energy Group, Inc. | 0,01 | 0,50 | 1,0292 | 1,0292 | |||||
| IT / Gartner, Inc. | 0,00 | 0,50 | 1,0230 | 1,0230 | |||||
| ARE / Alexandria Real Estate Equities, Inc. | 0,00 | 0,45 | 0,9146 | 0,9146 | |||||
| DUK / Duke Energy Corporation | 0,00 | 0,44 | 0,9043 | 0,9043 | |||||
| VMW / Vmware Inc. - Class A | 0,00 | -7,83 | 0,44 | -13,75 | 0,8982 | -0,9522 | |||
| DRE / Duke Realty Corporation - Preferred Security | 0,01 | 0,43 | 0,8757 | 0,8757 | |||||
| AMT / American Tower Corporation | 0,00 | 0,43 | 0,8716 | 0,8716 | |||||
| AEE / Ameren Corporation | 0,01 | 0,41 | 0,8471 | 0,8471 | |||||
| EXR / Extra Space Storage Inc. | 0,00 | 0,41 | 0,8368 | 0,8368 | |||||
| SBAC / SBA Communications Corporation | 0,00 | 0,40 | 0,8205 | 0,8205 | |||||
| PPL / PPL Corporation | 0,02 | 0,38 | 0,7795 | 0,7795 | |||||
| AJG / Arthur J. Gallagher & Co. | 0,00 | 0,37 | 0,7611 | 0,7611 | |||||
| SRE / Sempra | 0,00 | 0,36 | 0,7366 | 0,7366 | |||||
| EL / The Estée Lauder Companies Inc. | 0,00 | 0,35 | 0,7141 | 0,7141 | |||||
| EIX / Edison International | 0,01 | -63,47 | 0,33 | -67,32 | 0,6772 | -3,0055 | |||
| MSI / Motorola Solutions, Inc. | 0,00 | 0,31 | 0,6384 | 0,6384 | |||||
| CBRE / CBRE Group, Inc. | 0,00 | 0,28 | 0,5729 | 0,5729 | |||||
| CEG / Constellation Energy Corporation | 0,00 | 0,26 | 0,5402 | 0,5402 | |||||
| DLR / Digital Realty Trust, Inc. | 0,00 | 0,24 | 0,4890 | 0,4890 | |||||
| PLD / Prologis, Inc. | 0,00 | 0,20 | 0,4092 | 0,4092 | |||||
| MUFG / Mitsubishi UFJ Financial Group, Inc. - Depositary Receipt (Common Stock) | 0,00 | -100,00 | 0,00 | -100,00 | -0,2436 | ||||
| PEP / PepsiCo, Inc. | 0,00 | -100,00 | 0,00 | -100,00 | -6,3620 | ||||
| DLTR / Dollar Tree, Inc. | 0,00 | -100,00 | 0,00 | -100,00 | -2,7557 | ||||
| SUI / Sun Communities, Inc. | 0,00 | -100,00 | 0,00 | -100,00 | -2,7593 | ||||
| KMB / Kimberly-Clark Corporation | 0,00 | -100,00 | 0,00 | -100,00 | -10,1174 | ||||
| MTD / Mettler-Toledo International Inc. | 0,00 | -100,00 | 0,00 | -100,00 | -0,8870 | ||||
| EW / Edwards Lifesciences Corporation | 0,00 | -100,00 | 0,00 | -100,00 | -1,5269 | ||||
| CHD / Church & Dwight Co., Inc. | 0,00 | -100,00 | 0,00 | -100,00 | -4,8460 | ||||
| WAT / Waters Corporation | 0,00 | -100,00 | 0,00 | -100,00 | -2,0213 | ||||
| WBT / Welbilt Inc | 0,00 | -100,00 | 0,00 | -100,00 | -1,2215 | ||||
| AVTR.PRA / Avantor, Inc. Series A Mandatory Convertible Preferred Stock | 0,00 | -100,00 | 0,00 | -100,00 | -1,7377 | ||||
| IQV / IQVIA Holdings Inc. | 0,00 | -100,00 | 0,00 | -100,00 | -1,0543 | ||||
| PG / The Procter & Gamble Company | 0,00 | -100,00 | 0,00 | -100,00 | -5,1950 |