Grundlæggende statistik
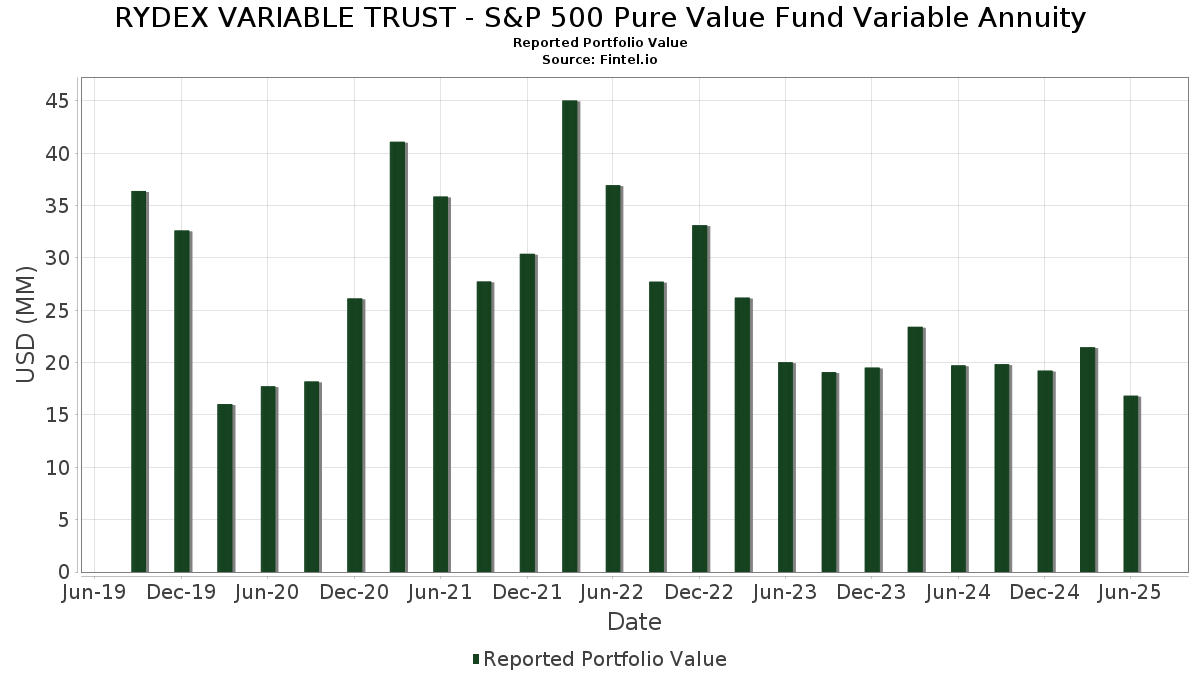
| Porteføljeværdi | $ 16.837.323 |
| Nuværende stillinger | 109 |
Seneste beholdninger, ydeevne, AUM (fra 13F, 13D)
RYDEX VARIABLE TRUST - S&P 500 Pure Value Fund Variable Annuity har afsløret 109 samlede besiddelser i deres seneste SEC-arkivering. Den seneste porteføljeværdi er beregnet til at være $ 16.837.323 USD. Faktiske aktiver under forvaltning (AUM) er denne værdi plus kontanter (som ikke er oplyst). RYDEX VARIABLE TRUST - S&P 500 Pure Value Fund Variable Annuitys største beholdninger er CVS Health Corporation (US:CVS) , The Mosaic Company (US:MOS) , Ford Motor Company (US:F) , General Motors Company (US:GM) , and Archer-Daniels-Midland Company (US:ADM) .
Top øger dette kvartal
Vi bruger ændringen i porteføljeallokeringen, fordi dette er den mest meningsfulde metrik. Ændringer kan skyldes handler eller ændringer i aktiekurser.
| Sikkerhed | Aktier (MM) |
Værdi (MM$) |
Portefølje % | ΔPortefølje % |
|---|---|---|---|---|
| 0,01 | 0,45 | 2,6761 | 0,6567 | |
| 0,00 | 0,33 | 1,9833 | 0,4293 | |
| 0,00 | 0,17 | 1,0233 | 0,3726 | |
| 0,00 | 0,25 | 1,4550 | 0,3309 | |
| 0,00 | 0,30 | 1,7586 | 0,2893 | |
| 0,00 | 0,29 | 1,7447 | 0,2617 | |
| 0,01 | 0,17 | 0,9992 | 0,2308 | |
| 0,01 | 0,21 | 1,2313 | 0,2185 | |
| 0,00 | 0,22 | 1,2959 | 0,1802 | |
| 0,00 | 0,27 | 1,5981 | 0,1693 |
Top falder i dette kvartal
Vi bruger ændringen i porteføljeallokeringen, fordi dette er den mest meningsfulde metrik. Ændringer kan skyldes handler eller ændringer i aktiekurser.
| Sikkerhed | Aktier (MM) |
Værdi (MM$) |
Portefølje % | ΔPortefølje % |
|---|---|---|---|---|
| 0,01 | 0,38 | 2,2737 | -0,3179 | |
| 0,00 | 0,17 | 1,0082 | -0,2922 | |
| 0,00 | 0,27 | 1,6225 | -0,2636 | |
| 0,01 | 0,19 | 1,1325 | -0,2277 | |
| 0,00 | 0,10 | 0,6152 | -0,2115 | |
| 0,00 | 0,10 | 0,5675 | -0,1861 | |
| 0,00 | 0,13 | 0,7465 | -0,1795 | |
| 0,00 | 0,16 | 0,9536 | -0,1731 | |
| 0,00 | 0,17 | 0,9890 | -0,1694 | |
| 0,00 | 0,27 | 1,6004 | -0,1657 |
13F og Fondsarkivering
Denne formular blev indsendt den 2025-08-27 for rapporteringsperioden 2025-06-30. Klik på linkikonet for at se den fulde transaktionshistorik.
Opgrader for at låse op for premium-data og eksportere til Excel ![]() .
.
| Sikkerhed | Type | Gennemsnitlig aktiekurs | Aktier (MM) |
Δ Aktier (%) |
Δ Aktier (%) |
Værdi ($MM) |
Portefølje (%) |
ΔPortefølje (%) |
|
|---|---|---|---|---|---|---|---|---|---|
| CVS / CVS Health Corporation | 0,01 | -21,04 | 0,56 | -19,63 | 3,3267 | -0,0034 | |||
| MOS / The Mosaic Company | 0,01 | -21,04 | 0,45 | 6,62 | 2,6761 | 0,6567 | |||
| F / Ford Motor Company | 0,04 | -21,03 | 0,44 | -14,64 | 2,6287 | 0,1522 | |||
| GM / General Motors Company | 0,01 | -21,04 | 0,41 | -17,27 | 2,4415 | 0,0635 | |||
| ADM / Archer-Daniels-Midland Company | 0,01 | -21,04 | 0,39 | -13,23 | 2,2947 | 0,1674 | |||
| CNC / Centene Corporation | 0,01 | -21,03 | 0,38 | -29,47 | 2,2737 | -0,3179 | |||
| CH1300646267 / Bunge Global SA | 0,00 | -21,03 | 0,36 | -16,89 | 2,1567 | 0,0644 | |||
| PARA / Paramount Global | 0,03 | -21,03 | 0,35 | -14,91 | 2,0640 | 0,1138 | |||
| DG / Dollar General Corporation | 0,00 | -21,04 | 0,33 | 2,77 | 1,9833 | 0,4293 | |||
| VLO / Valero Energy Corporation | 0,00 | -21,03 | 0,32 | -19,75 | 1,8809 | -0,0024 | |||
| KR / The Kroger Co. | 0,00 | -21,03 | 0,31 | -16,27 | 1,8603 | 0,0712 | |||
| CAH / Cardinal Health, Inc. | 0,00 | -21,01 | 0,30 | -3,90 | 1,7586 | 0,2893 | |||
| C / Citigroup Inc. | 0,00 | -21,04 | 0,29 | -5,47 | 1,7447 | 0,2617 | |||
| TSN / Tyson Foods, Inc. | 0,00 | -21,03 | 0,27 | -30,89 | 1,6225 | -0,2636 | |||
| HUM / Humana Inc. | 0,00 | -21,07 | 0,27 | -27,03 | 1,6004 | -0,1657 | |||
| MPC / Marathon Petroleum Corporation | 0,00 | -21,05 | 0,27 | -10,03 | 1,5981 | 0,1693 | |||
| WBA / Walgreens Boots Alliance, Inc. | 0,02 | -21,04 | 0,27 | -18,79 | 1,5887 | 0,0133 | |||
| COR / Cencora, Inc. | 0,00 | -21,04 | 0,26 | -14,84 | 1,5667 | 0,0858 | |||
| CI / The Cigna Group | 0,00 | -21,08 | 0,26 | -20,67 | 1,5471 | -0,0230 | |||
| PSX / Phillips 66 | 0,00 | -21,02 | 0,26 | -23,75 | 1,5428 | -0,0843 | |||
| MCK / McKesson Corporation | 0,00 | -21,11 | 0,26 | -13,91 | 1,5410 | 0,0973 | |||
| WBD / Warner Bros. Discovery, Inc. | 0,02 | -21,03 | 0,25 | -15,77 | 1,4902 | 0,0682 | |||
| DLTR / Dollar Tree, Inc. | 0,00 | -21,04 | 0,25 | 4,26 | 1,4550 | 0,3309 | |||
| AIG / American International Group, Inc. | 0,00 | -21,06 | 0,22 | -22,30 | 1,3249 | -0,0471 | |||
| HII / Huntington Ingalls Industries, Inc. | 0,00 | -21,01 | 0,22 | -6,84 | 1,2959 | 0,1802 | |||
| Aptiv plc / EC (JE00BTDN8H13) | 0,00 | -21,03 | 0,22 | -9,28 | 1,2750 | 0,1418 | |||
| L / Loews Corporation | 0,00 | -21,02 | 0,21 | -21,59 | 1,2321 | -0,0268 | |||
| BEN / Franklin Resources, Inc. | 0,01 | -21,03 | 0,21 | -2,36 | 1,2313 | 0,2185 | |||
| IVZ / Invesco Ltd. | 0,01 | -21,04 | 0,20 | -17,84 | 1,1760 | 0,0230 | |||
| KHC / The Kraft Heinz Company | 0,01 | -21,03 | 0,19 | -32,98 | 1,1325 | -0,2277 | |||
| EG / Everest Group, Ltd. | 0,00 | -20,99 | 0,19 | -26,07 | 1,1294 | -0,1004 | |||
| ELV / Elevance Health, Inc. | 0,00 | -21,04 | 0,19 | -29,48 | 1,1244 | -0,1571 | |||
| PRU / Prudential Financial, Inc. | 0,00 | -21,06 | 0,18 | -23,97 | 1,0928 | -0,0652 | |||
| MOH / Molina Healthcare, Inc. | 0,00 | -21,03 | 0,18 | -28,63 | 1,0800 | -0,1370 | |||
| MHK / Mohawk Industries, Inc. | 0,00 | -21,05 | 0,17 | -27,50 | 1,0341 | -0,1139 | |||
| JBL / Jabil Inc. | 0,00 | -21,04 | 0,17 | 26,47 | 1,0233 | 0,3726 | |||
| VTRS / Viatris Inc. | 0,02 | -21,03 | 0,17 | -19,05 | 1,0110 | 0,0061 | |||
| TAP / Molson Coors Beverage Company | 0,00 | -21,02 | 0,17 | -37,50 | 1,0082 | -0,2922 | |||
| HPE / Hewlett Packard Enterprise Company | 0,01 | -21,04 | 0,17 | 4,35 | 0,9992 | 0,2308 | |||
| LKQ / LKQ Corporation | 0,00 | -21,03 | 0,17 | -31,40 | 0,9890 | -0,1694 | |||
| KMX / CarMax, Inc. | 0,00 | -21,04 | 0,16 | -32,20 | 0,9536 | -0,1731 | |||
| CFG / Citizens Financial Group, Inc. | 0,00 | -21,03 | 0,16 | -13,89 | 0,9220 | 0,0618 | |||
| LUV / Southwest Airlines Co. | 0,00 | -21,03 | 0,14 | -23,91 | 0,8333 | -0,0458 | |||
| T / AT&T Inc. | 0,00 | -21,04 | 0,13 | -19,25 | 0,7753 | 0,0031 | |||
| APA / APA Corporation | 0,01 | -21,03 | 0,13 | -31,52 | 0,7517 | -0,1287 | |||
| LYB / LyondellBasell Industries N.V. | 0,00 | -21,06 | 0,13 | -35,05 | 0,7465 | -0,1795 | |||
| INTC / Intel Corporation | 0,01 | -21,04 | 0,12 | -22,50 | 0,7401 | -0,0246 | |||
| STT / State Street Corporation | 0,00 | -21,02 | 0,12 | -6,82 | 0,7339 | 0,1043 | |||
| MET / MetLife, Inc. | 0,00 | -21,02 | 0,12 | -21,29 | 0,7284 | -0,0126 | |||
| EXC / Exelon Corporation | 0,00 | -21,05 | 0,12 | -26,06 | 0,7282 | -0,0596 | |||
| COF / Capital One Financial Corporation | 0,00 | -21,02 | 0,12 | -6,15 | 0,7247 | 0,1024 | |||
| BBY / Best Buy Co., Inc. | 0,00 | -21,03 | 0,12 | -28,14 | 0,7166 | -0,0842 | |||
| UHS / Universal Health Services, Inc. | 0,00 | -20,96 | 0,12 | -24,18 | 0,6922 | -0,0388 | |||
| SYY / Sysco Corporation | 0,00 | -21,03 | 0,11 | -20,83 | 0,6807 | -0,0066 | |||
| SWK / Stanley Black & Decker, Inc. | 0,00 | -21,05 | 0,11 | -30,62 | 0,6622 | -0,1038 | |||
| DOW / Dow Inc. | 0,00 | -21,02 | 0,10 | -40,46 | 0,6152 | -0,2115 | |||
| NUE / Nucor Corporation | 0,00 | -21,06 | 0,10 | -15,13 | 0,6039 | 0,0319 | |||
| MGM / MGM Resorts International | 0,00 | -21,04 | 0,10 | -8,18 | 0,6002 | 0,0730 | |||
| ALL / The Allstate Corporation | 0,00 | -21,07 | 0,10 | -22,83 | 0,5808 | -0,0283 | |||
| Smurfit WestRock plc / EC (IE00028FXN24) | 0,00 | -21,02 | 0,10 | -24,41 | 0,5734 | -0,0367 | |||
| TGT / Target Corporation | 0,00 | -21,01 | 0,10 | -25,58 | 0,5733 | -0,0446 | |||
| HSIC / Henry Schein, Inc. | 0,00 | -21,04 | 0,10 | -15,79 | 0,5699 | 0,0253 | |||
| CAG / Conagra Brands, Inc. | 0,00 | -21,04 | 0,10 | -39,87 | 0,5675 | -0,1861 | |||
| CZR / Caesars Entertainment, Inc. | 0,00 | -21,04 | 0,10 | -10,38 | 0,5673 | 0,0581 | |||
| EQT / EQT Corporation | 0,00 | -21,05 | 0,10 | -13,64 | 0,5649 | 0,0373 | |||
| EVRG / Evergy, Inc. | 0,00 | -21,02 | 0,09 | -21,01 | 0,5570 | -0,0107 | |||
| AES / The AES Corporation | 0,01 | -21,03 | 0,09 | -32,85 | 0,5461 | -0,1110 | |||
| GPC / Genuine Parts Company | 0,00 | -21,09 | 0,09 | -19,47 | 0,5404 | -0,0009 | |||
| AIZ / Assurant, Inc. | 0,00 | -21,08 | 0,09 | -25,83 | 0,5300 | -0,0440 | |||
| BAC / Bank of America Corporation | 0,00 | -21,04 | 0,09 | -10,20 | 0,5250 | 0,0531 | |||
| SJM / The J. M. Smucker Company | 0,00 | -21,02 | 0,09 | -34,35 | 0,5113 | -0,1170 | |||
| TRV / The Travelers Companies, Inc. | 0,00 | -21,13 | 0,09 | -20,56 | 0,5088 | -0,0044 | |||
| VZ / Verizon Communications Inc. | 0,00 | -21,00 | 0,09 | -24,78 | 0,5080 | -0,0345 | |||
| ED / Consolidated Edison, Inc. | 0,00 | -21,04 | 0,09 | -27,97 | 0,5041 | -0,0621 | |||
| VICI / VICI Properties Inc. | 0,00 | -21,04 | 0,08 | -21,50 | 0,5015 | -0,0099 | |||
| TFC / Truist Financial Corporation | 0,00 | -21,02 | 0,08 | -18,00 | 0,4908 | 0,0121 | |||
| PNW / Pinnacle West Capital Corporation | 0,00 | -21,03 | 0,08 | -26,13 | 0,4897 | -0,0416 | |||
| DVN / Devon Energy Corporation | 0,00 | -21,02 | 0,08 | -32,79 | 0,4892 | -0,0969 | |||
| XOM / Exxon Mobil Corporation | 0,00 | -21,06 | 0,08 | -28,95 | 0,4834 | -0,0603 | |||
| CMCSA / Comcast Corporation | 0,00 | -21,03 | 0,08 | -23,58 | 0,4812 | -0,0258 | |||
| ARE / Alexandria Real Estate Equities, Inc. | 0,00 | -21,06 | 0,08 | -38,28 | 0,4724 | -0,1411 | |||
| FDX / FedEx Corporation | 0,00 | -21,09 | 0,08 | -26,17 | 0,4686 | -0,0439 | |||
| TXT / Textron Inc. | 0,00 | -21,03 | 0,08 | -12,36 | 0,4661 | 0,0387 | |||
| CB / Chubb Limited | 0,00 | -21,05 | 0,08 | -24,27 | 0,4634 | -0,0290 | |||
| MTB / M&T Bank Corporation | 0,00 | -21,10 | 0,08 | -14,44 | 0,4597 | 0,0276 | |||
| ES / Eversource Energy | 0,00 | -21,07 | 0,08 | -19,15 | 0,4504 | 0,0021 | |||
| BIIB / Biogen Inc. | 0,00 | -21,02 | 0,08 | -27,88 | 0,4501 | -0,0496 | |||
| PFG / Principal Financial Group, Inc. | 0,00 | -21,04 | 0,08 | -25,74 | 0,4484 | -0,0371 | |||
| BAX / Baxter International Inc. | 0,00 | -21,03 | 0,07 | -30,84 | 0,4440 | -0,0675 | |||
| LEN / Lennar Corporation | 0,00 | -21,10 | 0,07 | -24,49 | 0,4436 | -0,0259 | |||
| CVX / Chevron Corporation | 0,00 | -21,09 | 0,07 | -32,73 | 0,4411 | -0,0845 | |||
| FANG / Diamondback Energy, Inc. | 0,00 | -21,05 | 0,07 | -32,11 | 0,4395 | -0,0818 | |||
| OXY / Occidental Petroleum Corporation | 0,00 | -21,06 | 0,07 | -32,73 | 0,4385 | -0,0867 | |||
| HBAN / Huntington Bancshares Incorporated | 0,00 | -21,03 | 0,07 | -12,05 | 0,4362 | 0,0381 | |||
| CTRA / Coterra Energy Inc. | 0,00 | -21,02 | 0,07 | -30,77 | 0,4282 | -0,0686 | |||
| KEY / KeyCorp | 0,00 | -21,03 | 0,07 | -14,63 | 0,4196 | 0,0271 | |||
| RF / Regions Financial Corporation | 0,00 | -21,04 | 0,07 | -14,63 | 0,4156 | 0,0242 | |||
| STLD / Steel Dynamics, Inc. | 0,00 | -21,08 | 0,07 | -20,00 | 0,4087 | 0,0015 | |||
| IP / International Paper Company | 0,00 | -20,99 | 0,07 | -30,11 | 0,3853 | -0,0618 | |||
| FOXA / Fox Corporation | 0,00 | -21,06 | 0,06 | -22,89 | 0,3844 | -0,0114 | |||
| GPN / Global Payments Inc. | 0,00 | -21,00 | 0,06 | -35,71 | 0,3765 | -0,0927 | |||
| DD / DuPont de Nemours, Inc. | 0,00 | -21,07 | 0,06 | -27,91 | 0,3714 | -0,0409 | |||
| EMN / Eastman Chemical Company | 0,00 | -21,04 | 0,06 | -32,97 | 0,3618 | -0,0734 | |||
| DHI / D.R. Horton, Inc. | 0,00 | -21,14 | 0,06 | -20,00 | 0,3589 | -0,0023 | |||
| PCG / PG&E Corporation | 0,00 | -21,02 | 0,06 | -36,36 | 0,3350 | -0,0857 | |||
| FOX / Fox Corporation | 0,00 | -21,05 | 0,04 | -23,91 | 0,2110 | -0,0086 | |||
| DE000C4SA6R6 / EURO STOXX 50 Index | 0,03 | 0,1579 | 0,1579 | ||||||
| Barclays Capital, Inc. / RA (N/A) | 0,01 | 0,0681 | 0,0681 | ||||||
| BofA Securities, Inc. / RA (N/A) | 0,01 | 0,0658 | 0,0658 |